Save 23% ($351) & Get a Free 1-1 Call with our Team ⏰ : 0d 2h 59m 43s

Disclaimer: This is not financial or investment advice. You are responsible for any capital-related decisions you make, and only you are accountable for the results.
Jupiter (JUP):
Overview
Jupiter ($JUP) has also seen notable volatility in recent days following the broader market's flushout. The asset recently experienced a shakeout, dropping from its local high of $1.44 on December 5th to a low of $0.93 on December 9th, reflecting the market-wide flush-out of excess leverage.Daily timeframe analysis
On the daily timeframe, Jupiter initially lost the $1.29 support during the market's pullback, breaking below the $1.115 level and ultimately finding support at the 200 EMA, currently trading at $0.977. This level served as a solid base for recovery, with Jupiter rebounding back above the $1.115 support.Jupiter is now trading within the range of $1.115 (support) and $1.29 (resistance). For the asset to regain its bullish momentum, holding the $1.115 support level and remaining above the 200 EMA on the downside is essential. Failure to do so could result in a further decline toward the next significant support zone at $0.872.
On the upside, if Jupiter can reclaim the $1.29 level, the next resistance lies at the local high of $1.44, which was established earlier this month. Breaking this level could open the door to higher price targets, assuming broader market sentiment turns positive.
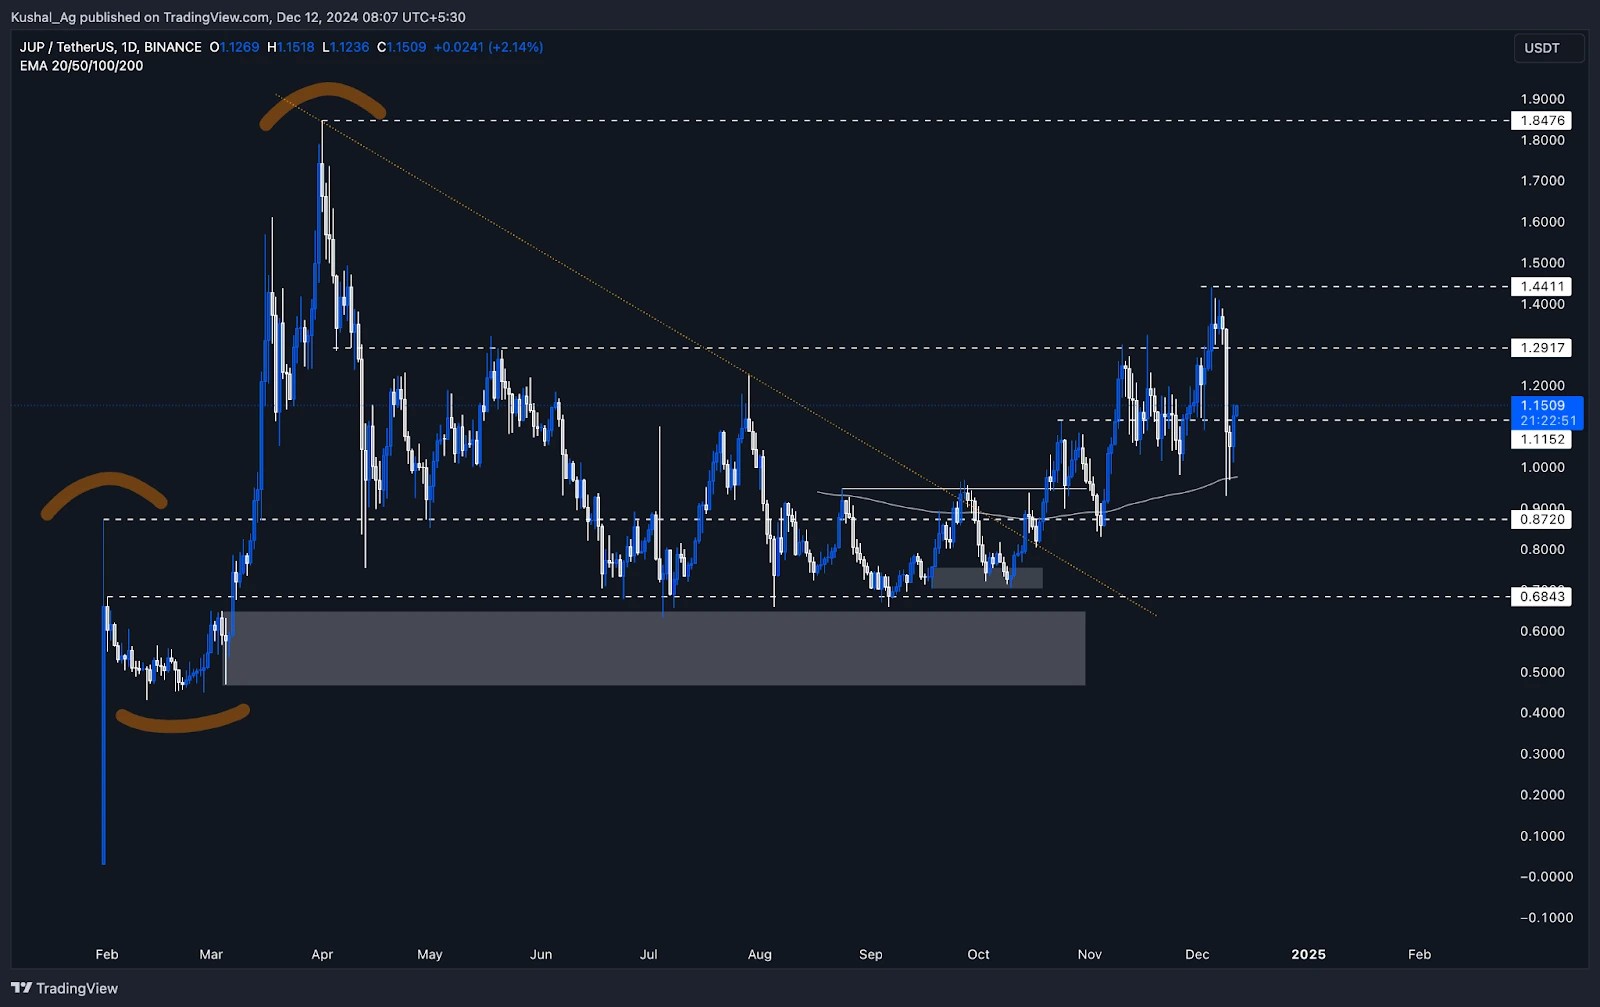
Cryptonary's Take
Despite the shakeout, Jupiter has demonstrated strength by maintaining its bullish structure of higher highs and higher lows on the daily timeframe. The key focus now lies on its ability to sustain above the $1.115 support level and the 200 EMA at $0.977.A consolidation or breakout above $1.29 would be a strong signal for further upside. However, the asset remains susceptible to broader market trends, and traders should monitor its reaction to these critical levels. Jupiter's overall structure remains intact, making it a solid asset to watch in the current environment.
Shiba Inu (SHIB):
Overview
Shiba Inu ($SHIB), one of the most prominent meme coins, continues to maintain its bullish structure despite the recent market-wide volatility. On the daily time frame, $SHIB is currently trading at $0.0000288, showing strength as it respects its yellow uptrend trend line, which has been a crucial dynamic support level for the asset.The asset recently experienced a 27% retracement, coinciding with broader market weakness, but has quickly reclaimed key support levels, signalling resilience and potential for further upward movement. With critical levels now back in focus, $SHIB appears positioned to consolidate or push higher depending on market sentiment.
Daily timeframe analysis
On the daily time frame, $SHIB continues to respect its yellow uptrend trend line, which has provided strong support during dips. After briefly dropping into the $0.0000238 - $0.0000284 zone, which was a significant area of consolidation in November, $SHIB has reclaimed its position above the $0.0000284 support and is now trading at $0.0000288.The price recently faced rejection at the $0.0000328 resistance, which aligns with previous highs and serves as the immediate upside hurdle for $SHIB. If the price breaks above this resistance with momentum, the next target is the March high of $0.0000456, which could act as the next major resistance on the upside.
Key observations:
- The yellow uptrend trend line has remained intact, indicating that the asset is still in a bullish structure.
- The $0.0000238 - $0.0000284 zone served as a strong accumulation area, reinforcing buyer confidence during dips.
- On the downside, if $SHIB retraces further, it is likely to test the yellow trend line or the $0.0000284 level for support.
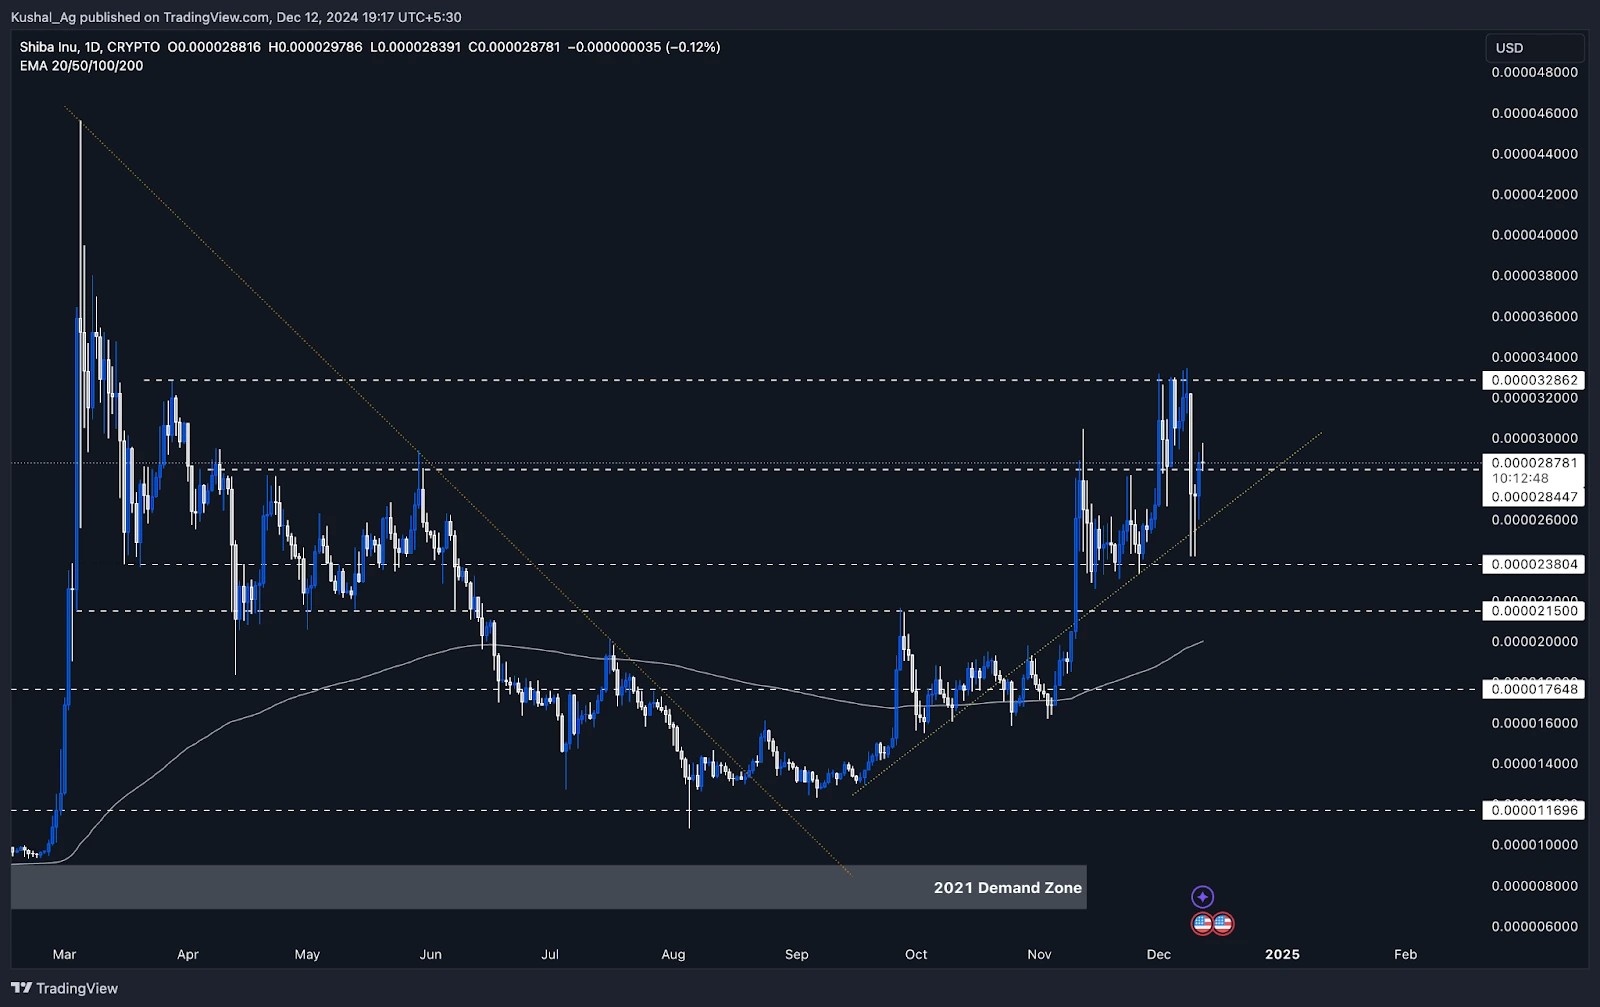
Cryptonary's take
Shiba Inu ($SHIB) has demonstrated strong price action in the face of recent market volatility. The asset's ability to hold key levels and respect its uptrend trend line highlights its underlying strength. The consolidation above $0.0000284 and the bullish structure signal that $SHIB remains well-positioned for future upward moves.While $SHIB must still overcome the $0.0000328 resistance to gain momentum, its current positioning makes it an asset to watch closely. Should $SHIB break out of this resistance, the move toward the $0.0000456 March high could present significant opportunities. However, maintaining support above $0.0000284 is crucial to sustaining its bullish momentum.
Curve DAO (CRV):
Market context
Curve DAO is a cycle old and has experienced significant volatility. Its all-time high sits around $6.70, and the asset is currently down 83% from those highs, reflecting the impact of the bear market.Over the past year, Curve DAO has struggled to establish higher highs, maintaining a bearish trend with swing points marked in August 2022, February 2023, and March 2024. However, that bearish trend has now been broken, offering a potential shift in momentum.
Additionally, the $0.40 level has historically served as a key level of support for Curve DAO. Earlier this year, the market was trading below this level (August through September). Since the post-election rally, the asset has seen a substantial move, surging nearly 500% (480%) within just three weeks.
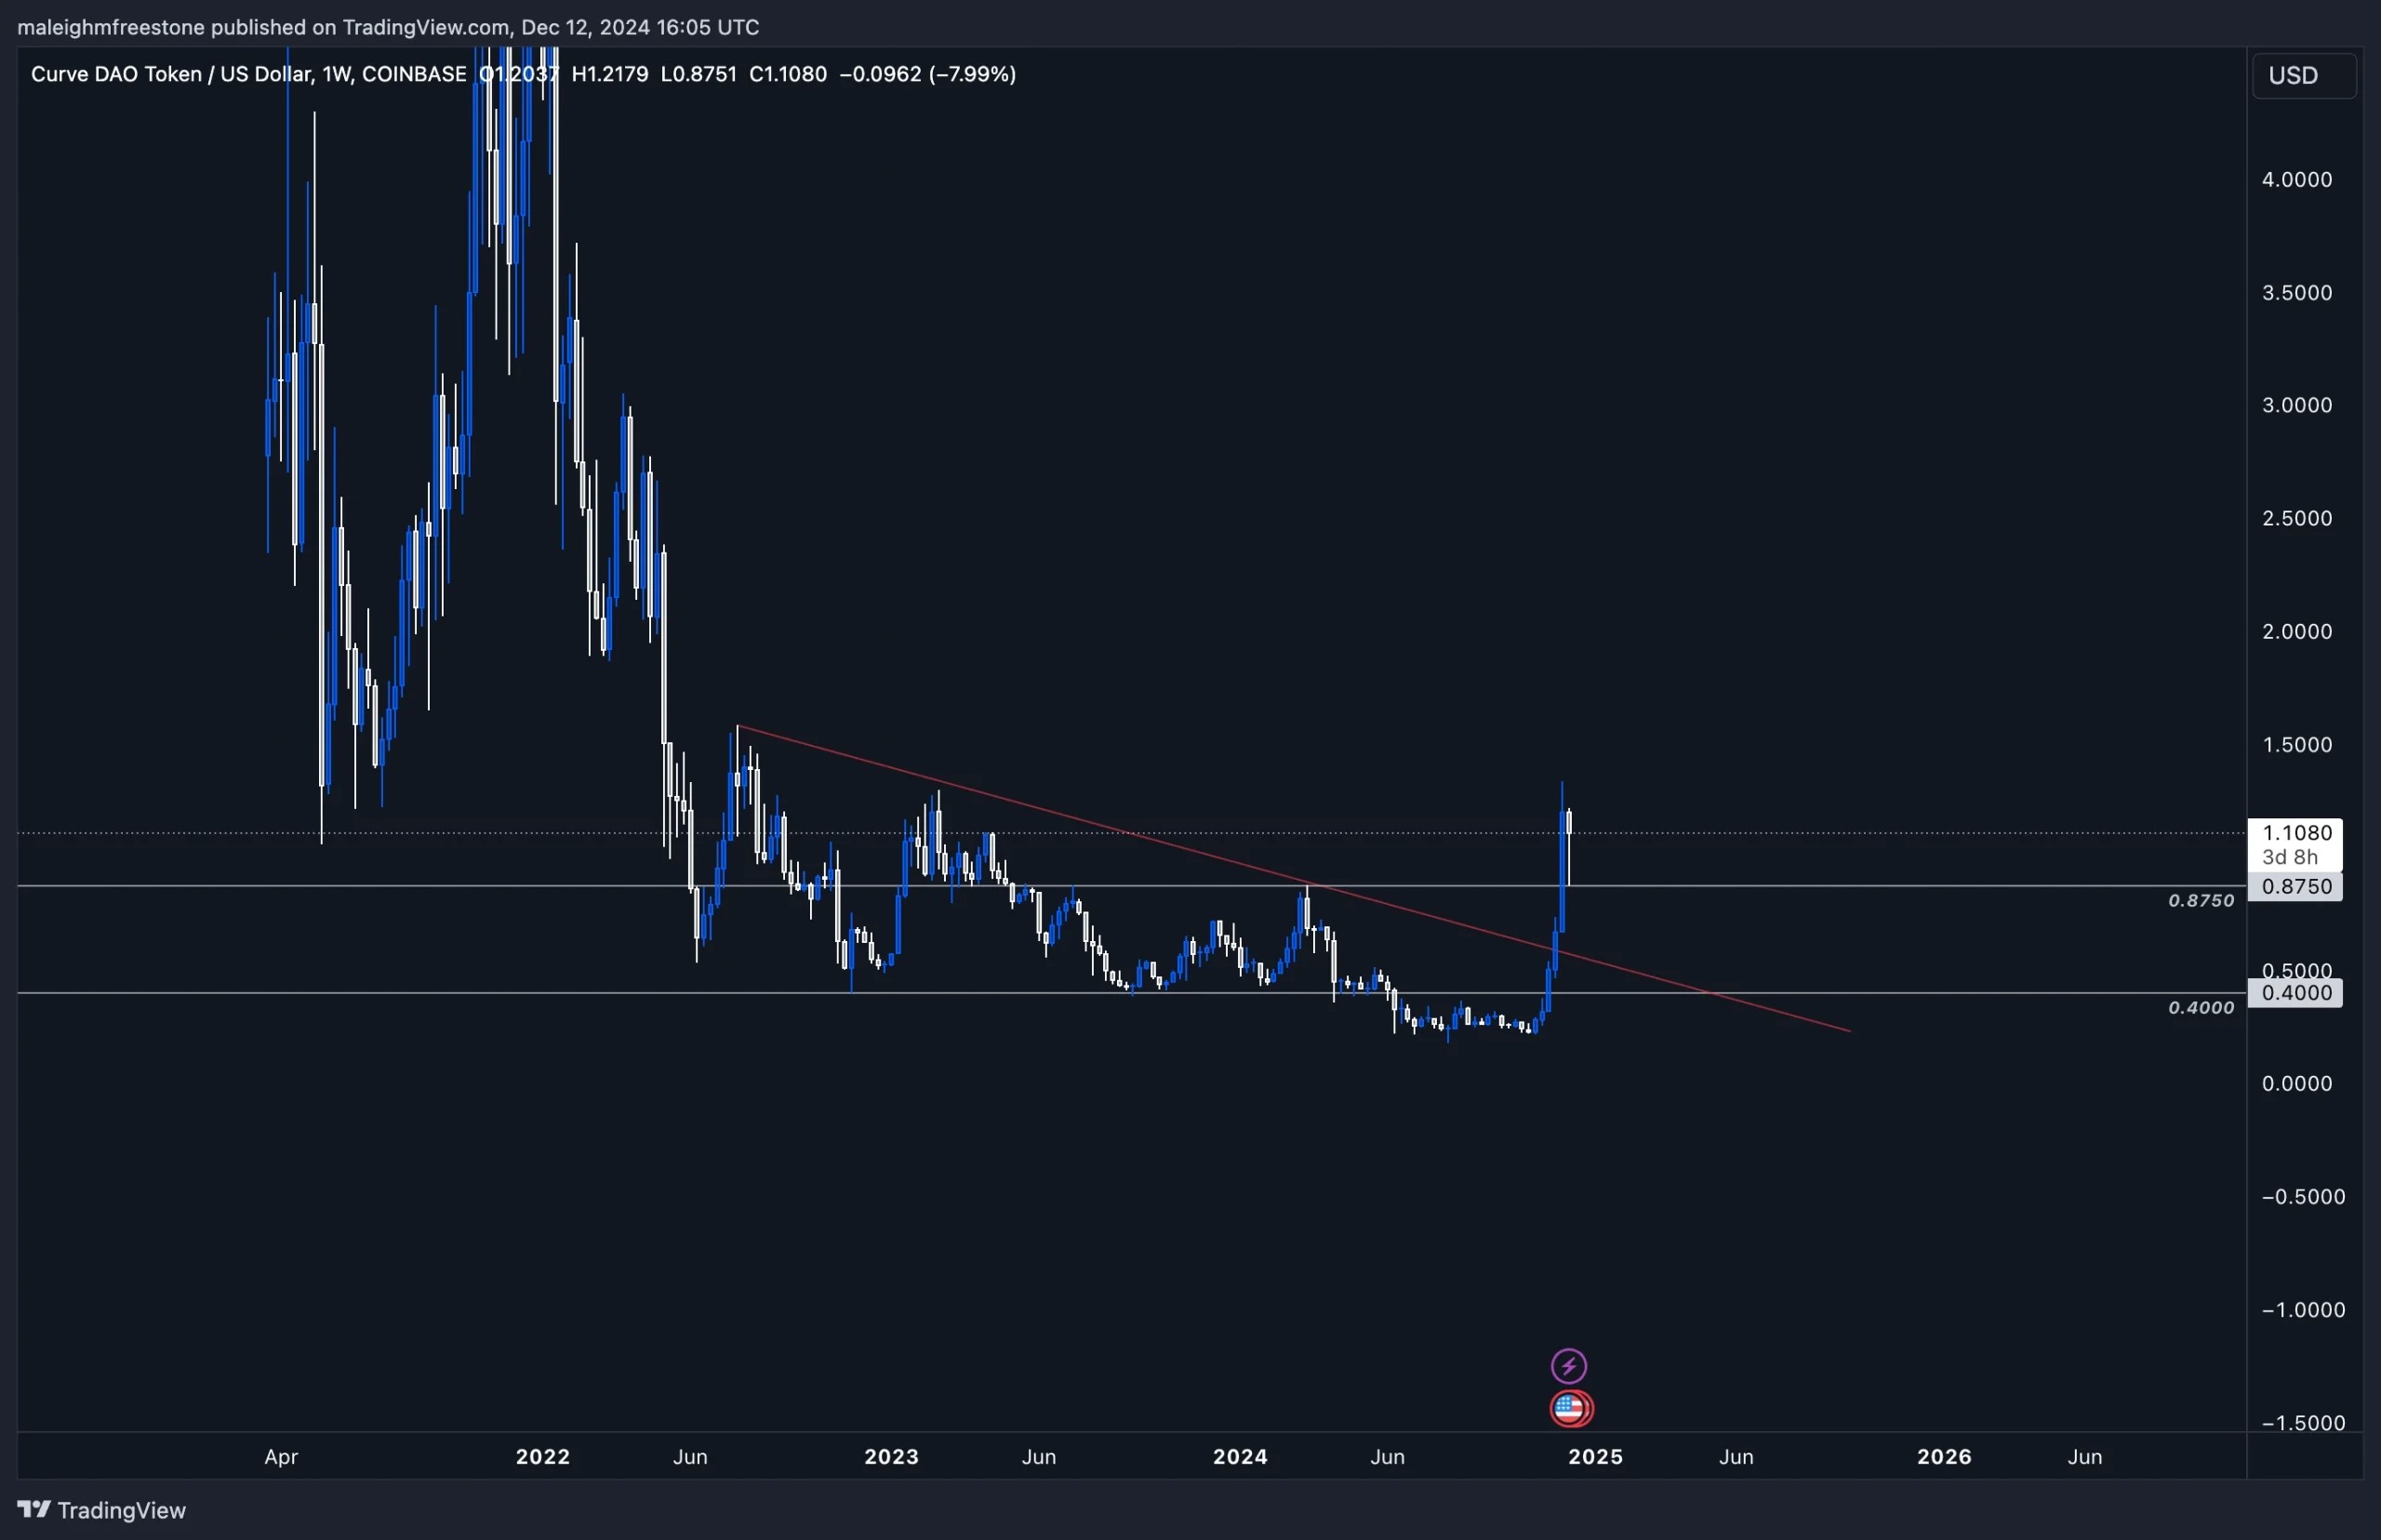
Price action
- The breakout from the bearish trendline is significant and has brought a wave of positive volume into the asset.
- Curve DAO appears to have found support around $0.8750, which aligns nicely with historical resistance-turned-support. This level has acted as key support and resistance in previous cycles, and the market has interacted with it strongly, confirming its importance.
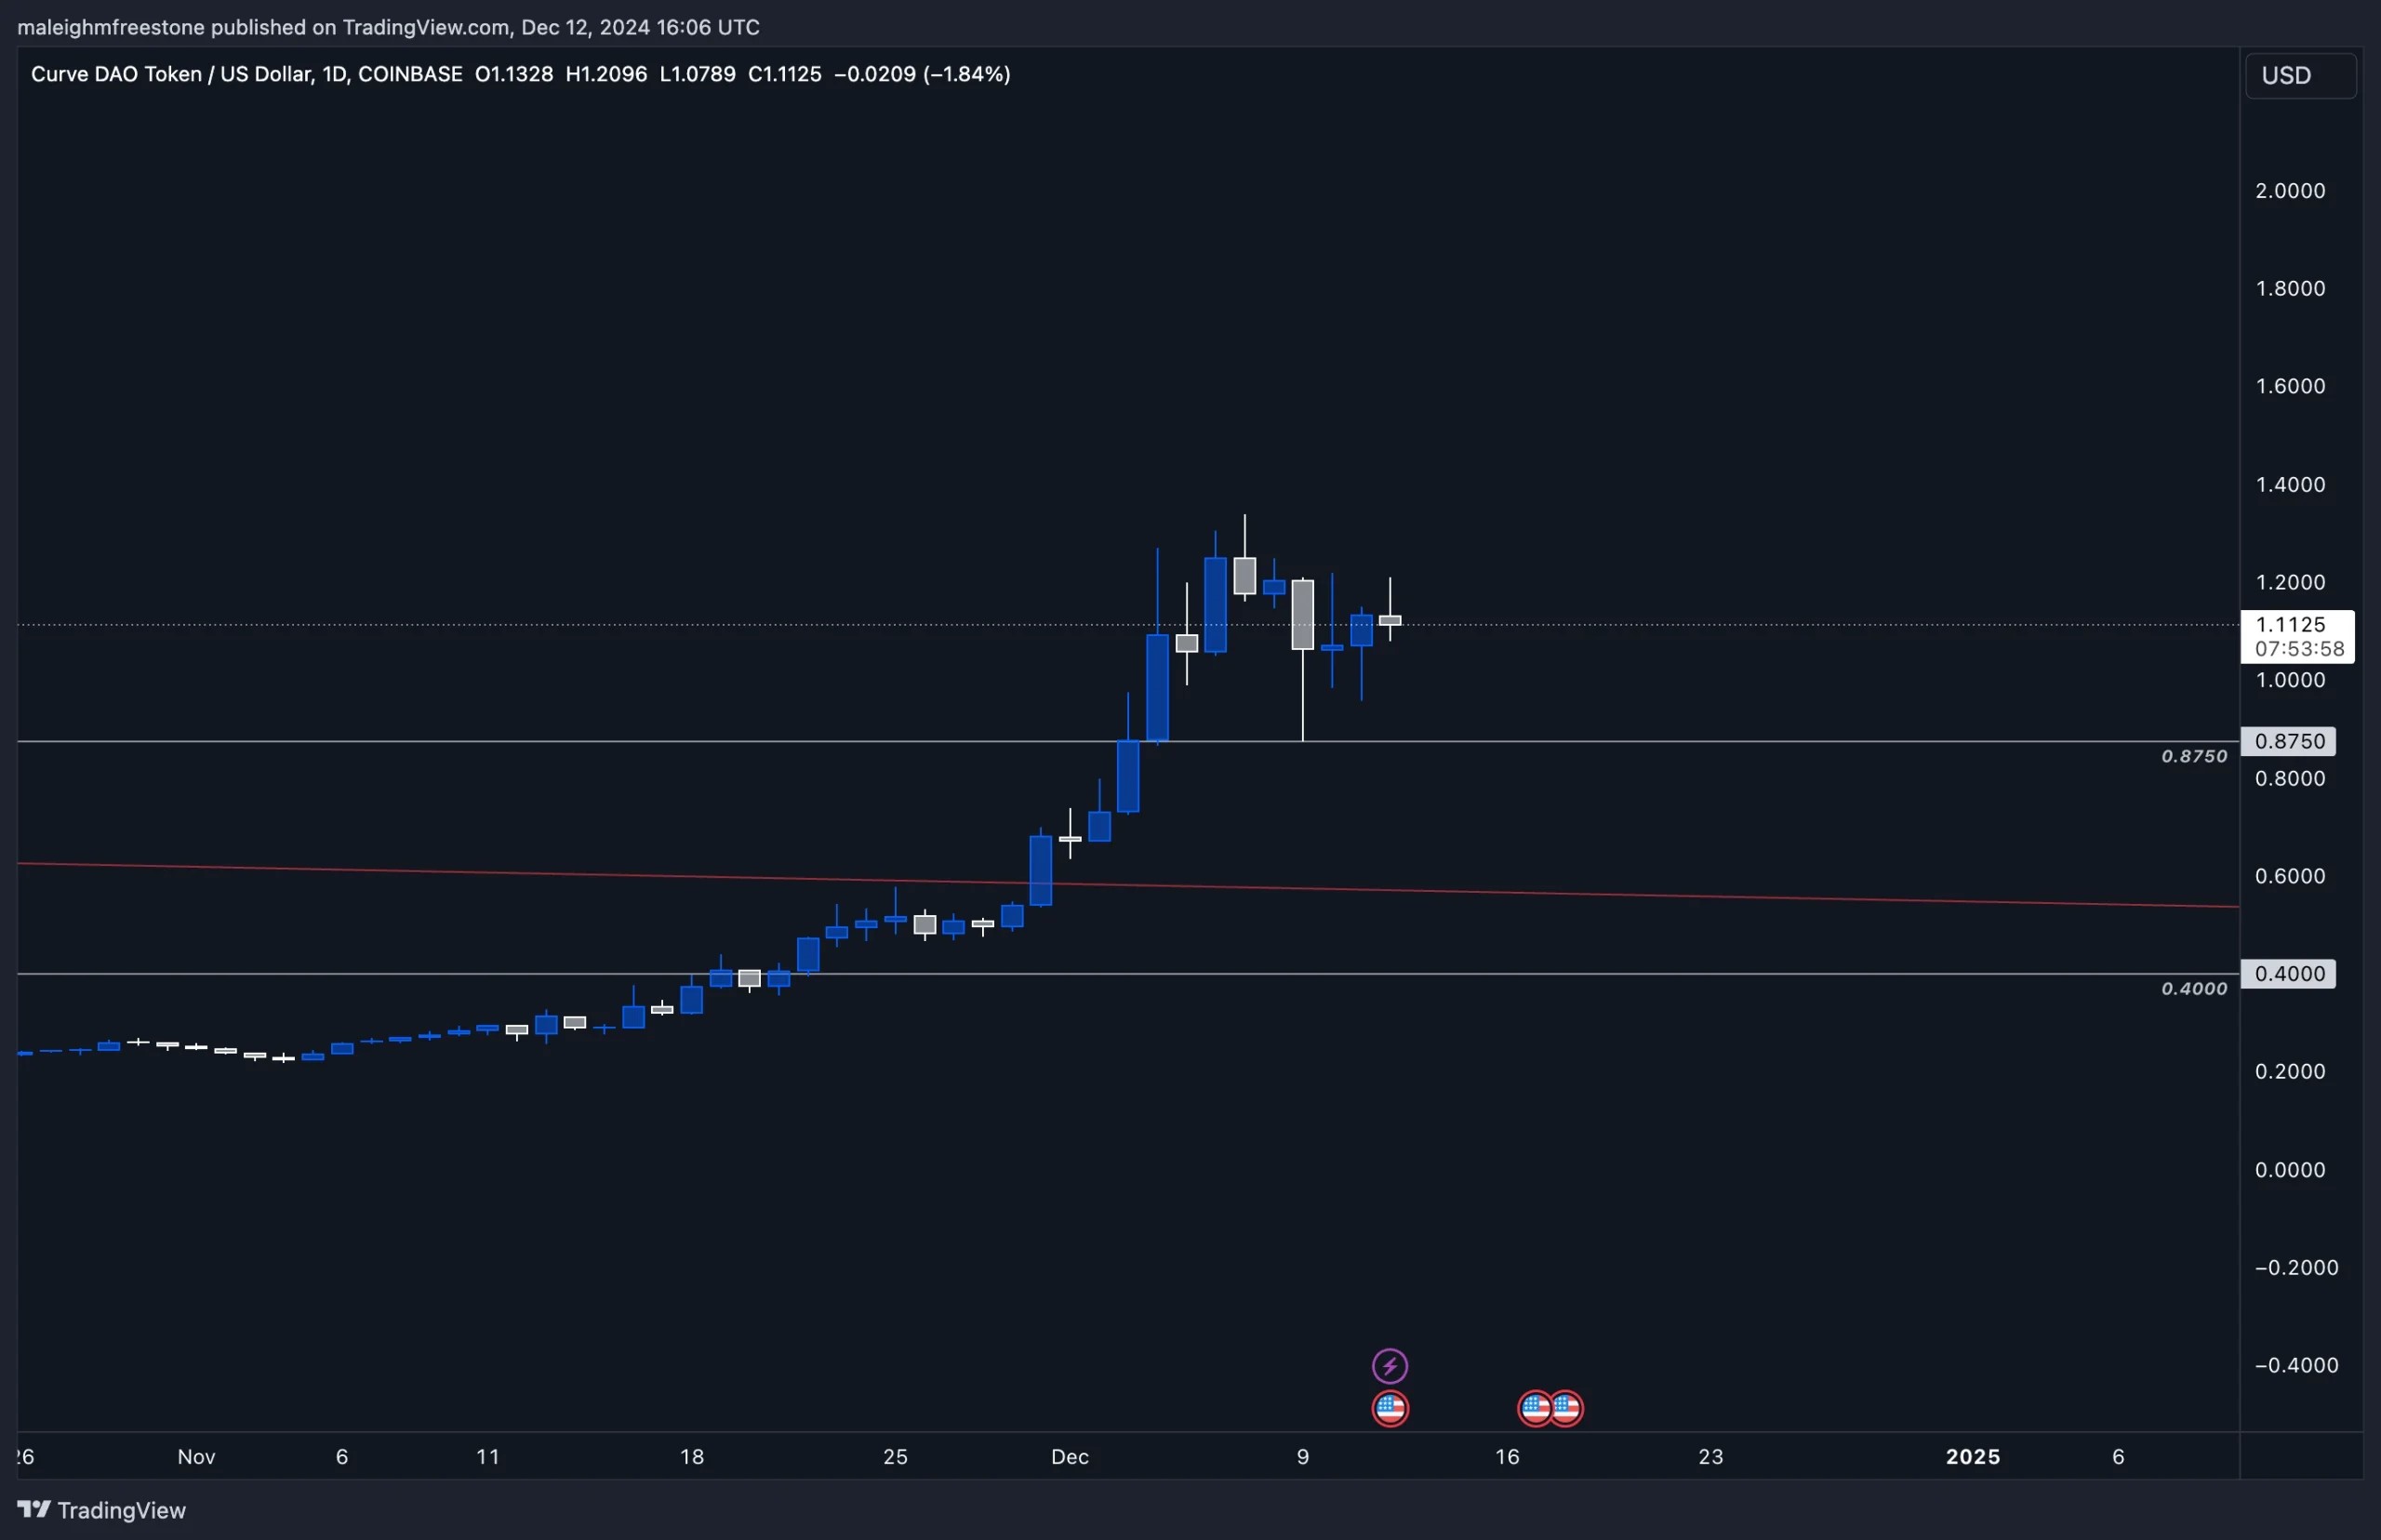
Playbook
Support level to watch
- $0.8750 is the key level to monitor. This is where the market has found recent support and interacted strongly, aligning with historical importance.
Upside potential
- If Curve DAO were to return to its all-time high of $6.70, it would represent a further 500% gain from current levels. However, whether this is realistic or not will depend on sustained volume and broader market conditions.
Caution
- This asset is not part of our portfolio, nor one we actively cover, so it’s crucial to assess the risk independently. While the breakout is positive, this recent surge has come from deeply oversold levels, so volatility and pullbacks are likely.
Cryptonary’s take
Curve DAO’s recent breakout from its bearish trendline and reclaim of $0.8750 is promising, and the 500% move over the past three weeks reflects strong speculative interest. However, traders must consider that the asset is rebounding from the depths, and sustainability is key.If this asset finds sustained volume, there’s potential for a significant upside. That said, it’s critical to approach this with caution, as its history of deep drawdowns highlights the need for strong conviction and disciplined risk management.
Keep $0.8750 on your radar—it’s the level that will determine whether Curve DAO can build further momentum. For now, it’s one to watch, but remain patient and selective before making any moves.
Recommended from Cryptonary


