Save 23% ($351) & Get a Free 1-1 Call with our Team ⏰ : 0d 2h 59m 43s
Critical support levels in focus for Pendle and OP
Pendle and OP are facing essential support zones amid recent market turbulence. Pendle holds strong near $4, while OP consolidates between $1.15 and $1.46. Let's break down their next potential moves.

Disclaimer: This is not financial or investment advice. You are responsible for any capital-related decisions you make, and only you are accountable for the results.
PENDLE:
Overview
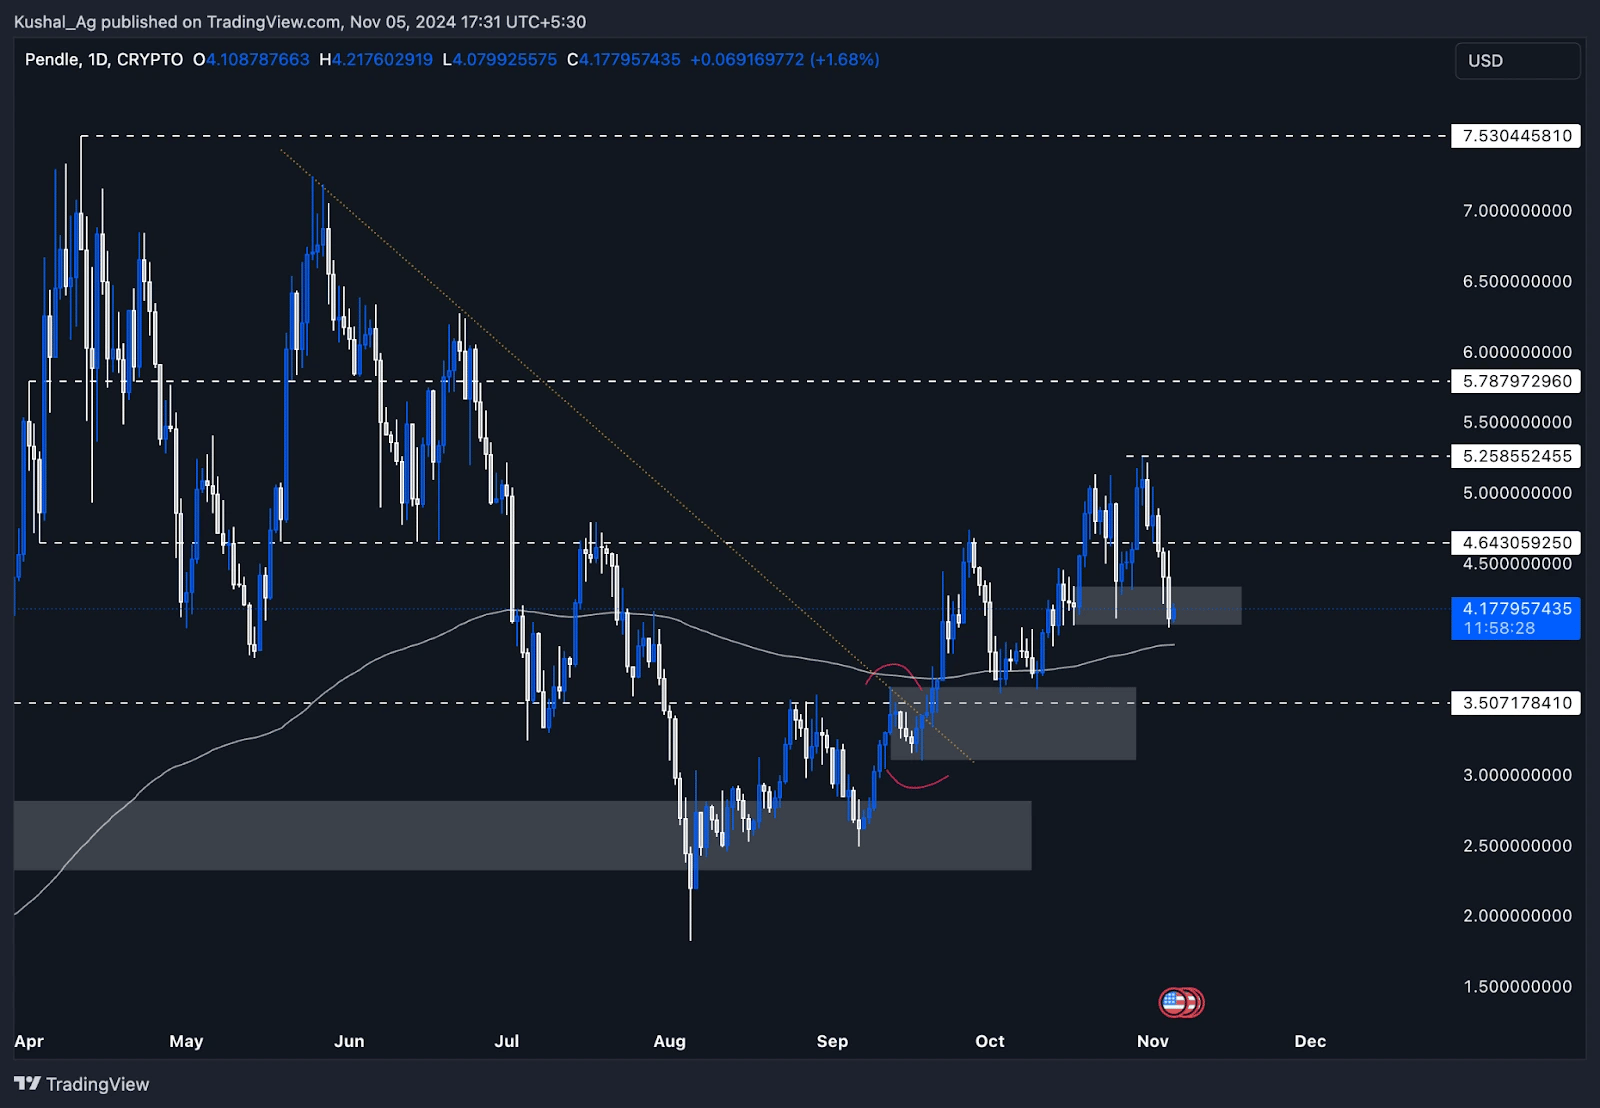
Pendle has demonstrated strong endurance amidst a broader market pullback, retracing to key support areas that may provide a solid foundation for further price action. Currently trading at around $4.17, Pendle dipped to a low of $4.04 yesterday as the wider market experienced some volatility.However, it has since maintained support within a critical daily demand zone, which is reinforced by additional technical levels below.
Daily time frame analysis
- Daily demand zone support: The gray box, representing Pendle's daily demand zone, ranges from $4.00 to $4.33. This area has successfully held the price, underscoring its role as a strong support. The demand zone held up well during yesterday's broader market retracement, suggesting robust buying interest around these levels.
- 200 EMA confluence: Positioned just below the demand zone, the 200 EMA on the daily time frame is trading at $3.92, further strengthening the support around this area. The 200 EMA is a crucial level often watched by traders as it signifies a long-term support base. The combined support from the daily demand zone and the 200 EMA reinforces this area as a potential pivot for Pendle.
- Additional support: Should a deeper pullback occur, the $3.5 level below the 200 EMA acts as another notable support. This area could come into play if there is a liquidity grab on the downside or if the 200 EMA is temporarily breached.
- Upside resistance levels:
- $4.64: Previously, Pendle crossed this level and sustained above it, but the recent market consolidation led to a pullback. Now, $4.64 has become a near-term resistance level to watch for.
- $5.25: This marks the last high Pendle achieved, and a breakout above $5.25 would signify a new higher high in its structure.
- $5.78: This area, marked by a dotted white line on the chart, serves as a longer-term resistance level. Should Pendle surpass $5.25, it may target $5.78 as its next point of resistance.
Cryptonary's take
Pendle's current position within its daily demand zone, along with support from the 200 EMA, presents a favourable structure. This healthy retracement to key support levels suggests a balanced risk-reward setup, particularly with the prospect of Pendle reclaiming higher levels.A successful hold of the 200 EMA and daily demand zone would reinforce bullish sentiment, allowing for potential continuation toward $4.64 and possibly $5.78 if momentum picks up. With robust support on the downside, Pendle looks poised for possible upside movement if the wider market stabilises.
OP:
Overview
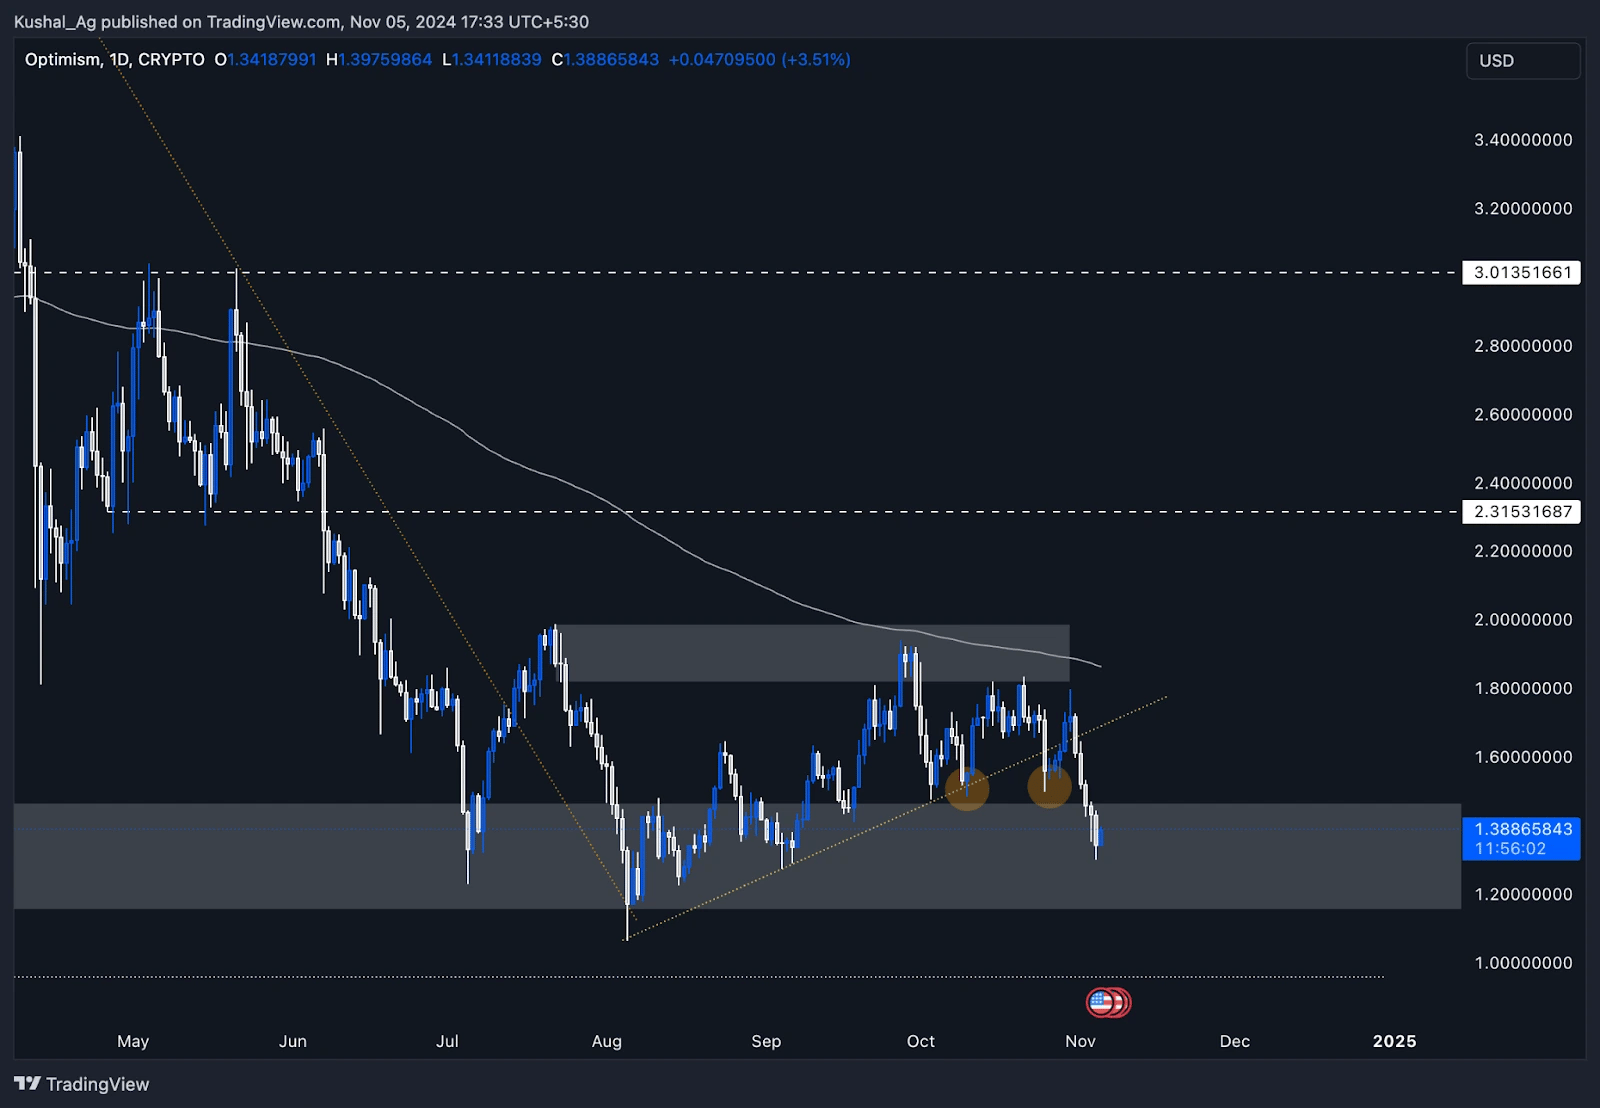
Optimism ($OP) has shown resilience, yet it's navigating a period of consolidation amidst a wider market retracement. The asset is currently positioned within its significant weekly demand zone, ranging from $1.15 to $1.46. This area has provided strong support in previous cycles, and maintaining stability here is key for OP's near-term outlook.Current market outlook
- Weekly demand zone: The demand zone from $1.15 to $1.46 has consistently served as a major support level for OP, helping it build a base for potential moves higher. Now back within this zone, OP is relying on this support to regain footing after breaking down from the yellow dotted trend line.
- Breakdown from trend line: Previously, OP had been trending within a bullish pennant pattern, following a sequence of higher highs and higher lows. However, with recent market pullbacks, OP broke below the yellow trend line, signalling a pause in bullish momentum. This breakdown places emphasis on OP's ability to hold the $1.15 - $1.46 support zone to sustain its structure.
- 200 EMA resistance: In the daily time frame, the 200 EMA currently sits at $1.86, which is a significant resistance level. For OP to establish a solid bullish trend, reclaiming and holding above the 200 EMA will be essential. Trading below the 200 EMA indicates a neutral-to-bearish stance in the near term, and flipping this level into support is a critical step for long-term strength.
Key levels to watch
- Support: Maintaining support within the $1.15 - $1.46 weekly demand zone is crucial for OP to avoid further downside pressure. This zone has historically provided a foundation for reversals and remains a strategic area for potential accumulation.
- Resistance: On the upside, the first target for OP would be to retest the broken yellow trend line and attempt to reclaim it. Beyond that, breaking above the 200 EMA at $1.86 would signal a stronger bullish shift and open the path to higher levels.
Cryptonary's take
Currently, OP is navigating a consolidation phase, with the weekly demand zone providing a solid base. For any renewed bullish momentum, it's essential for OP to hold this zone and regain the yellow trend line.The 200 EMA at $1.86 remains a key resistance, and reclaiming this level would add to the bullish case. For now, OP is at a critical juncture, and its ability to stabilise here will set the tone for upcoming moves.
Recommended from Cryptonary


