Save 23% ($351) & Get a Free 1-1 Call with our Team ⏰ : 0d 2h 59m 44s

We'll also examine key indexes and charts from a slightly zoomed-out view but from across the board.
So, we'll combine some TradFi and crypto information and translate how this potentially sets us up.
Let's get into it.
Key questions
- What are Fed officials really saying about interest rates, and how might it impact crypto in the coming months?
- Is the Dollar Index setting up for a major move? Find out why this could be a game-changer for Bitcoin's price.
- The Big Caps Index is showing a familiar pattern. Could history be about to repeat itself with explosive gains?
- Which key on-chain metrics are flashing bullish signals, and what do they suggest about Bitcoin's potential upside?
- What's our strategic outlook for the rest of 2024, and how can you position yourself to potentially capitalise on it?
Disclaimer: This is not financial or investment advice. You are responsible for any capital-related decisions you make, and only you are accountable for the results. "One Glance" by Cryptonary sometimes uses the RR trading tool to help you quickly understand our analysis. These are not signals, and they are not financial advice.
Fed-speak
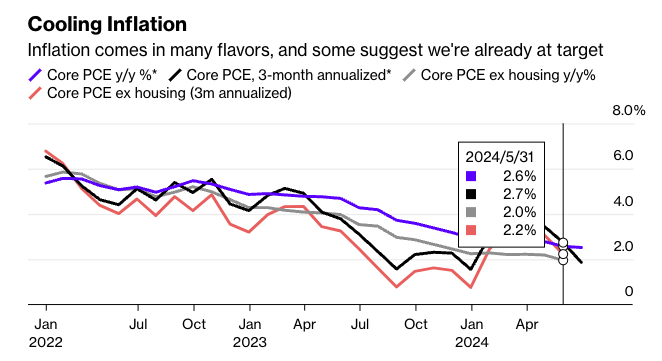
This week, we have had a plethora of Fed-speak, most notably from Chair Powell. However, the general message has been a recognition of cooling inflation data from Fed members. However, more data is needed.Here's what Fed Members said:
- Fed Chair Powell: "The Fed shouldn't wait for 2.0% inflation to begin cutting rates, or they risk being too late." Core PCE YoY is already at 2.6% and has been on a steady downtrend.
- Fed Governor Waller: "We're getting closer to cutting rates, but we're not there yet." He also suggested that he sees current data as consistent with achieving a soft landing.
- Federal Reserve Bank of New York President John Williams: "Recent inflation data has been positive, but we want more evidence."
The above suggests that the Fed are setting up for a September Interest Rate cut, with the potential for the Fed to cut again at the November and December Fed Meetings.
So yes, there will be 3x 25bps Interest Rate cuts for 2024. The data is set up for the first cut to come at the 31st July Meeting (in just under two weeks).
However, the Fed has relied on forward-guiding their moves/thoughts in advance and hasn't forward-guided an Interest Rate cut for the July Meeting.
So, if one then came, it might look like a slight panic, and they wouldn't want to spook markets with that.
Either way, markets are really beginning to price in upcoming Interest Rate cuts, which is why we've seen the Dollar Index decline and the Russel 2000 (small-cap companies) move up, as these are the companies that benefit most from reduced borrowing cuts (which is what lowering Interest Rates is effective.
Indexes
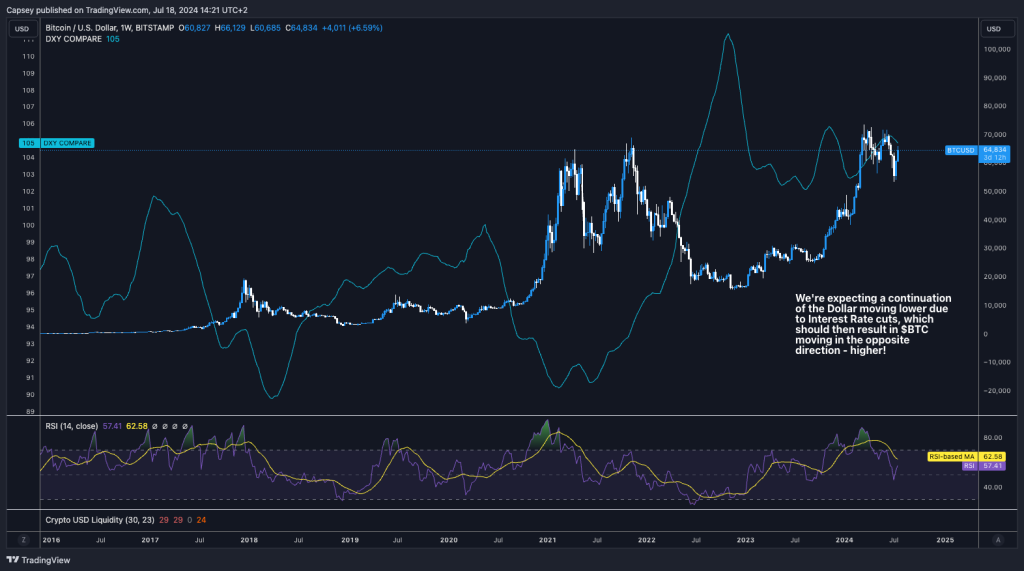
First, we'll look at the Dollar Index ($DXY).If the Fed begin cutting Interest Rates, which the market expects, the Dollar Index will decline due to rate differentials against other currencies.
We can see that historically when the dollar index declined, it was positive for risk assets/crypto. The opposite also is true. In the below, we can see that:
- 2017: $DXY ⬇️, $BTC ⬆️
- 2018: $DXY ⬆️, $BTC ⬇️
- 2019: $DXY ground higher, $BTC range bound.
- 2020: $DXY ⬇️, $BTC ⬆️
- Mid 2021 to 2022: $DXY ⬆️ $BTC ⬇️
Bitcoin Price Against the Dollar Index:
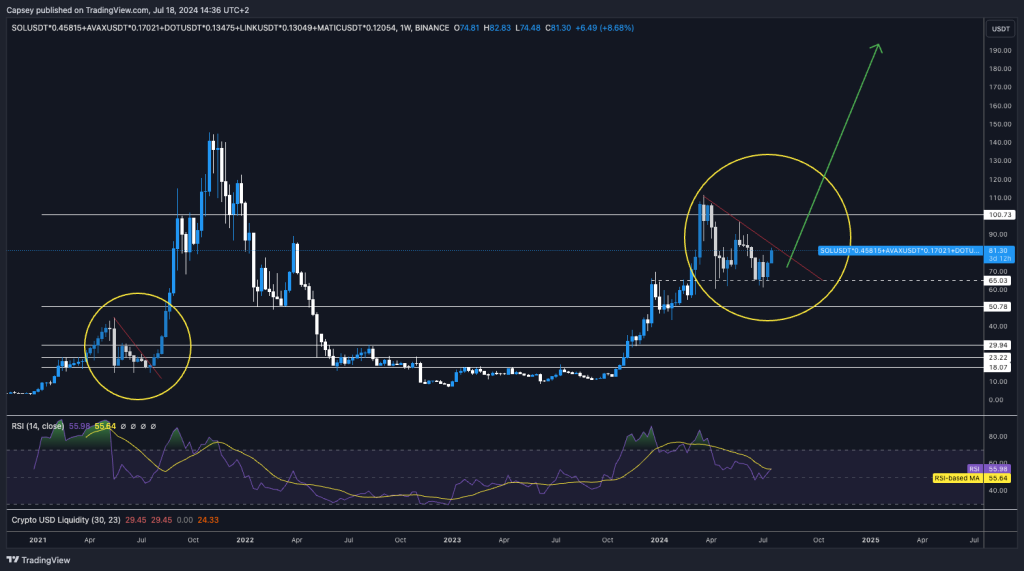
Another key Index we're watching closely is the Big Caps Index. This index is made up of crypto big-cap coins, such as SOL, AVAX, DOT, LINK, and MATIC. Now, we're not big supporters of all these coins, but the index is used to gauge whether that sector of the overall crypto market is, in terms of, is the chart, more bullish or bearish.
Below, we can see that the current setup looks very similar to that of early 2021. We have highlighted the pattern setups using the yellow bubbles on the chart.
There was a big move up from the lows, a meaningful pullback, and consolidation into a local downtrend. price eventually broke out from the downtrend line, and we saw a whopping move to the upside.
If this is correct and plays out as we'd expect, then the Big Caps can likely see a 3-4x increase (as a base case move) over the next 6-12 months.
Big Caps Index 3D chart:
Side Note: If we see a path where Big Caps can do a 3-4x from here over the next 6-12 months, what's the potential gain for SOL? Considering we expect outperformance from SOL. Then, a further note: if SOL can 4-5x (over the next 6-12 months), what could Blue Chip SOL Meme's (WIF, POPCAT) achieve in terms of price gains? 5-8x? Yes, and possibly more.
On-Chain Data in the Short and Long Term:
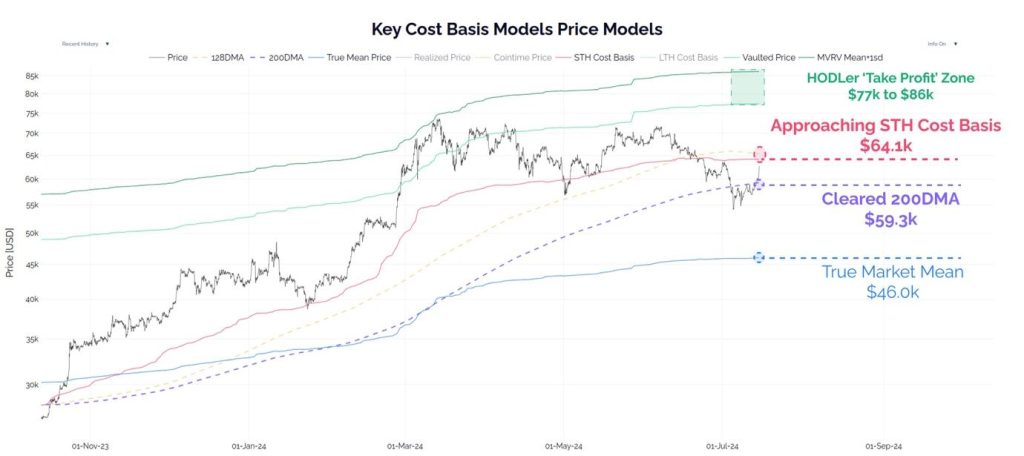
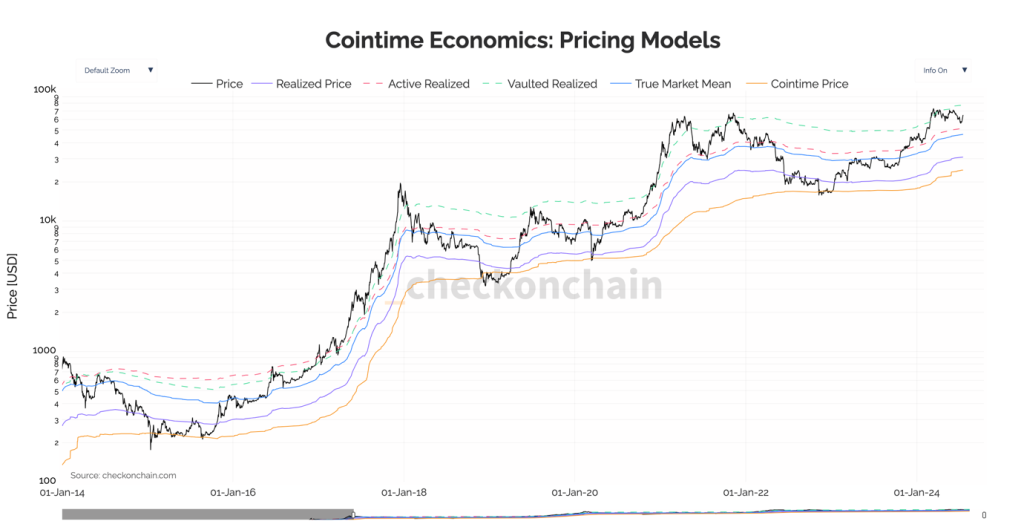
In crypto bull markets, when prices break down, you want to see that the bullish structure of the market hasn't broken. For that, we can look at price and see if it has broken through key levels, and if it has, can these levels be quickly reclaimed? Some of the key levels for Bitcoin's price are:- The Short-Term Holder cost basis ($64,100).
- The 200D moving average ($59,300).
- The Active Realised price ($51,500).
Key Cost Basis Models:
Cointime Economics: Pricing Models
If we then look at this from a more zoomed-out approach, perhaps one of the best metrics we can use is the True Market Mean and AVIV Ratio Indicator. This metric shows us when Bitcoin is over or undervalued and uses standard deviations to show us when price reaches extremes.
True Market Mean and AVIV Ratio Indicator:
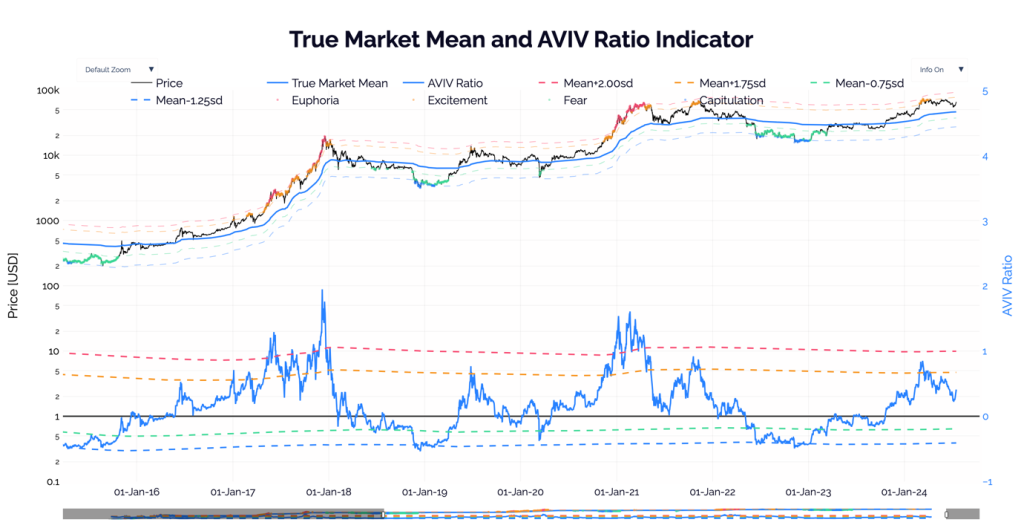
We can see above that Bitcoin is currently set similarly to how it was in the summer of 2019 and the late summer of 2020, suggesting that there is a further and more significant upside in price to be had.
The current 'Euphoria' price level is $92,200. However, in prior cycles, we can see that when price moves into a more parabolic uptrend, it can go substantially beyond that point.
In 2017, when the Bitcoin price broke above the 'Euphoria' price ($1,740), it ran up to $19,200. In 2021, the 'Euphoria' price was $23,570, and it ran up to $64,800. So, if the price breaks above the current 'Euphoria' price of $92,200, the indication is that it can run significantly higher.
However, we do expect this to take more months to play out.
Cryptonary's take
From a zoomed-out perspective, the setup currently looks to be very good:
- Interest rate cuts are coming that should help lower the dollar, which then pushes Bitcoin's price higher.
- The Big Caps Index suggests we're just weeks away from a potential breakout that could increase prices dramatically in the following months.
- The Bitcoin price has recovered key levels that were briefly lost in last week's sell-off. This is pivotal for maintaining momentum in the bull market.
- On-chain' Market Indicator' metrics suggest that the Bitcoin price still has significant room to go higher in the coming months and quarters.
However, in the coming weeks, as we expect to be heading into a more risk-on environment, we will look to add more positions in coins that are more risky but in the right environment (when the market is risk-on) and can see outsized returns.
Overall, we're expecting a positive second half of 2024.
Recommended from Cryptonary


