Save 23% ($351) & Get a Free 1-1 Call with our Team ⏰ : 0d 2h 59m 43s

However, this doesn't mean we're looking to take bundles of action here. In most plays, we're continuing to let them run, even though it's possible that we will see a slight price pullback in the very short term. We also wouldn't be surprised to see prices continue to rip on.
Let's see what we get!
Key questions
- Is Bitcoin's surge past $63k just the beginning? Find out what our Open Interest and Funding Rate analysis reveals about potential short squeezes and price targets.
- ETH smashed through $3,280 with ease - but what's the next major hurdle, and how soon could we see $4,000?
- Solana's 3D chart is telling a compelling story. What key levels and trend lines are we watching, and why does it matter for the coming weeks?
- WIF vs POPCAT: Which meme coin is positioned for the biggest upside? Our comparative analysis might surprise you.
- What's our updated "barbell strategy" for navigating this heated market, and why aren't we rushing to take profits just yet?
Disclaimer: This is not financial or investment advice. You are responsible for any capital-related decisions you make, and only you are accountable for the results. "One Glance" by Cryptonary sometimes uses the RR trading tool to help you quickly understand our analysis. These are not signals, and they are not financial advice.
BTC
- Bitcoin's Open Interest has increased substantially since the assassination attempt on former President Trump on Saturday. This means more leverage has been put on again.
- The Funding Rate, however, is relatively flat, indicating an even balance between Longs and Shorts. Some shorts are piling in around the $64k level for BTC as price has ground higher.
- More leverage piling on and a relatively large amount of Short interest building up in the last 12 hours suggest that if price doesn't have a slight pullback here, then a Short Squeeze could be on the cards, and price could move up again.
Technical analysis
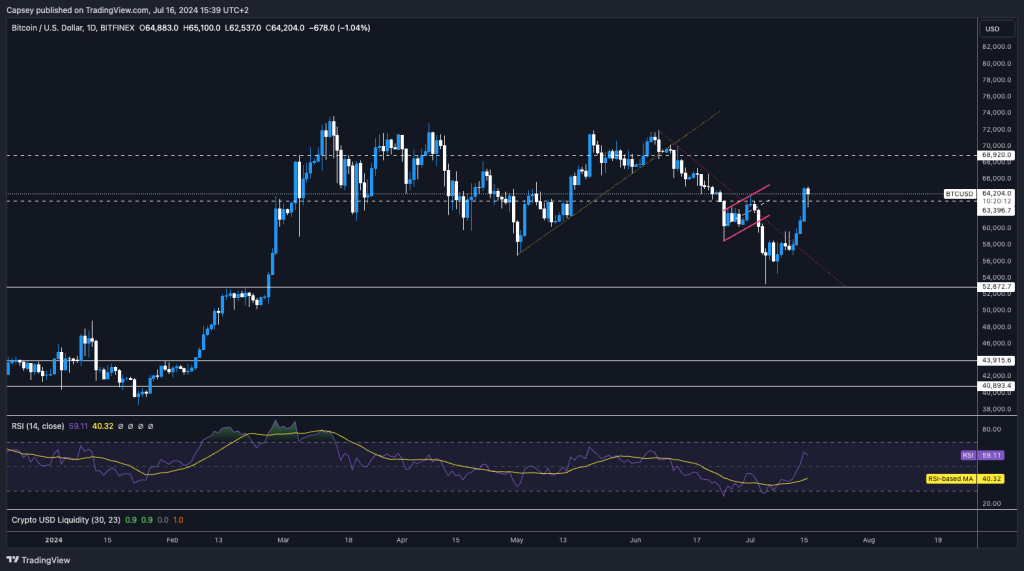
- Bitcoin bounced off the horizontal support at $53k, having formed two bullish divergences in overbought territory.
- Price has now broken out of the downtrend line, smashing through the local resistance at $60k, and moved straight on to retesting the major horizontal resistance at $63,400.
- The $63,400 horizontal resistance is a key level for Bitcoin, and we'd expect a few days of bulls and bears battling it out at this price level.
- Beneath $63,400, there is a local support between $60,400 and $60,800, to be more specific on that local level. We'd expect this level to hold as support if there is a breakdown.
- To the upside, the next major horizontal resistance is at $68,900.
Cryptonary's take
What a ripper of a few days. It was a really good move from Bitcoin, with the German Government's Bitcoin being sold and relatively easily absorbed (bought up) by the market.Overall, it seems that the market is really beginning to turn, and we're seeing this broadening out effect in TradFi markets carry over into crypto—this is positive for prices. While it's possible that Bitcoin will consolidate at the current price, we do see the low $63k as a support area in the short term. If this area is lost in the short term, we expect the $60,400 to $60,800 to act as major support.
We remain very constructive on the market, and we're looking to remain Long and positioned, with the potential for even further risks in the coming weeks. We're not sure we see a new Bitcoin all-time high in the coming week or two, but we are expecting the market to perform well—Bitcoin to probably grind higher—and memes to outperform in this environment.
ETH
- ETH's Open Interest (amount of leverage) has also ramped up in the last few days, up approximately 20%, indicating more leverage has come on here.
- However, like BTC, the funding rate is relatively flat, indicating that there is some short interest here.
- Overall, the leverage side here is somewhat balanced, but if price grinds higher, there could be a small Short squeeze (price up).
Technical analysis
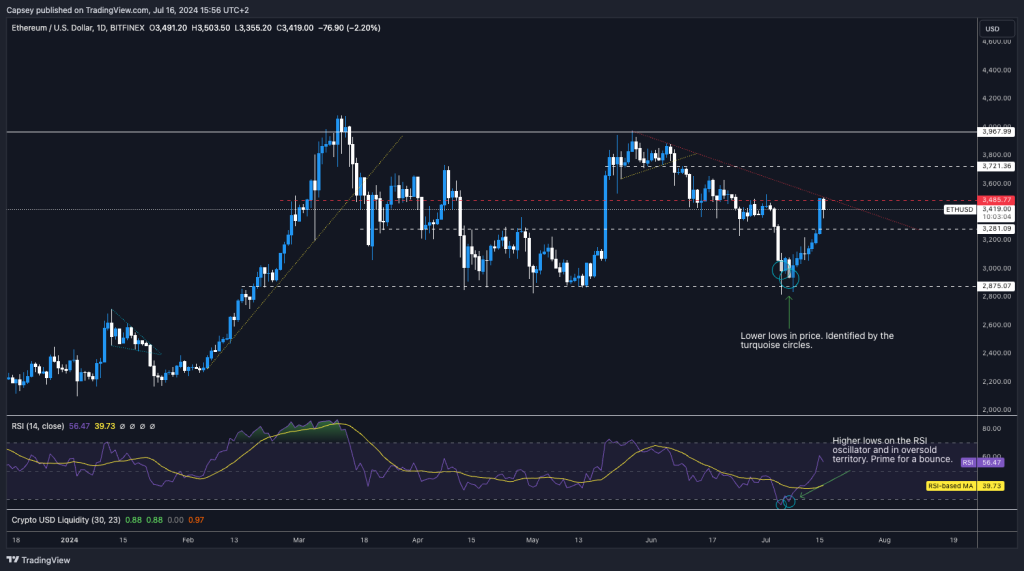
- ETH found support at the horizontal support of $2,875, formed a bullish divergence in oversold territory, and bounced perfectly, as we predicted.
- We expected ETH to bounce up to and retest the horizontal resistance of $3,280 and suggested that it may prove a sticking point. It hasn't. ETH has just smashed through it and moved on higher to the next horizontal resistance at $3,485.
- The $3,485 level is quite a key level for ETH, so it's possible that we see ETH slow down here in the short term, potentially pulling back very slightly before continuing its uptrend.
- ETH is also compressing into the downtrend line. A breakout of this line and the $3,485 horizontal resistance would send ETH to $3,720.
Cryptonary's take
A great move higher from ETH was fuelled by the bullish divergences playing out last week that we called at the time. In the immediate term, ETH may have a slight consolidation, potentially pulling back to the $3,280, although we wouldn't sell here to re-buy a pullback. In the next few weeks, we expect ETH to break out of the downtrend line and push on to $3,700 and then $4,000 again.We remain constructive on ETH. We're still holding our ETH Spot bags and are not looking to sell anytime soon—assuming we don't get any black swan events.
SOL
- The mechanics setup for SOL is very similar to that for BTC and ETH. More leverage has piled on over the last few days, and even though it's relatively evenly balanced, there is some Short interest there that could be squeezed—a potential Short squeeze, assuming price doesn't pull back slightly and Shorts then close out.
Technical analysis
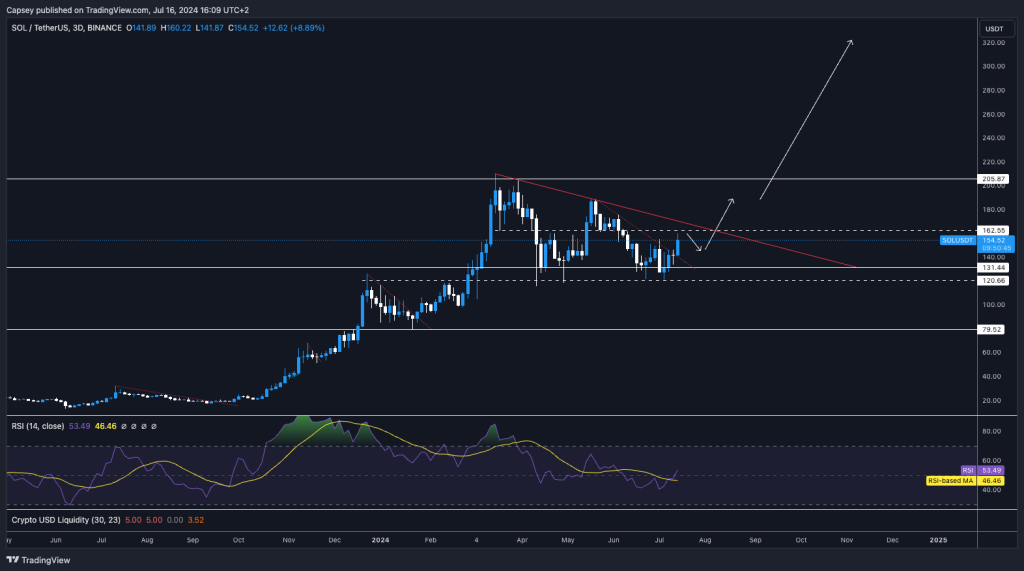
- We're going to look at the SOL chart on the 3D timeframe (much more zoomed out than usual) because we find this chart and timeframe more telling at this current moment in time.
- SOL has bounced perfectly from the horizontal support zone of $120 to $131.
- SOL broke out of the local downtrend line, and price bounced with the market to the horizontal resistance of $162.
- The downtrend line is just beyond the $162 horizontal resistance. A breakout of the downtrend line is likely when we see SOL full send higher.
- $187 would be the next horizontal resistance, and then $205. Beyond these? The all-time high of $255.
- If there are more retests to the downside, we expect the $120 to $131 zone to be the major support zone, and we don't expect price to break below these levels.
Cryptonary's take
We remain very constructive on SOL and expect a more significant upside once the downtrend line is broken out. We continue to hold Spot bags and remain patient with SOL overall. Anything sub $130 or even close retests, we'd be buyers of for the long term (next 6-12 months).WIF
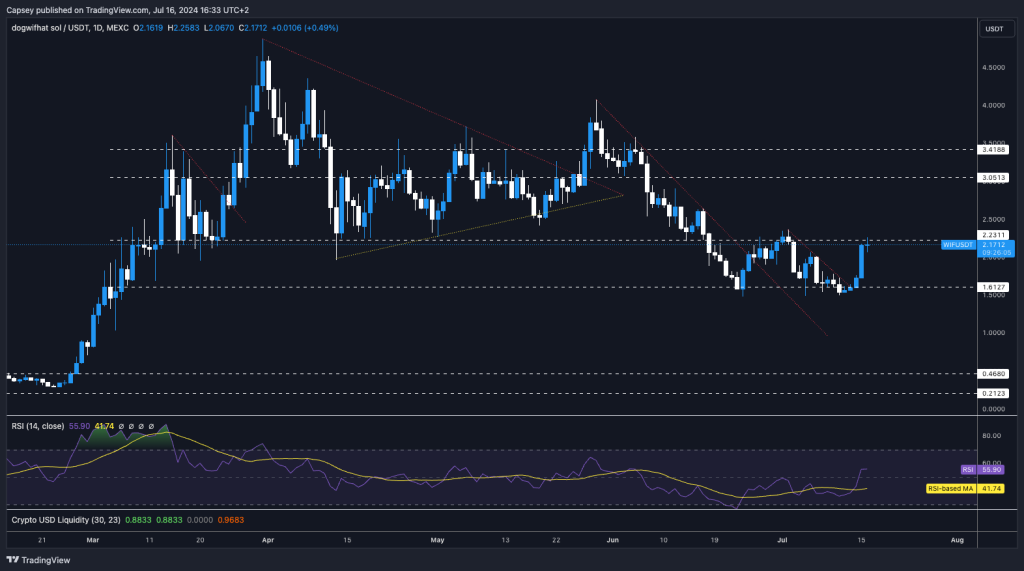
- WIF has managed to form support at the $1.60 level and put in a bounce from there, which has then retested the prior support and is now facing new resistance at $2.20.
- $2.20 is a key horizontal level for WIF to get back above. If price can get back above it, then we would expect a full risking-on in the memes sector.
- If WIF can surpass $2.20 and then flip that level into new support, this would then allow price to increase with the next horizontal resistance at a significantly higher price point of $3.05.
- WIF has pumped 35% in two days, so it is possible we see a slight consolidation in the very short term. Beyond that, we do expect a further risking on (move up in price) to take place.
Cryptonary's take
Our opinions haven't changed for WIF; we still believe this is one of the more major plays for this cycle, and when you consider how POPCAT has moved recently (a slight catchup trade that seems to now be doing it's catching up), WIF looks somewhat attractively valued in comparison - even though we think POPCAT goes much higher in the medium and long-term.For those with less/no exposure to WIF, we suggest increasing exposure and taking advantage of any meaningful move down. A move to $2.00, and we'd suggest you should consider DCA'ing, although the time was in the $ 1.50 and $1.6o range where we added to our bags; we were also prepared to add to WIF bags if it fell below $1.50. It's about building a position over time at attractive price points in the long term. To us, that was between $1.30 and $1.70.
POPCAT
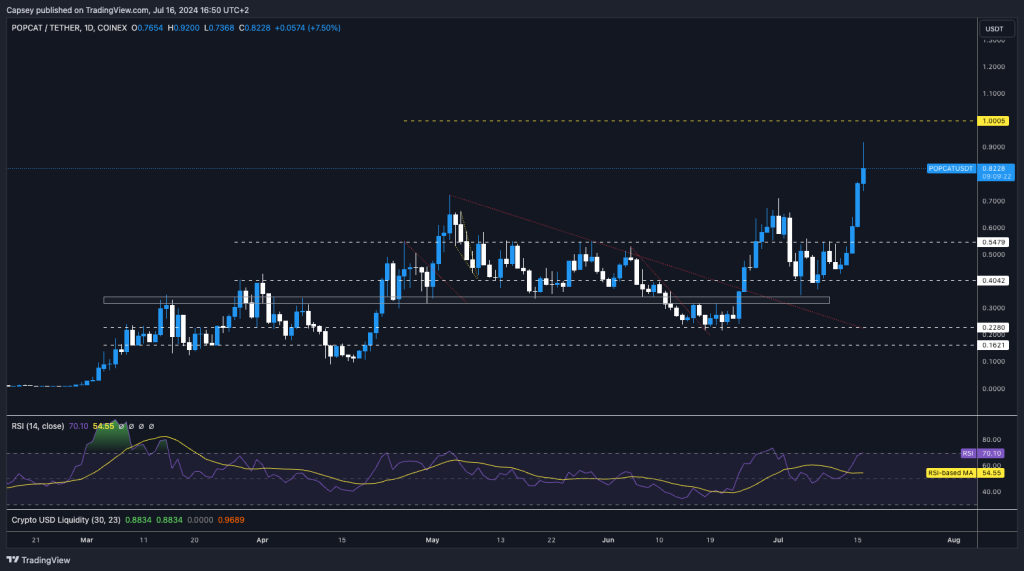
- POPCAT had just had a brilliant move. Overall, the price action has looked eerily similar to WIF and what WIF did a number of months ago.
- Following a breakout of the $0.55 horizontal resistance, price was able to also break past all-time highs, now sending POPCAT into price discovery.
- We note that the RSI is approaching overbought territory, and it would indicate a bearish divergence if price closed at a higher high. However, we have seen this many times with WIF, and price just kept ripping higher.
- $0.90 is a fib level for profit taking. However, we would be surprised to see this level be a significant resistance over the medium term.
- If price were to pull back, you would want to see support hold at the $0.65 level.
Cryptonary's take
We think the narrative is very strong here, and we wouldn't be surprised to see price continue to rip higher here if Bitcoin also makes another push higher.We do note there is the possibility of a pullback with the price having moved up so significantly in the last three days. But because we remain so constructive long-term, we're looking to continue holding Spot bags of POPCAT, with our price targets significantly north of $1—closer to $3-$5.
Anything in the short term is just noise. We're patient in letting price action play out, and we expect, in the coming 3-6 months, for the price to be substantially higher than it is currently.
We're not looking to take any action here other than continuing to hold Spot bags.
Recommended from Cryptonary


