Save 23% ($351) & Get a Free 1-1 Call with our Team ⏰ : 0d 2h 59m 44s
As the crypto market stands at a pivotal juncture, this week promises to be a rollercoaster of economic data and market sentiment. With the US markets reopening after Labour Day, we're diving into the indicators that could shape the near-term future for crypto.
Every piece of data this week is a potential catalyst. But here's the kicker: market sentiment is at rock bottom despite a positive macro outlook.
Are we witnessing the calm before the storm?
In this report, we'll unpack:
- The week's most critical economic data points and their potential impact
- Why rock-bottom sentiment might actually be a bullish indicator
- Historical patterns vs. current market dynamics
- On-chain metrics suggest we're midway through a bull market
Disclaimer: This is not financial or investment advice. You are responsible for any capital-related decisions you make, and only you are accountable for the results.
This week's pivotal data
The US market is closed today due to Labour Day. However, the market reopens tomorrow, and we have a jam-packed week with important macro data.- Tuesday: ISM Manufacturing is expected to rise slightly above last month but still in contractionary territory.
- Wednesday: JOLT's Job Openings data is expected to come in slightly lower than last month at 8.09m; however, this is still a strong figure.
- Thursday: ISM Services data is expected to be slightly lower than last month's but still in expansionary territory.
- Thursday: Initial Jobless Claims data is expected to come in slightly lower at 227k.
- Friday: Non-Farm Payrolls data is expected to come in at 100k, which is on the low end. The market likely wouldn't react well to anything below 100k.
- Friday: The Unemployment Rate is expected to remain the same as last month. The market would likely react positively if it came in at 4.3%.
Market sentiment
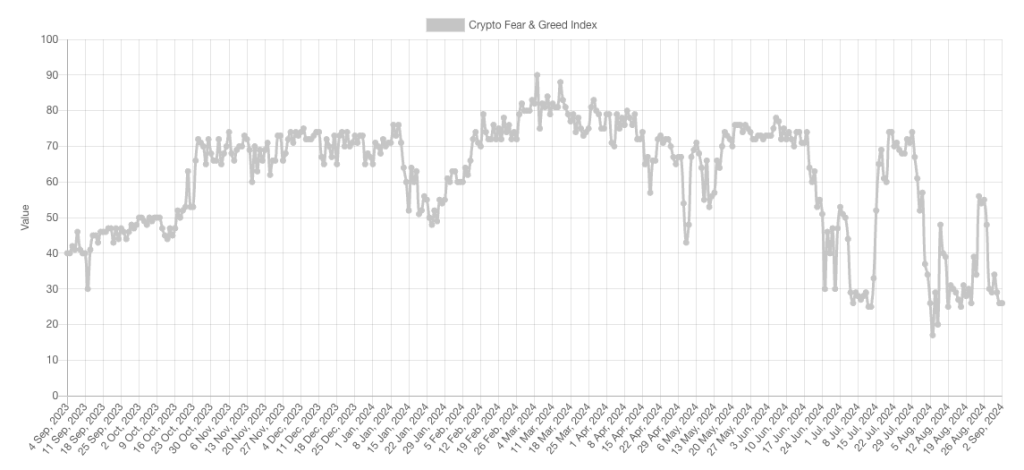
The current market sentiment is really poor; I (Tom) even noticed it in myself, despite the outlook remaining positive, particularly from the macro perspective, as we explained in our last Market Update. But price isn't really responding right now. However, a resetting in sentiment is positive for the space, and flushing out weaker hands is key for prices to go higher in the medium term.Firstly, if we look at the Fear & Greed Index, we can see it's very close to its yearly lows, having spent most of the last few months close to them. Be greedy when others are fearful.
Fear & Greed Index:
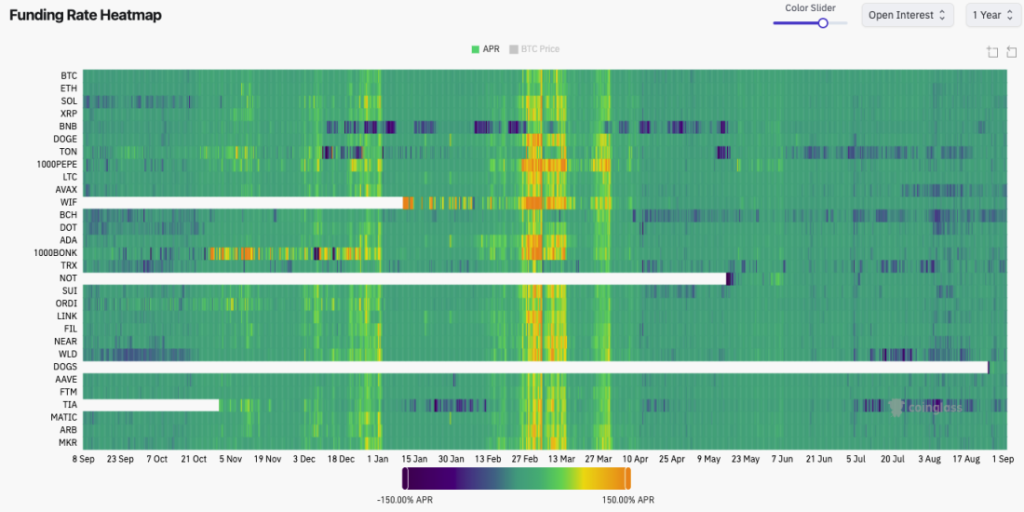
If we look at the Funding Rate Heatmap, we can see that it's now (far right-hand side) an intense green and even dark blue in some areas. This indicates that the Funding Rates are close to 0.00% or even negative, meaning traders are paying a premium to be Short.
If we look back to the February/March 2024 period, we can see that the colours are yellow/red, indicating traders were Longing and paying a significant premium to be Long. This was an unhealthy market. We've now seen a full resetting in this, with a flushing out of the froth needed for a bull market to continue.
Funding Rate Heatmap:
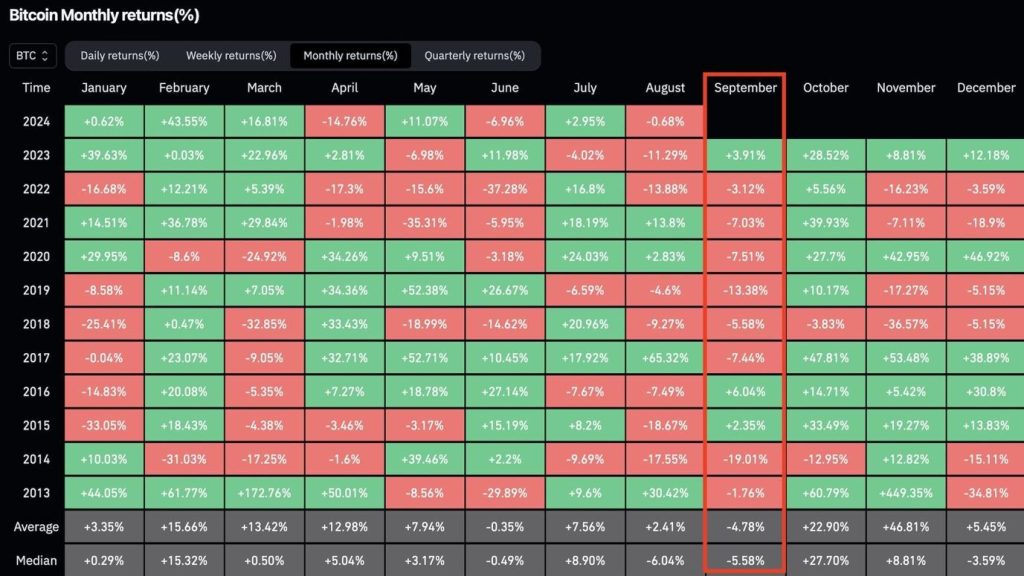
Recently, we've seen many tweets showing Bitcoin's monthly price performance in September. Historically, BTC doesn't perform well in September. However, this is now becoming a consensus opinion and too well-known. Despite the market feeling weak, sentiment is on the floor, which somewhat makes us feel more bullish on the other side.
September BTC Price Performance:
Cryptonary's take
The market is challenging to call here in the short term, and for that reason alone, we prefer to be in the concentrated barbell portfolio (BTC, ETH, SOL, WIF and POPCAT). In the short term, we expect price to struggle to see meaningful upside momentum simply because the sentiment is so bad.However, suppose the data this week is positive/supportive, and then Friday's Jobs data comes in with a strong Non-Farms print and Unemployment at 4.2% or 4.3%. In that case, this can be a catalyst for the market to move up more substantially again—keeping the soft landing narrative intact. We believe that this week, and likely the next few weeks' price action, will be determined by this Friday's data.
Ultimately, we still struggle to accept the bear case as we move into a rate-cutting cycle (normalisation cuts rather than panic cuts) and five months after a BTC Halving. However, it's possible we still have a couple more quiet weeks, possibly even a month or two.
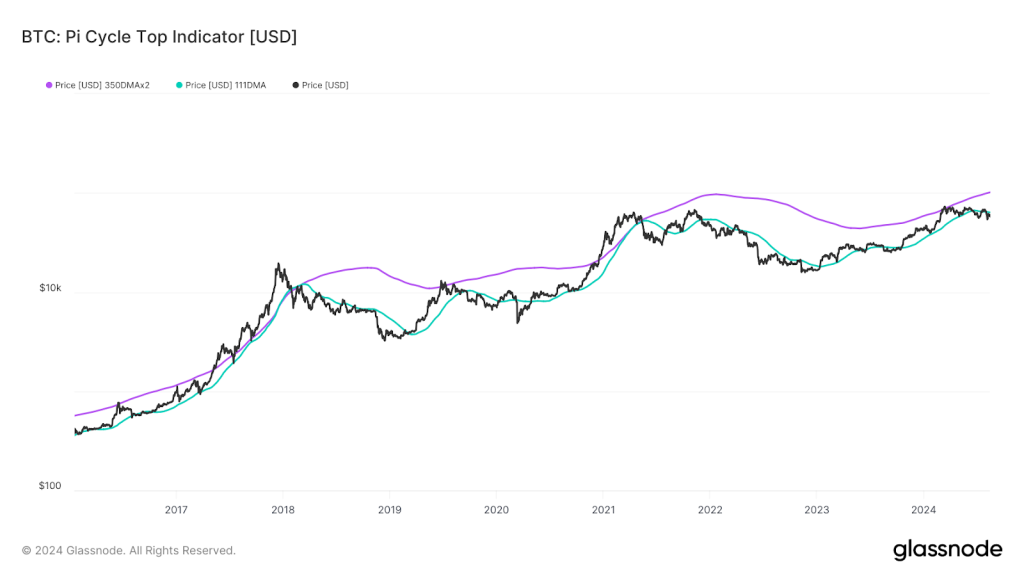
Alongside the above, when we look at key 'Market Indicator' on-chain metrics, many of these suggest that Bitcoin is still midway through the bull market. The first of these is the Pi Cycle Top Indicator. This metric currently has a striking resemblance to 2019, but of course, we're not expecting a COVID-19-like crash.
We believe that once BTC crosses back above the 111D MA (turquoise line - currently at $63,900), it can swiftly head to the 350D MAx2 (purple line, currently at $101,500).
Pi Cycle Top Indicator:
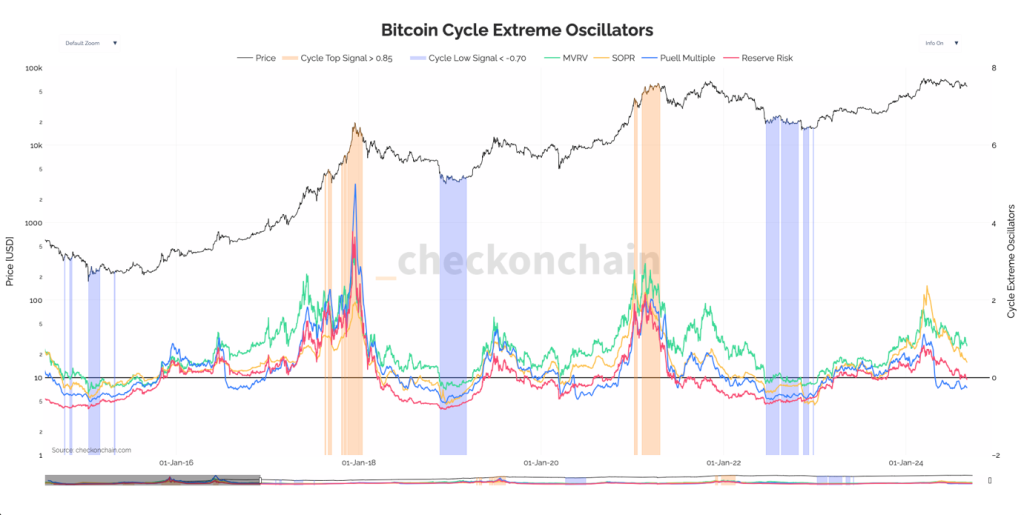
Lastly, the Bitcoin Cycle Extreme Oscillators suggest that Bitcoin has yet to reach a cycle peak, and other 'Market Indicator' metrics suggest the same.
Bitcoin Cycle Extreme Oscillator:
Recommended from Cryptonary


