Save 23% ($351) & Get a Free 1-1 Call with our Team ⏰ : 0d 2h 59m 44s
Crypto market on edge | Jan 30th
With the upcoming FOMC meeting on the 1st of February, we’re waiting to see whether the outcome has an impact on the market. As the Total Market Cap has reached resistance, a negative FOMC could be the perfect match to light a retrace in the crypto market.
Of course, the opposite could also happen, and we could see the market react well and continue to the upside. We highly suggest reading this report, where we present to you our predictions for the meeting, and a lot more!
Disclaimer: Not financial or investment advice. You are responsible for any capital-related decisions you make, and only you are accountable for the results.
TLDR
- The Total Market Cap is at resistance. Wednesday’s FOMC meeting will decide where the crypto market goes next.
- ASTR has broken out from its 7-month-old accumulation area.
- DYDX is at a decision-making point. Keep reading to find out what needs to happen for us to pick a direction.
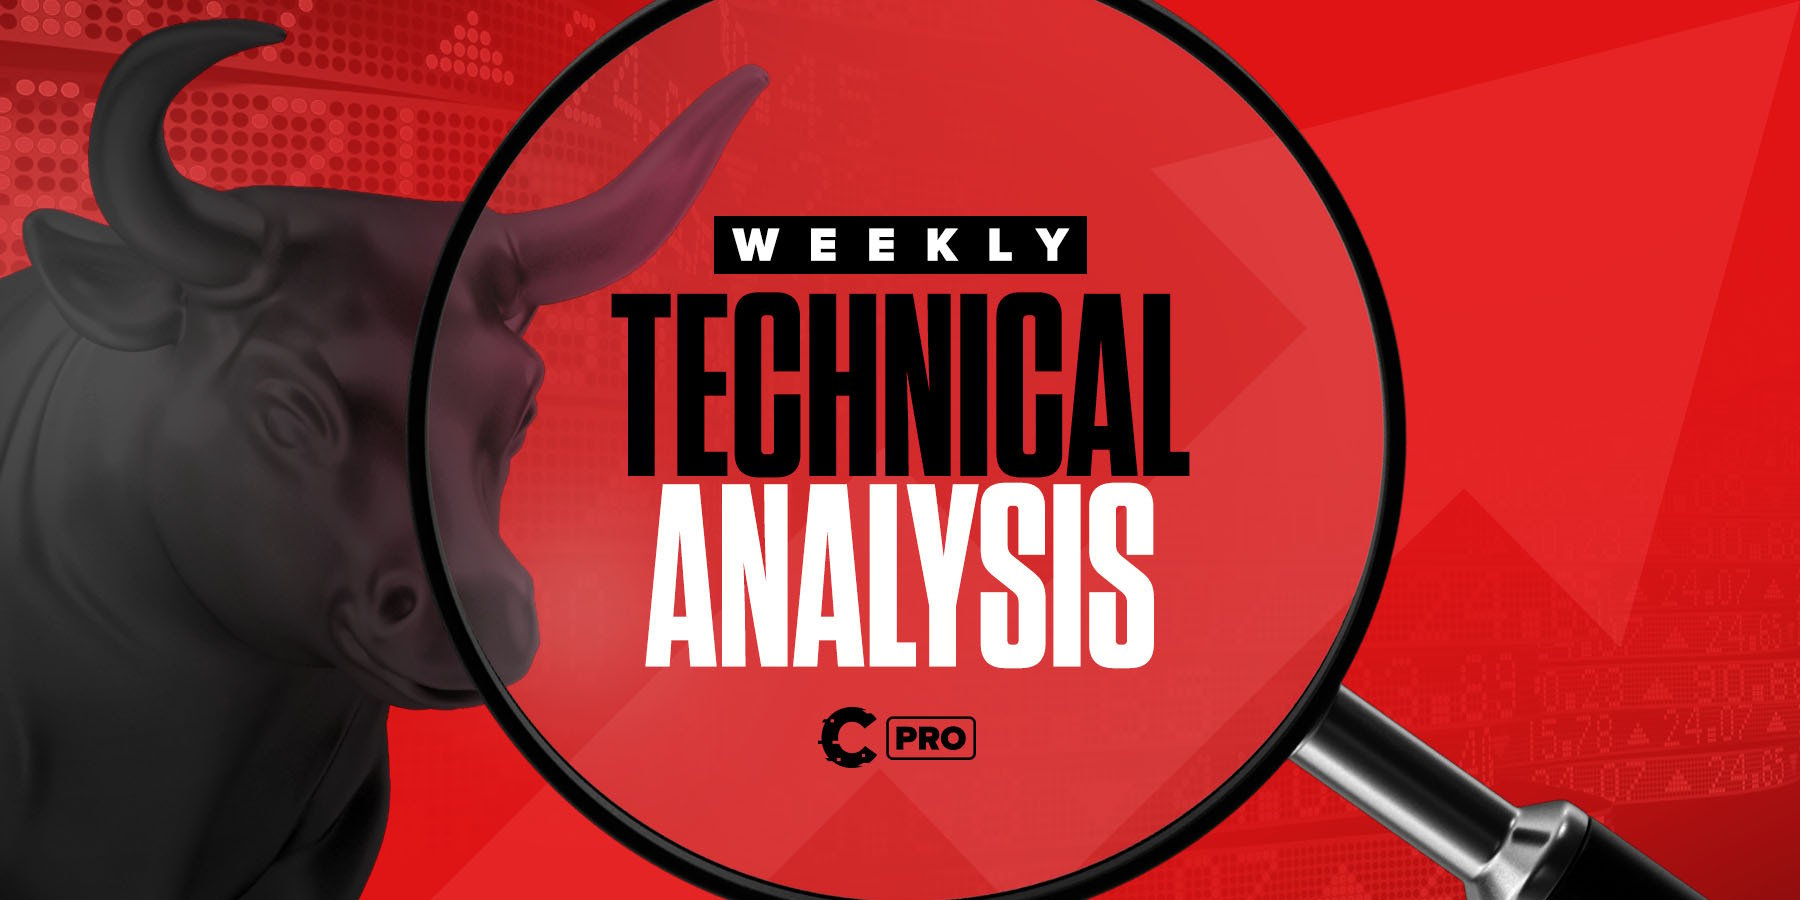
Total Market Cap
The Total Market Cap index represents the entire valuation of the cryptocurrency market. We track this index to understand where the market is now and to predict where it will likely go next.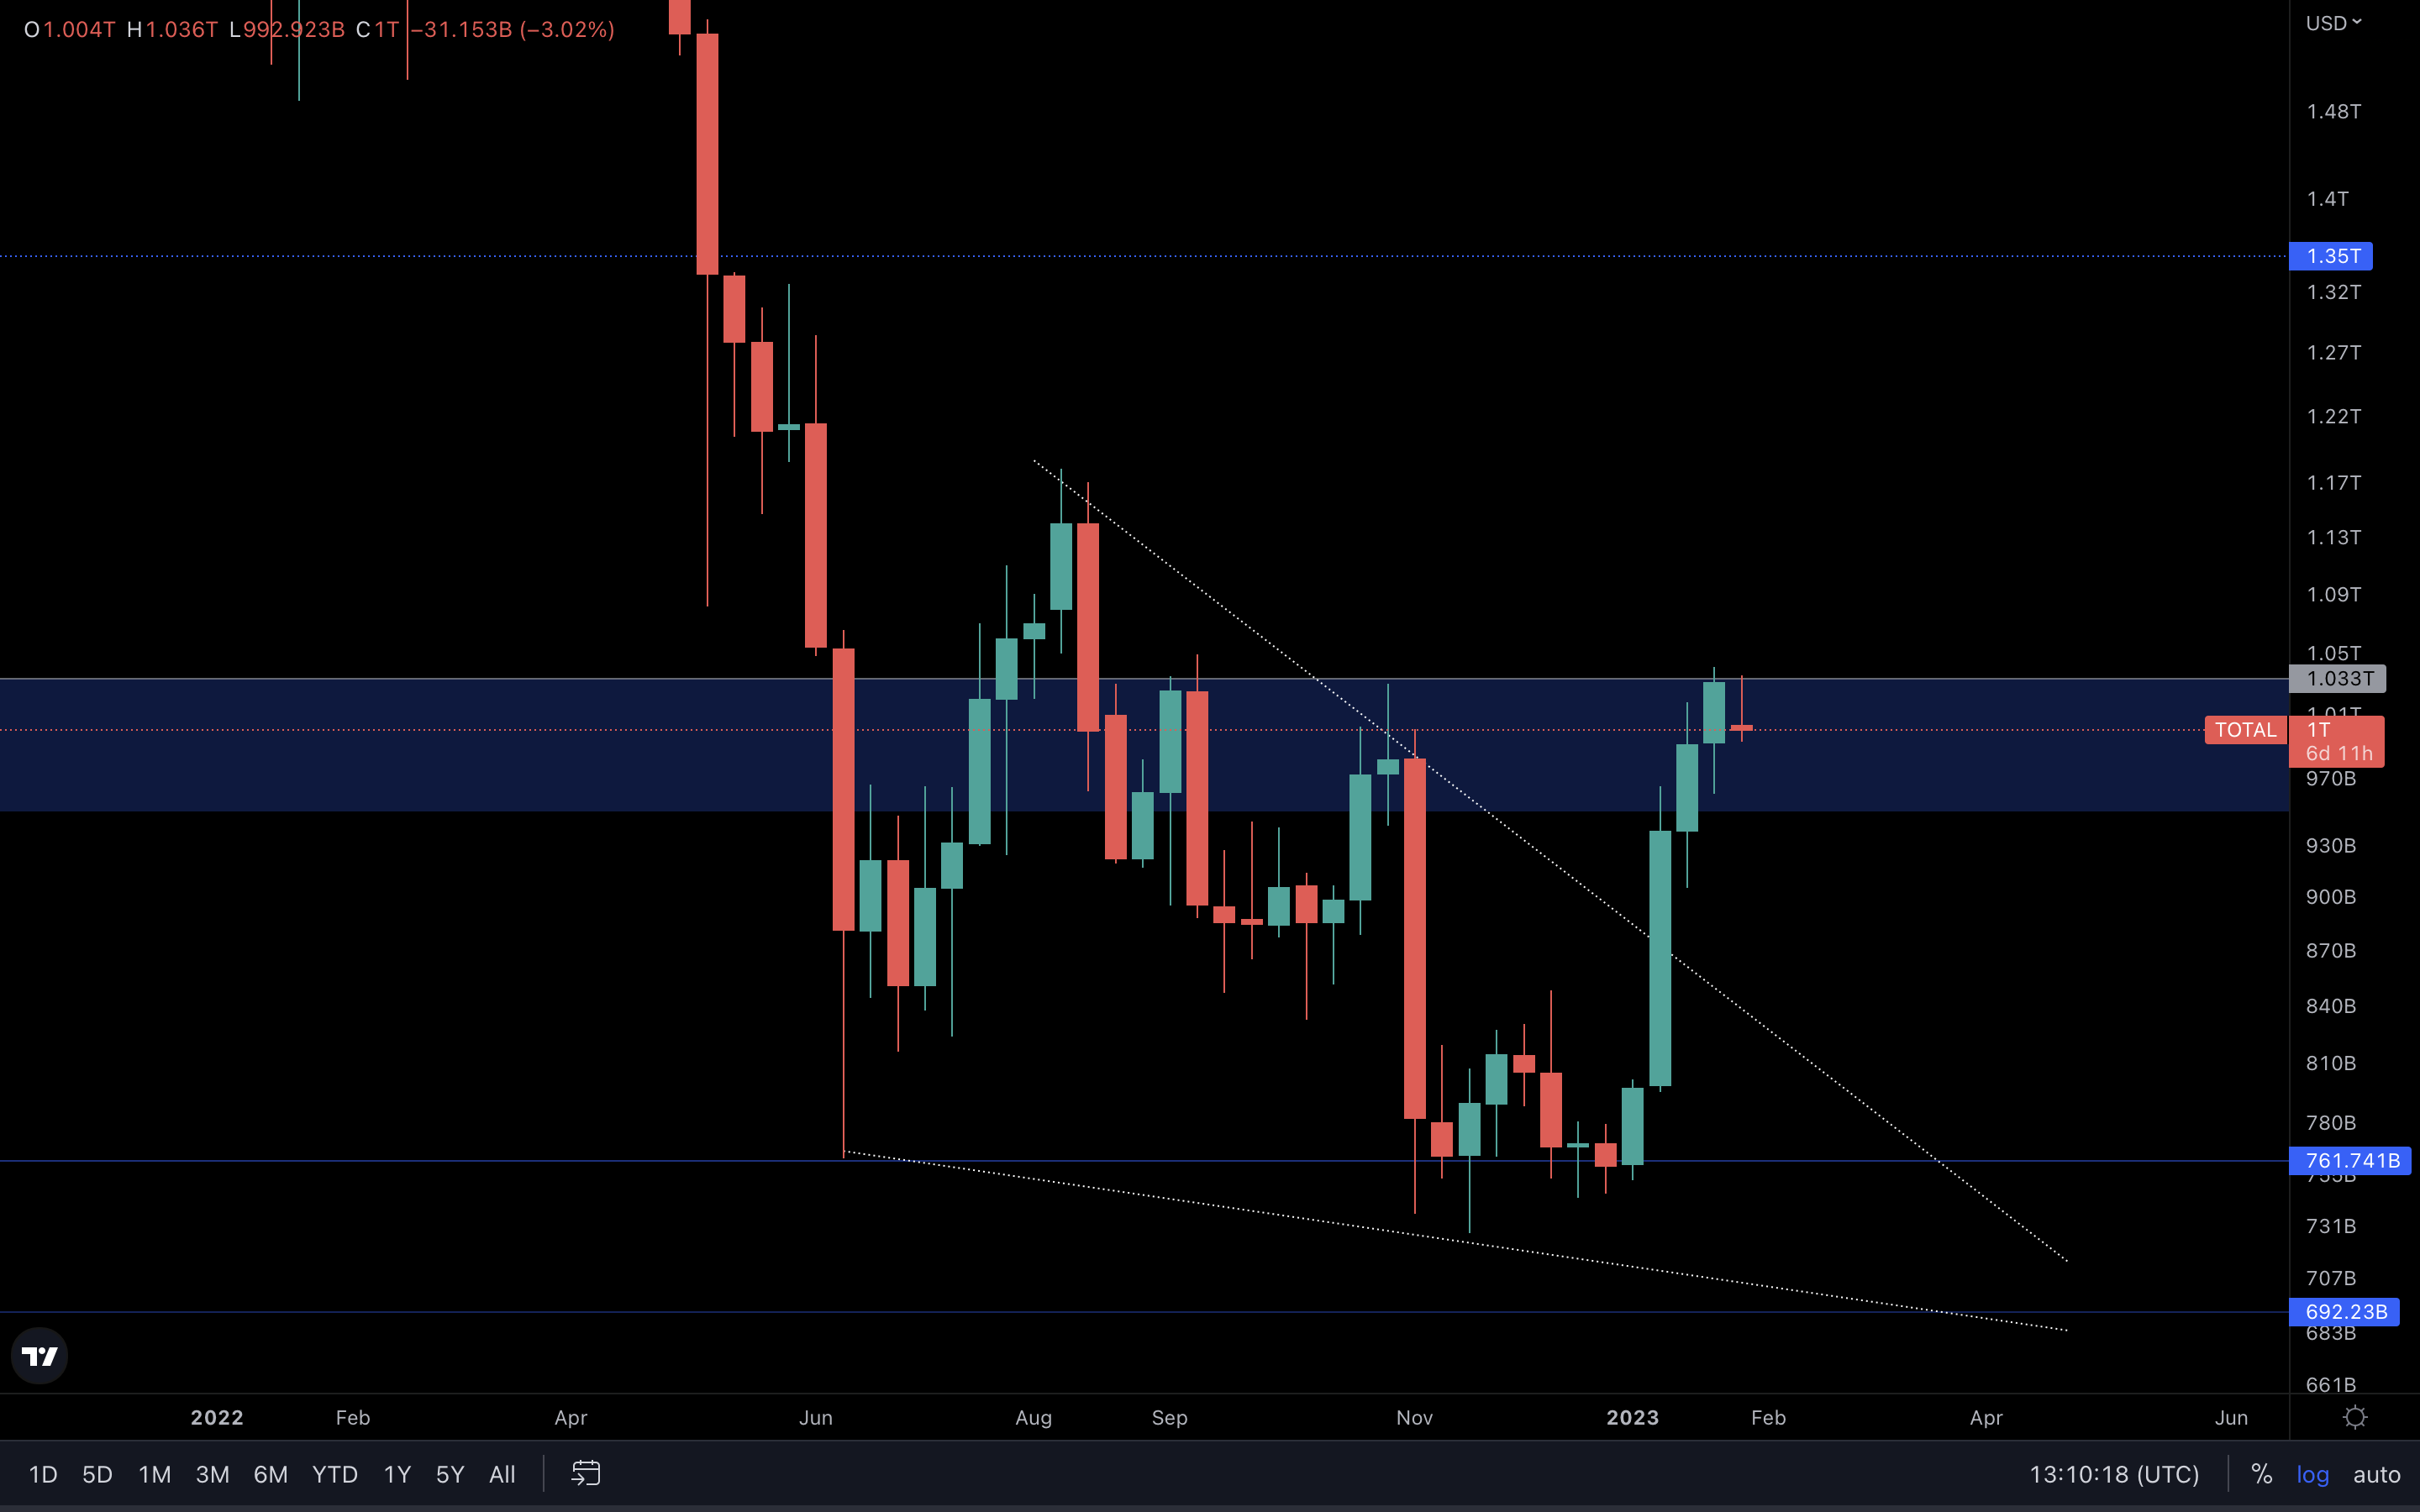
The Total Market Cap has now reached the $1.03T resistance level. There are concerns about whether the index will break above resistance. Here’s our take:
The market is up by over 30% in January. Bear market or not, such movements require slowing down from time to time – nothing can go up forever. With the index at a major resistance level (psychological and technical level of $1T), and the possibility of a negative impact caused by the upcomings FOMC meeting, we could be looking at a pullback next. Until we see a weekly closure above $1.03T, this scenario has high odds of occurring. In the meantime, taking a step back might be the best play to avoid losses or preserve profits in the short term.
Altcoins Market Cap
The Altcoins Market Cap index represents the entire evaluation of the altcoins market (all coins other than BTC).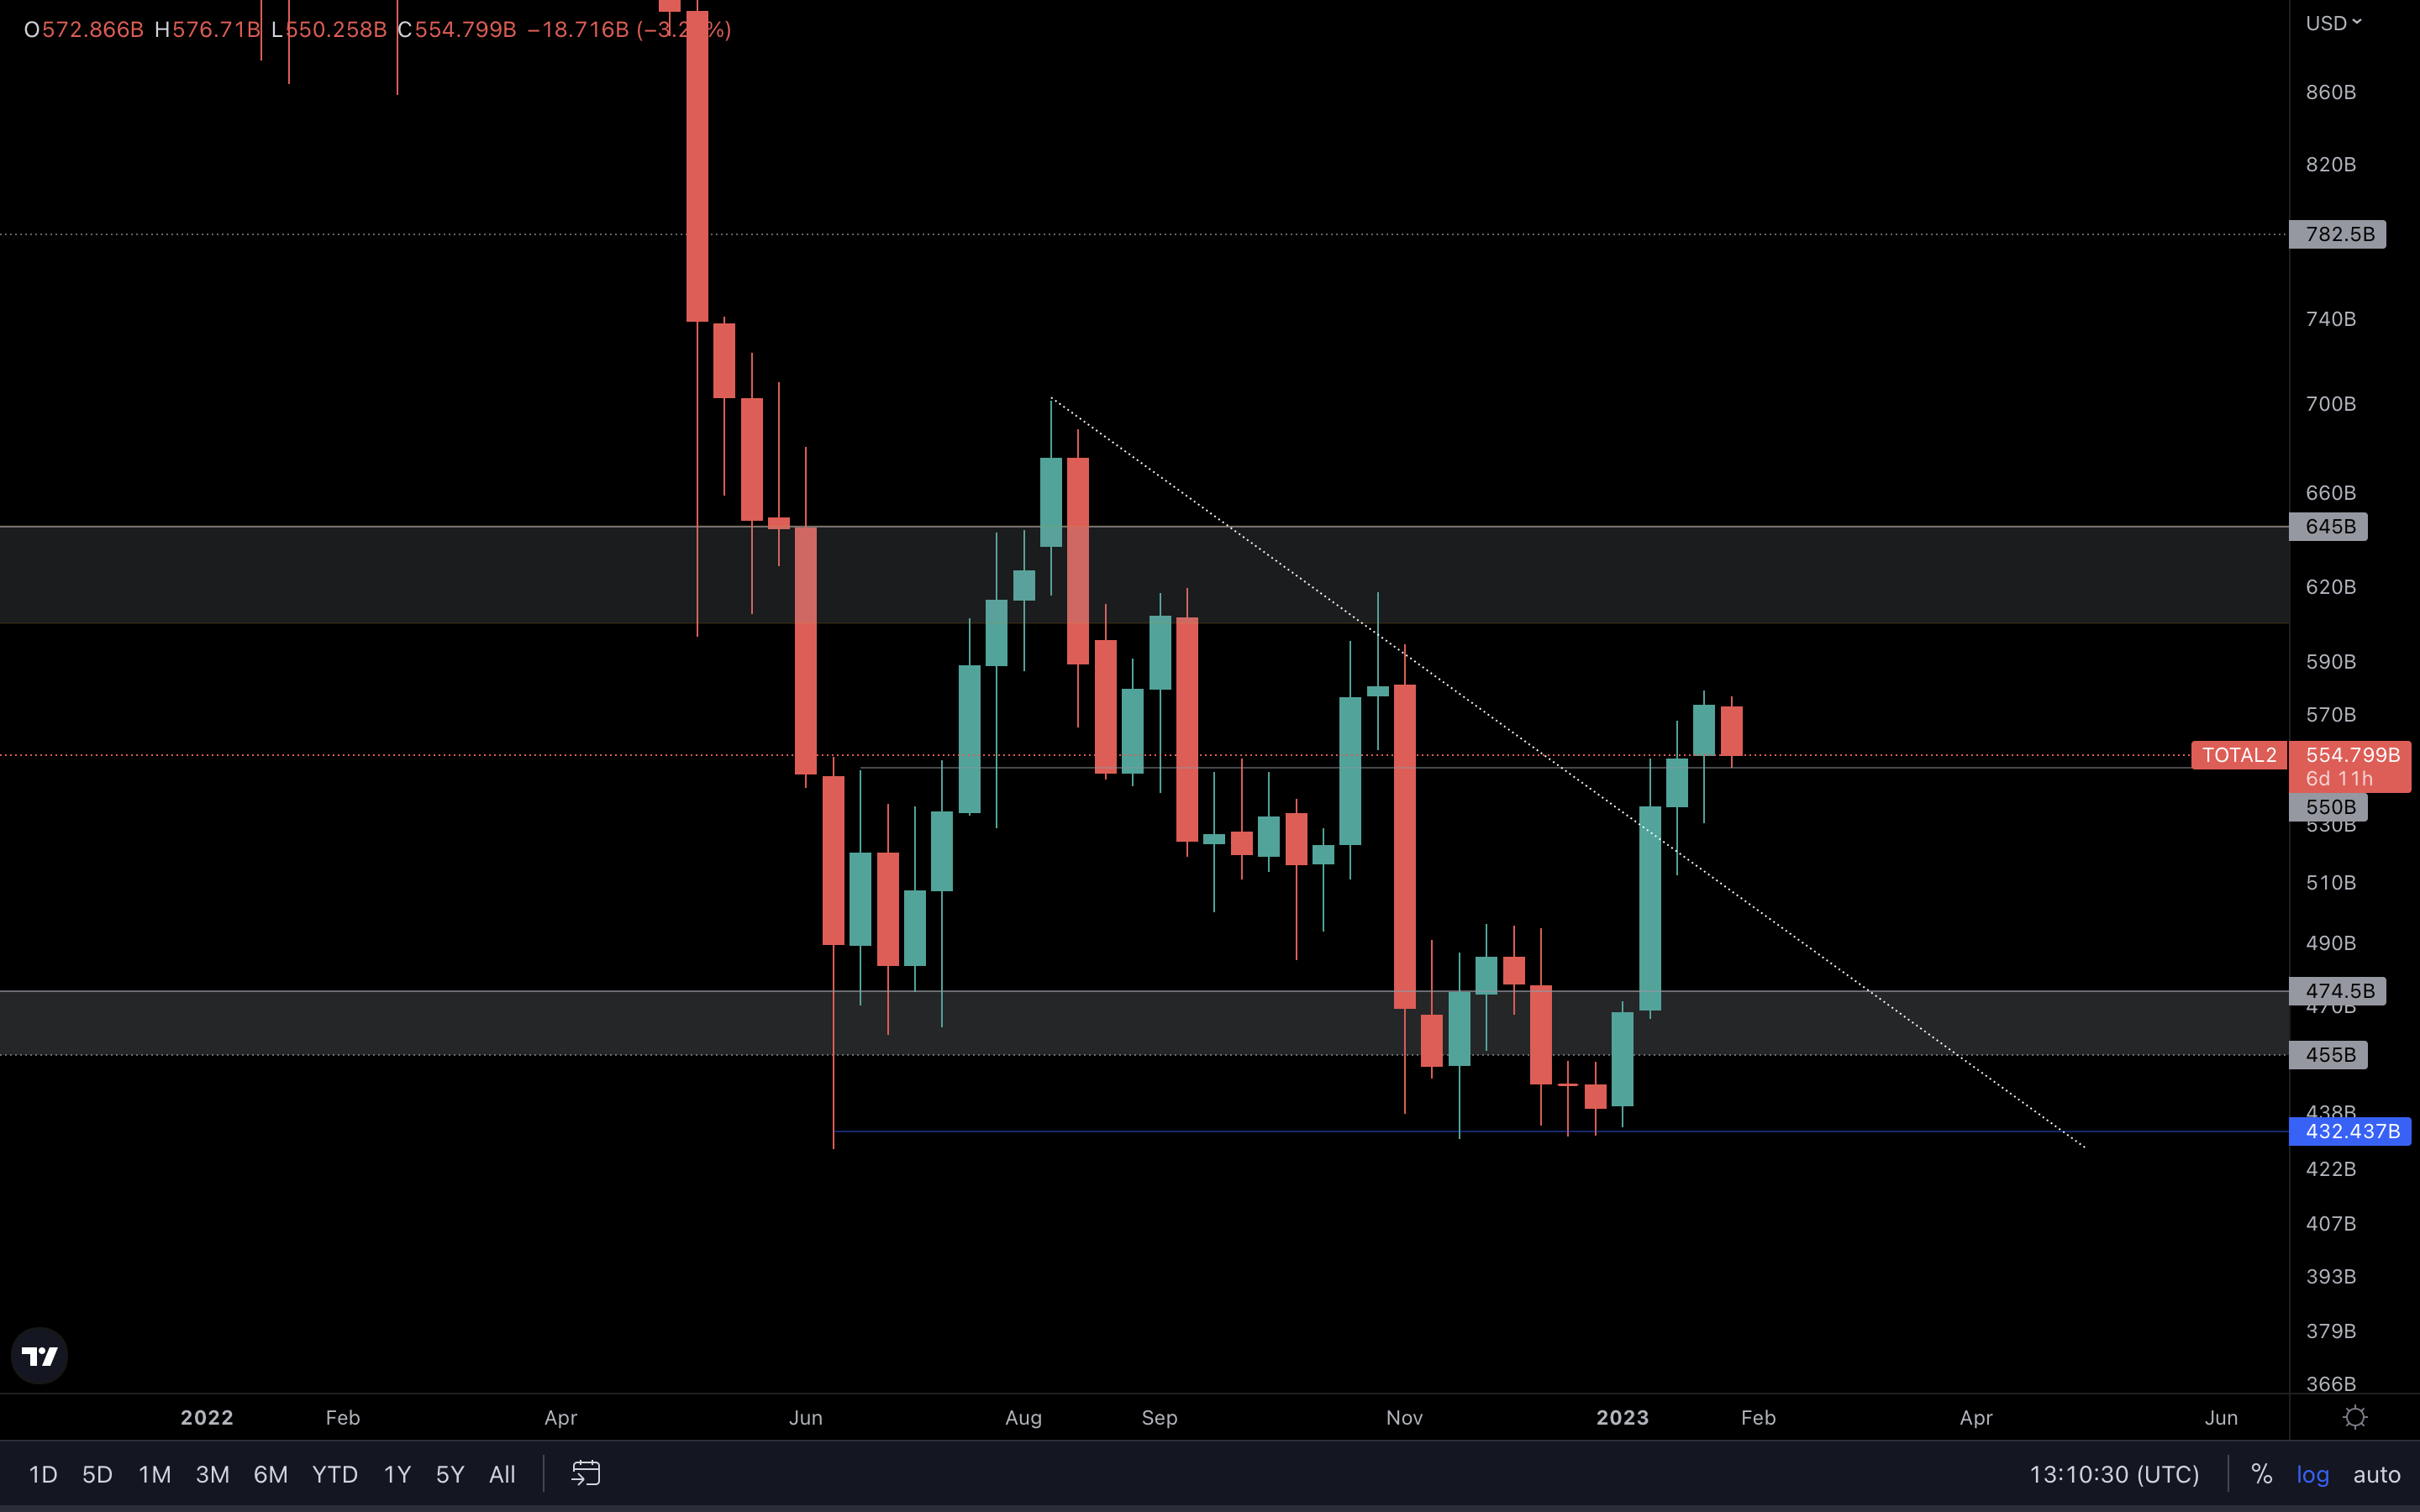
We’ve seen a clear reclaim of $550B with last week’s candle, which actually suggests more upside is on the cards. However, the two major indexes are sitting at different sides of the table. The Total Market Cap is currently testing resistance, whilst the Altcoins Market Cap is testing support. In such situations, it’s best to look only at the Total Market Cap index, as it includes Bitcoin, which holds over 40% of the entire market’s share. Where the first index goes after the FOMC meeting is where the altcoins market will follow. A rejection from $1.03T on the Total Market Cap will lead to a loss of $550B on the Altcoins Market Cap index.
BTC | Bitcoin
ETH | Ethereum
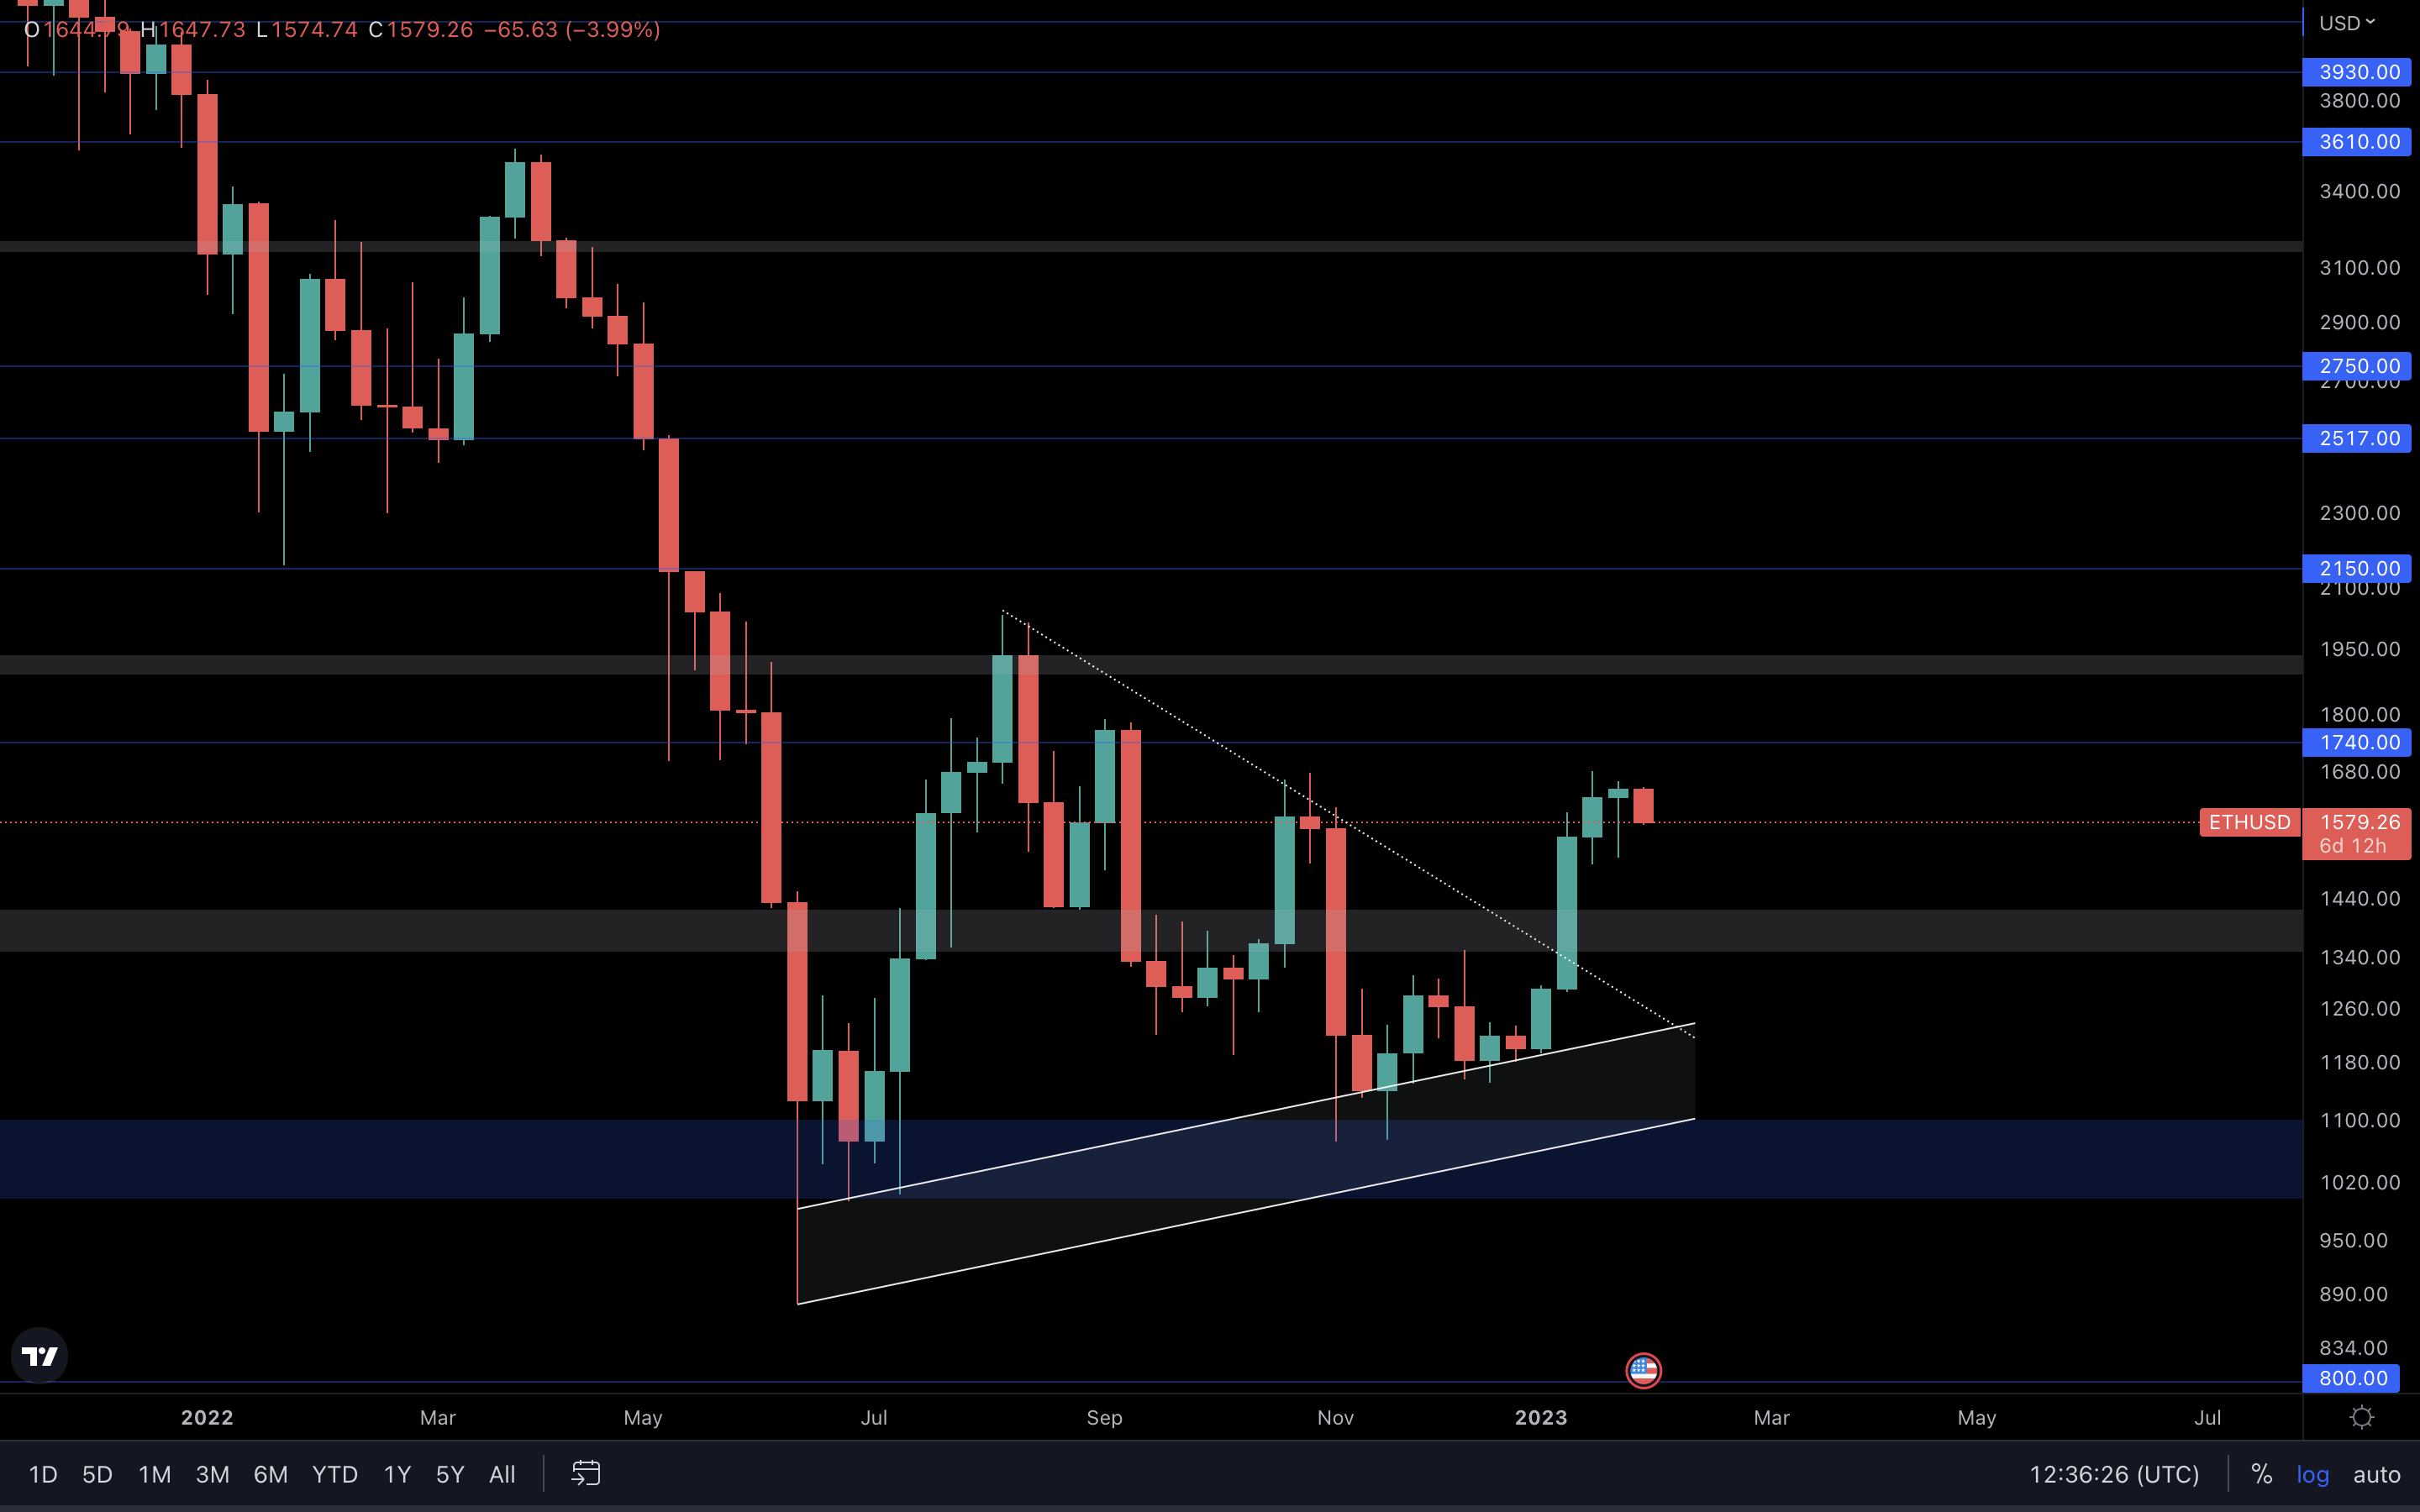
There was some selling pressure last week, but buyers still managed to invalidate it and close the week in the green. This suggests we can continue to go up here, specifically to the next line of resistance at $1740. However, this scenario may be invalidated if the market doesn’t react well after the FOMC meeting, or if the market simply doesn’t react well in general. A rejection on the Total Market Cap index will also force Ether to go down, even if its price action says otherwise. It’s best to wait for the outcome of Wednesday’s meeting.
SOL | Solana
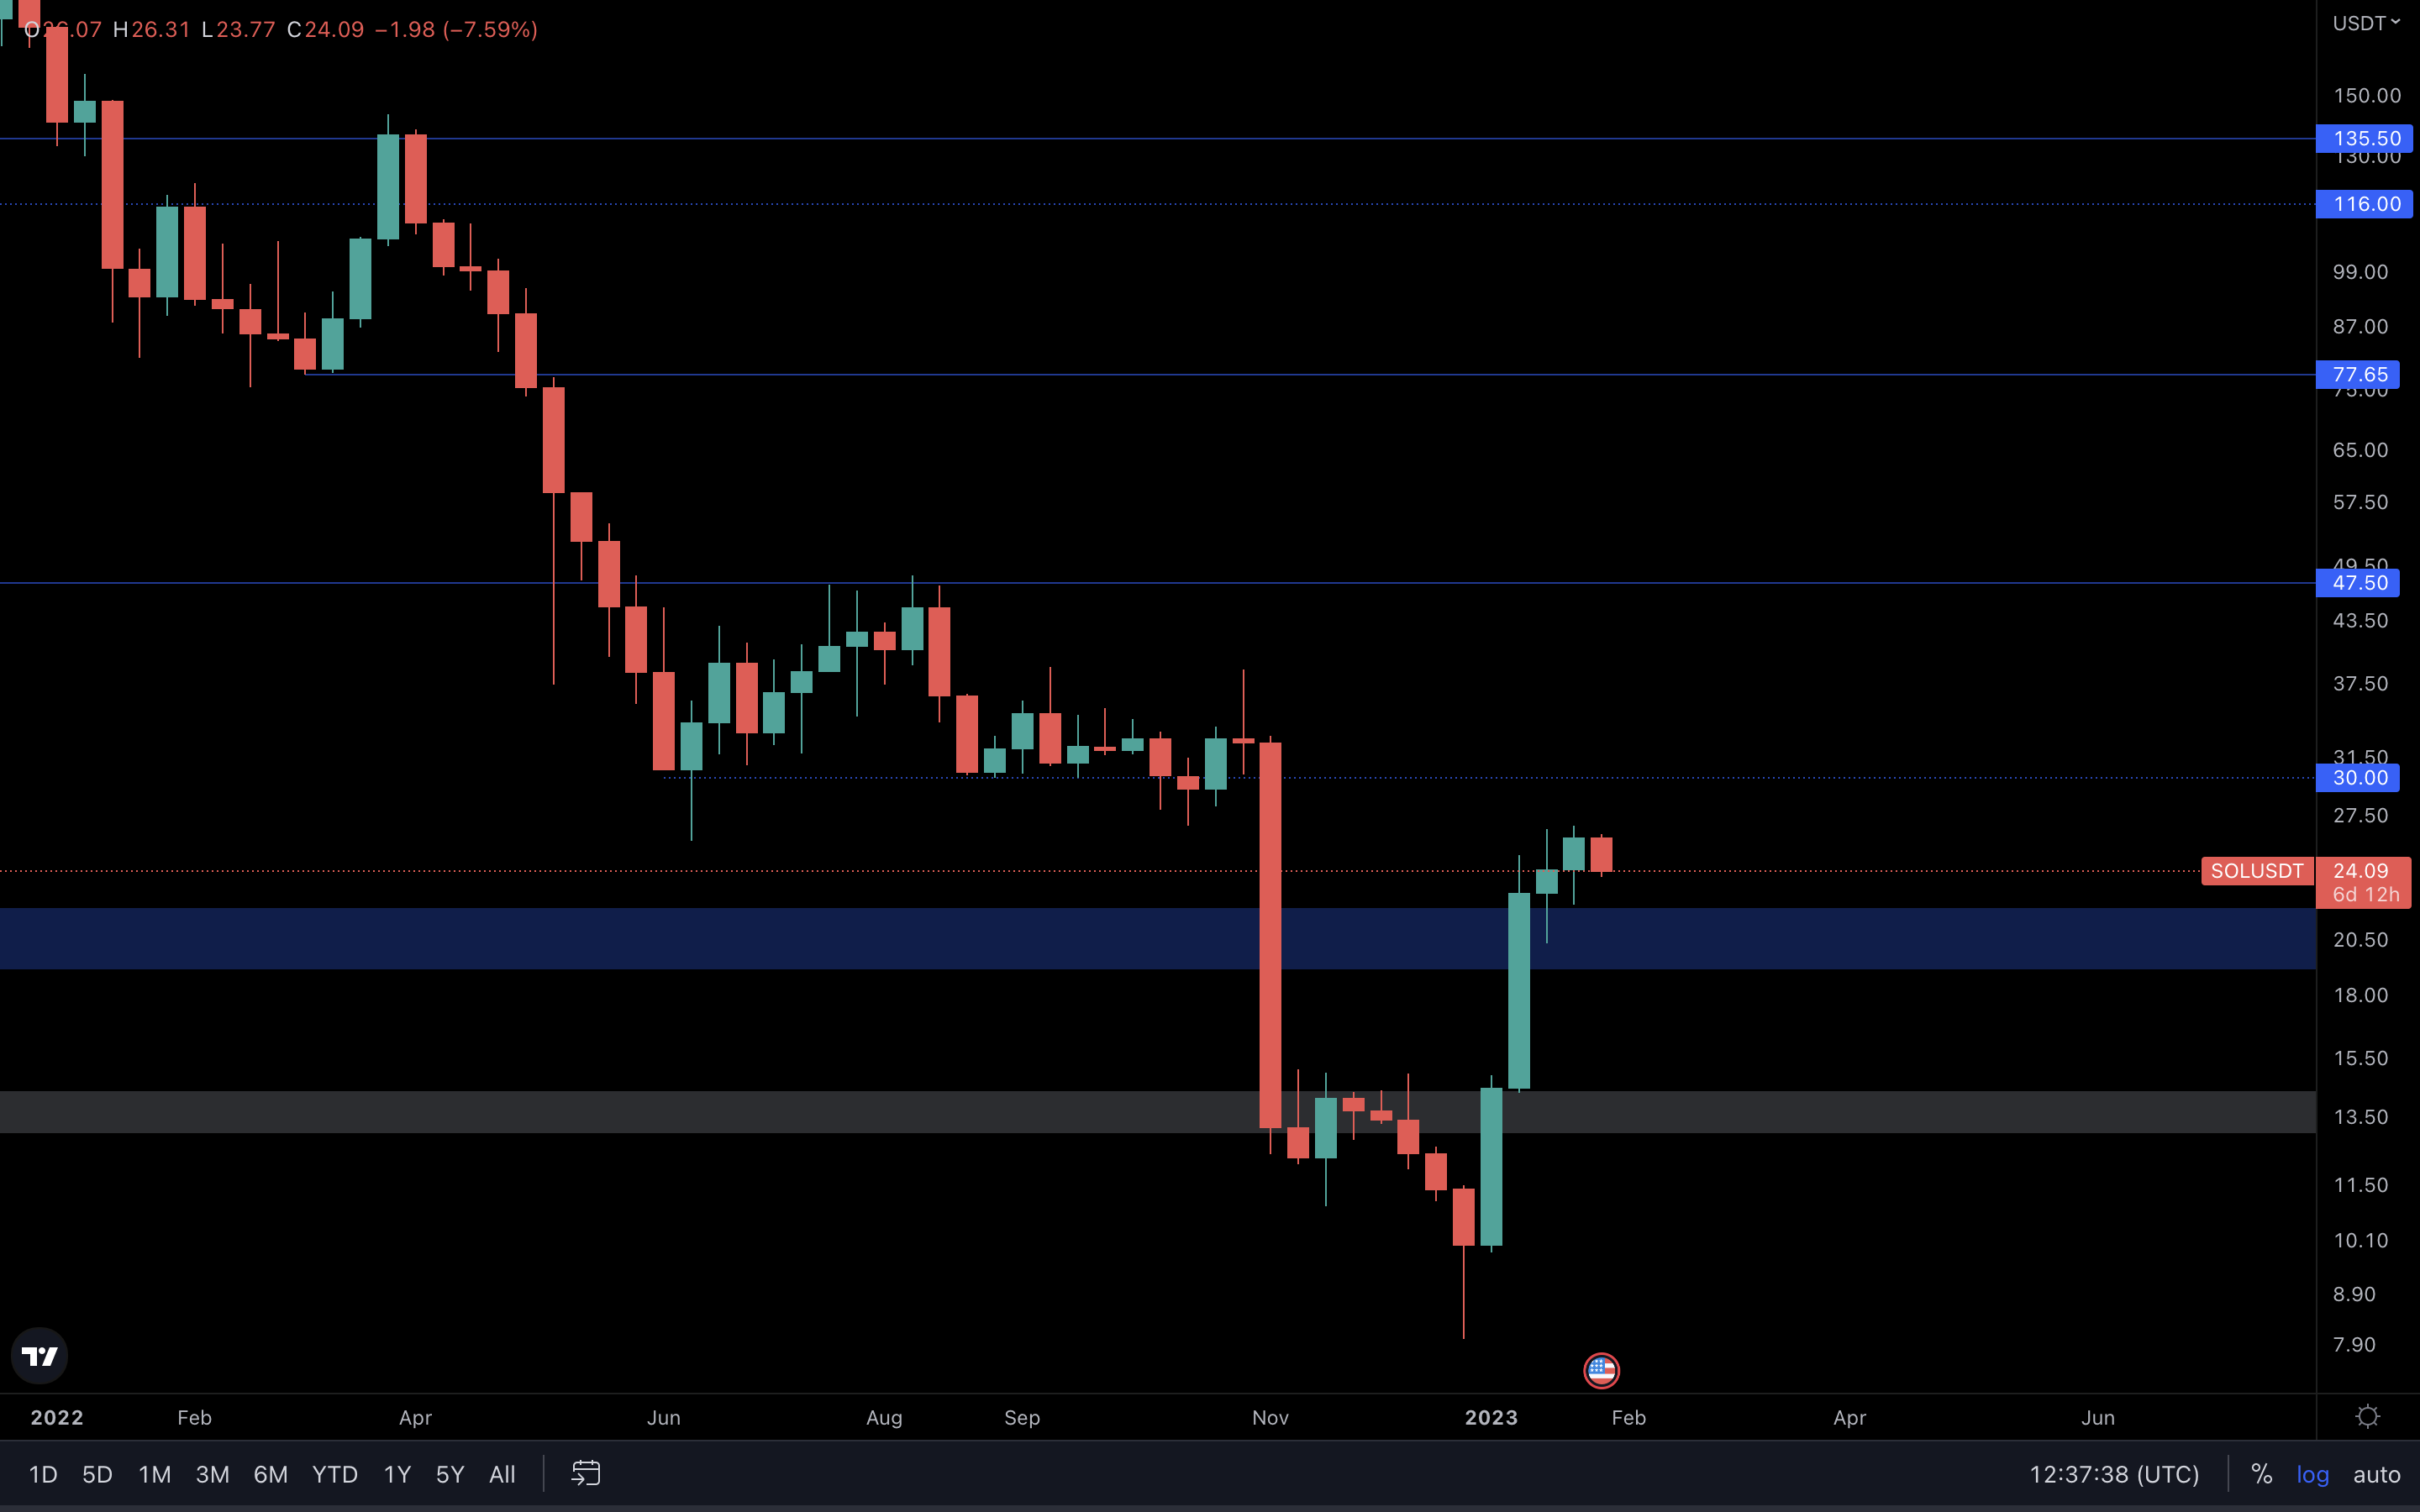
Solana’s chart will continue to scream $30 until the bottom of the blue box ($19) is lost. We could even see SOL come back down to retest the box, but unless we see a weekly closure under $19, we’re still on for $30 at some point.
RUNE | THORChain
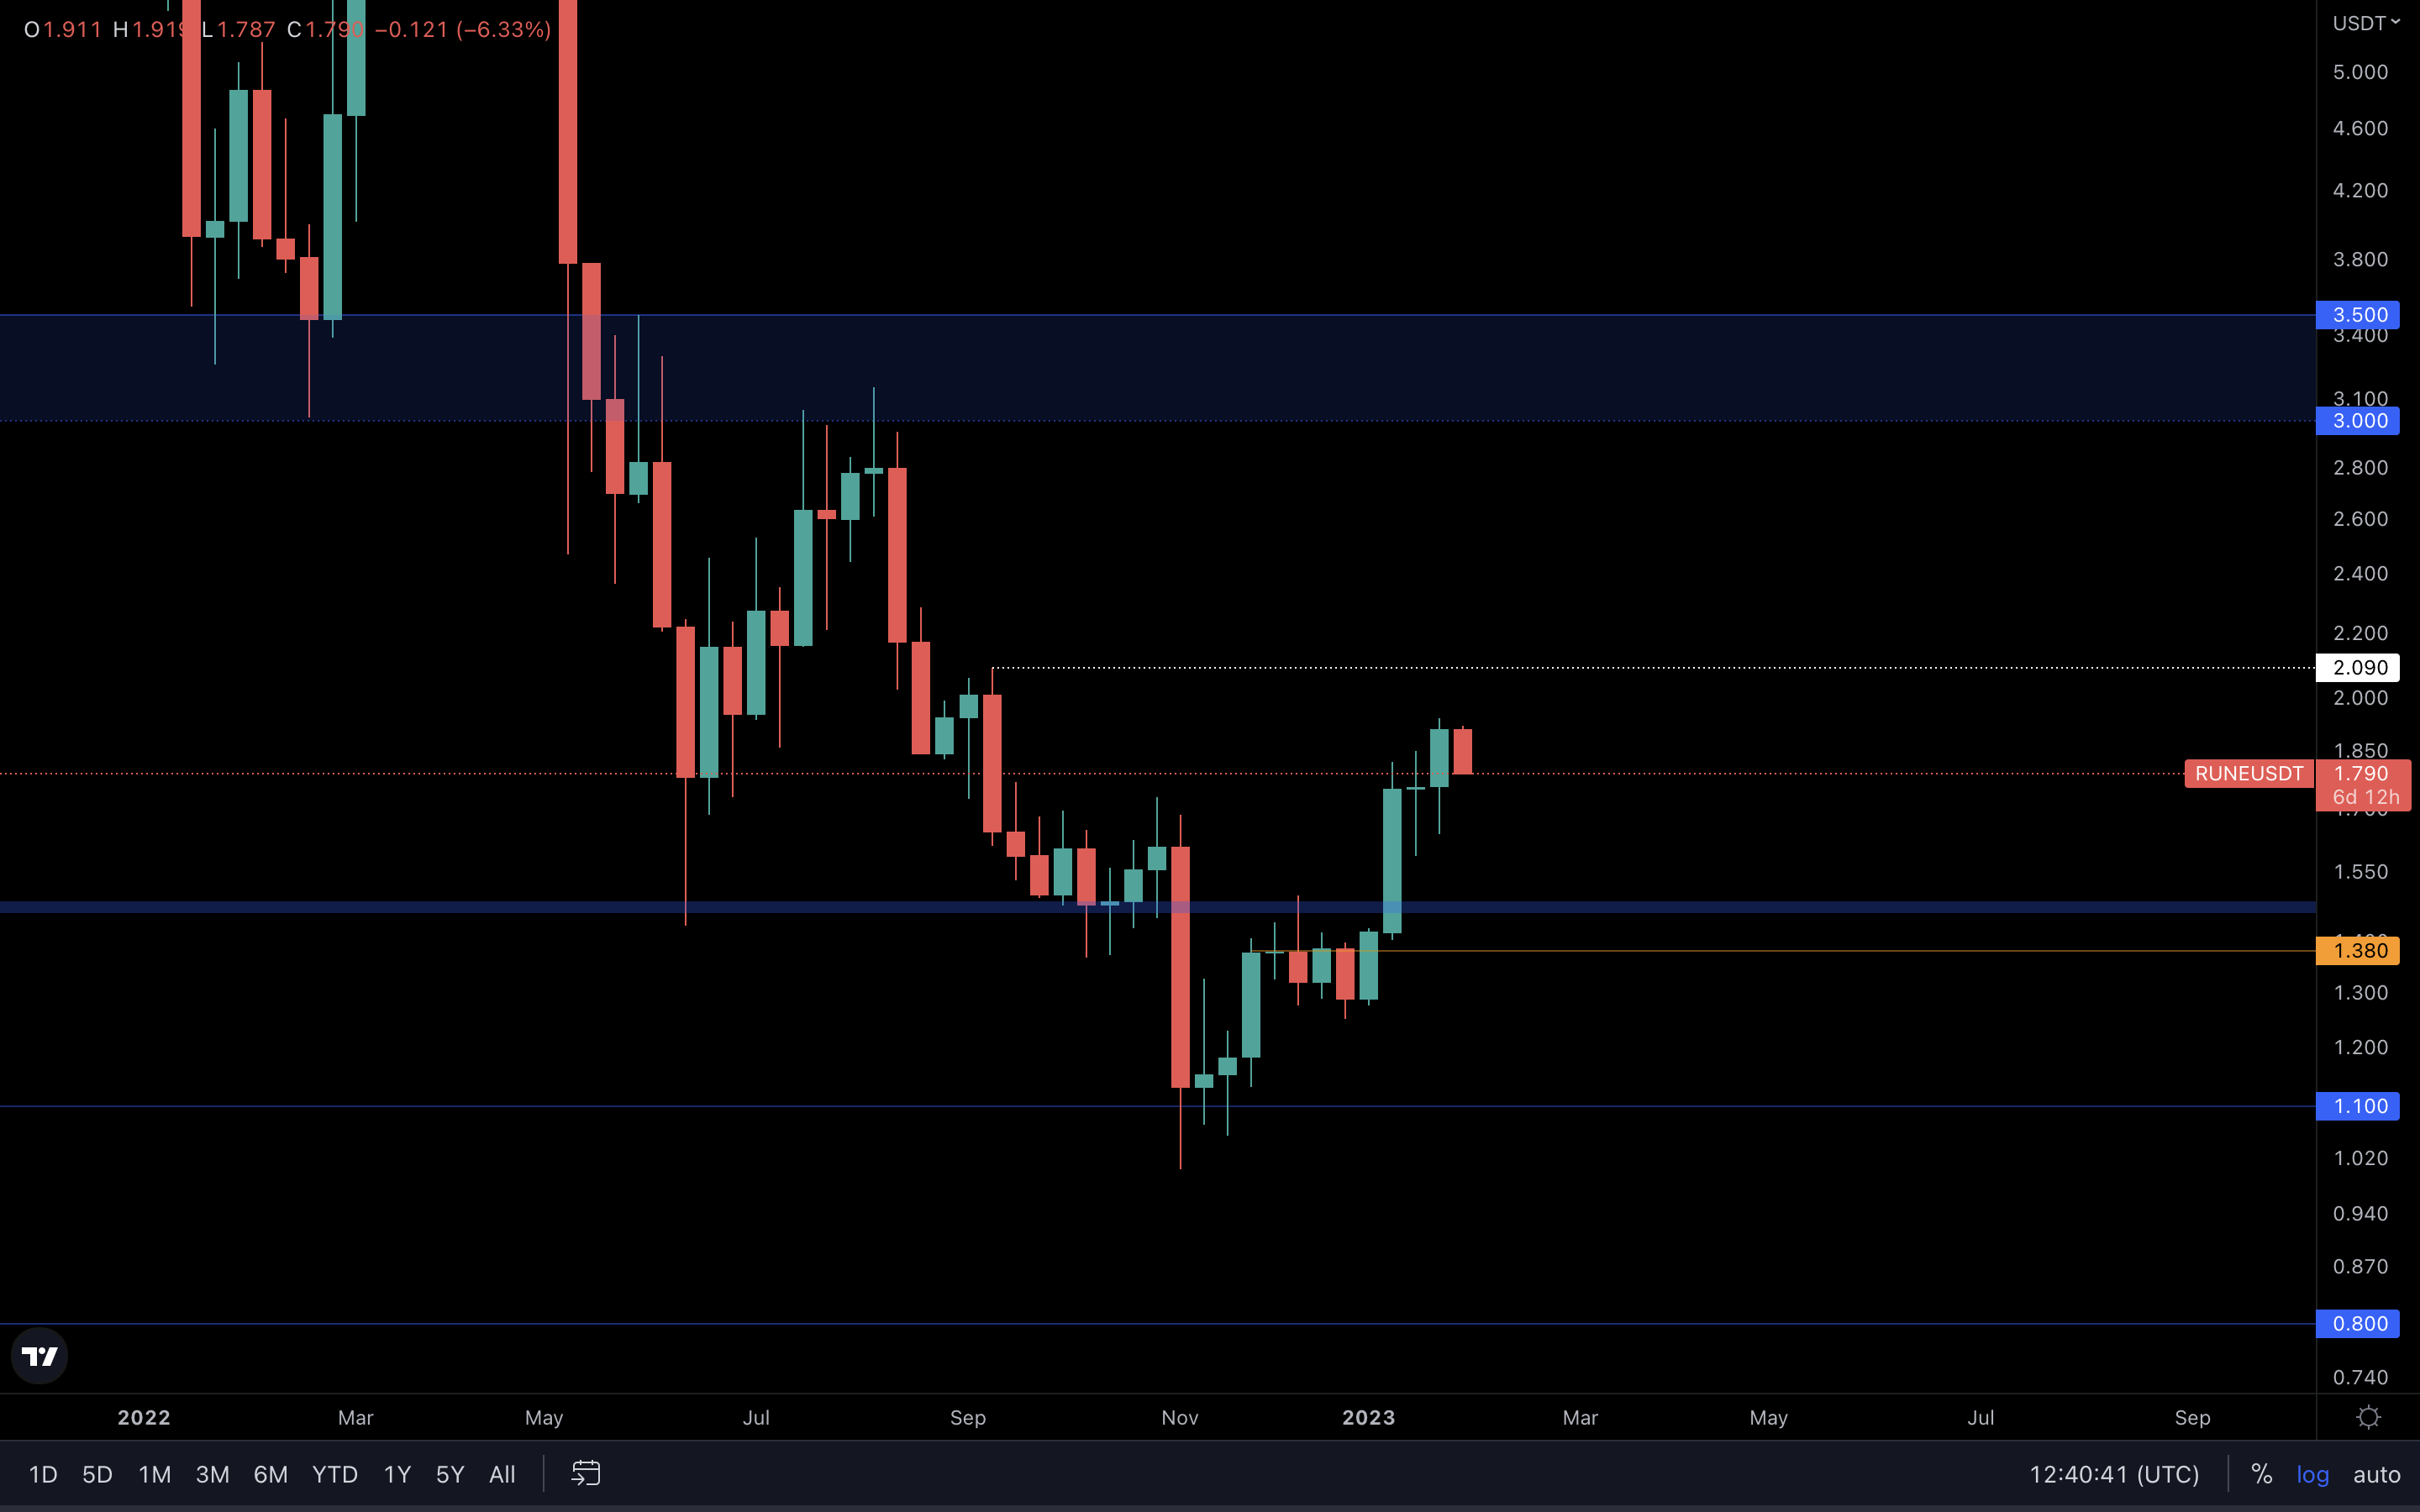
RUNE continues to perform well and is heading toward $2.09, the first line of resistance. This level is a previous weekly high, which makes it a level where sellers may step in and try to push the price lower. Given the fact that RUNE doesn’t have enough volume to sustain moves on its own, we should expect RUNE to follow Bitcoin. As we’ve mentioned already, waiting for Wednesday’s meeting is likely best before jumping on any opportunities.
SNX | Synthetix
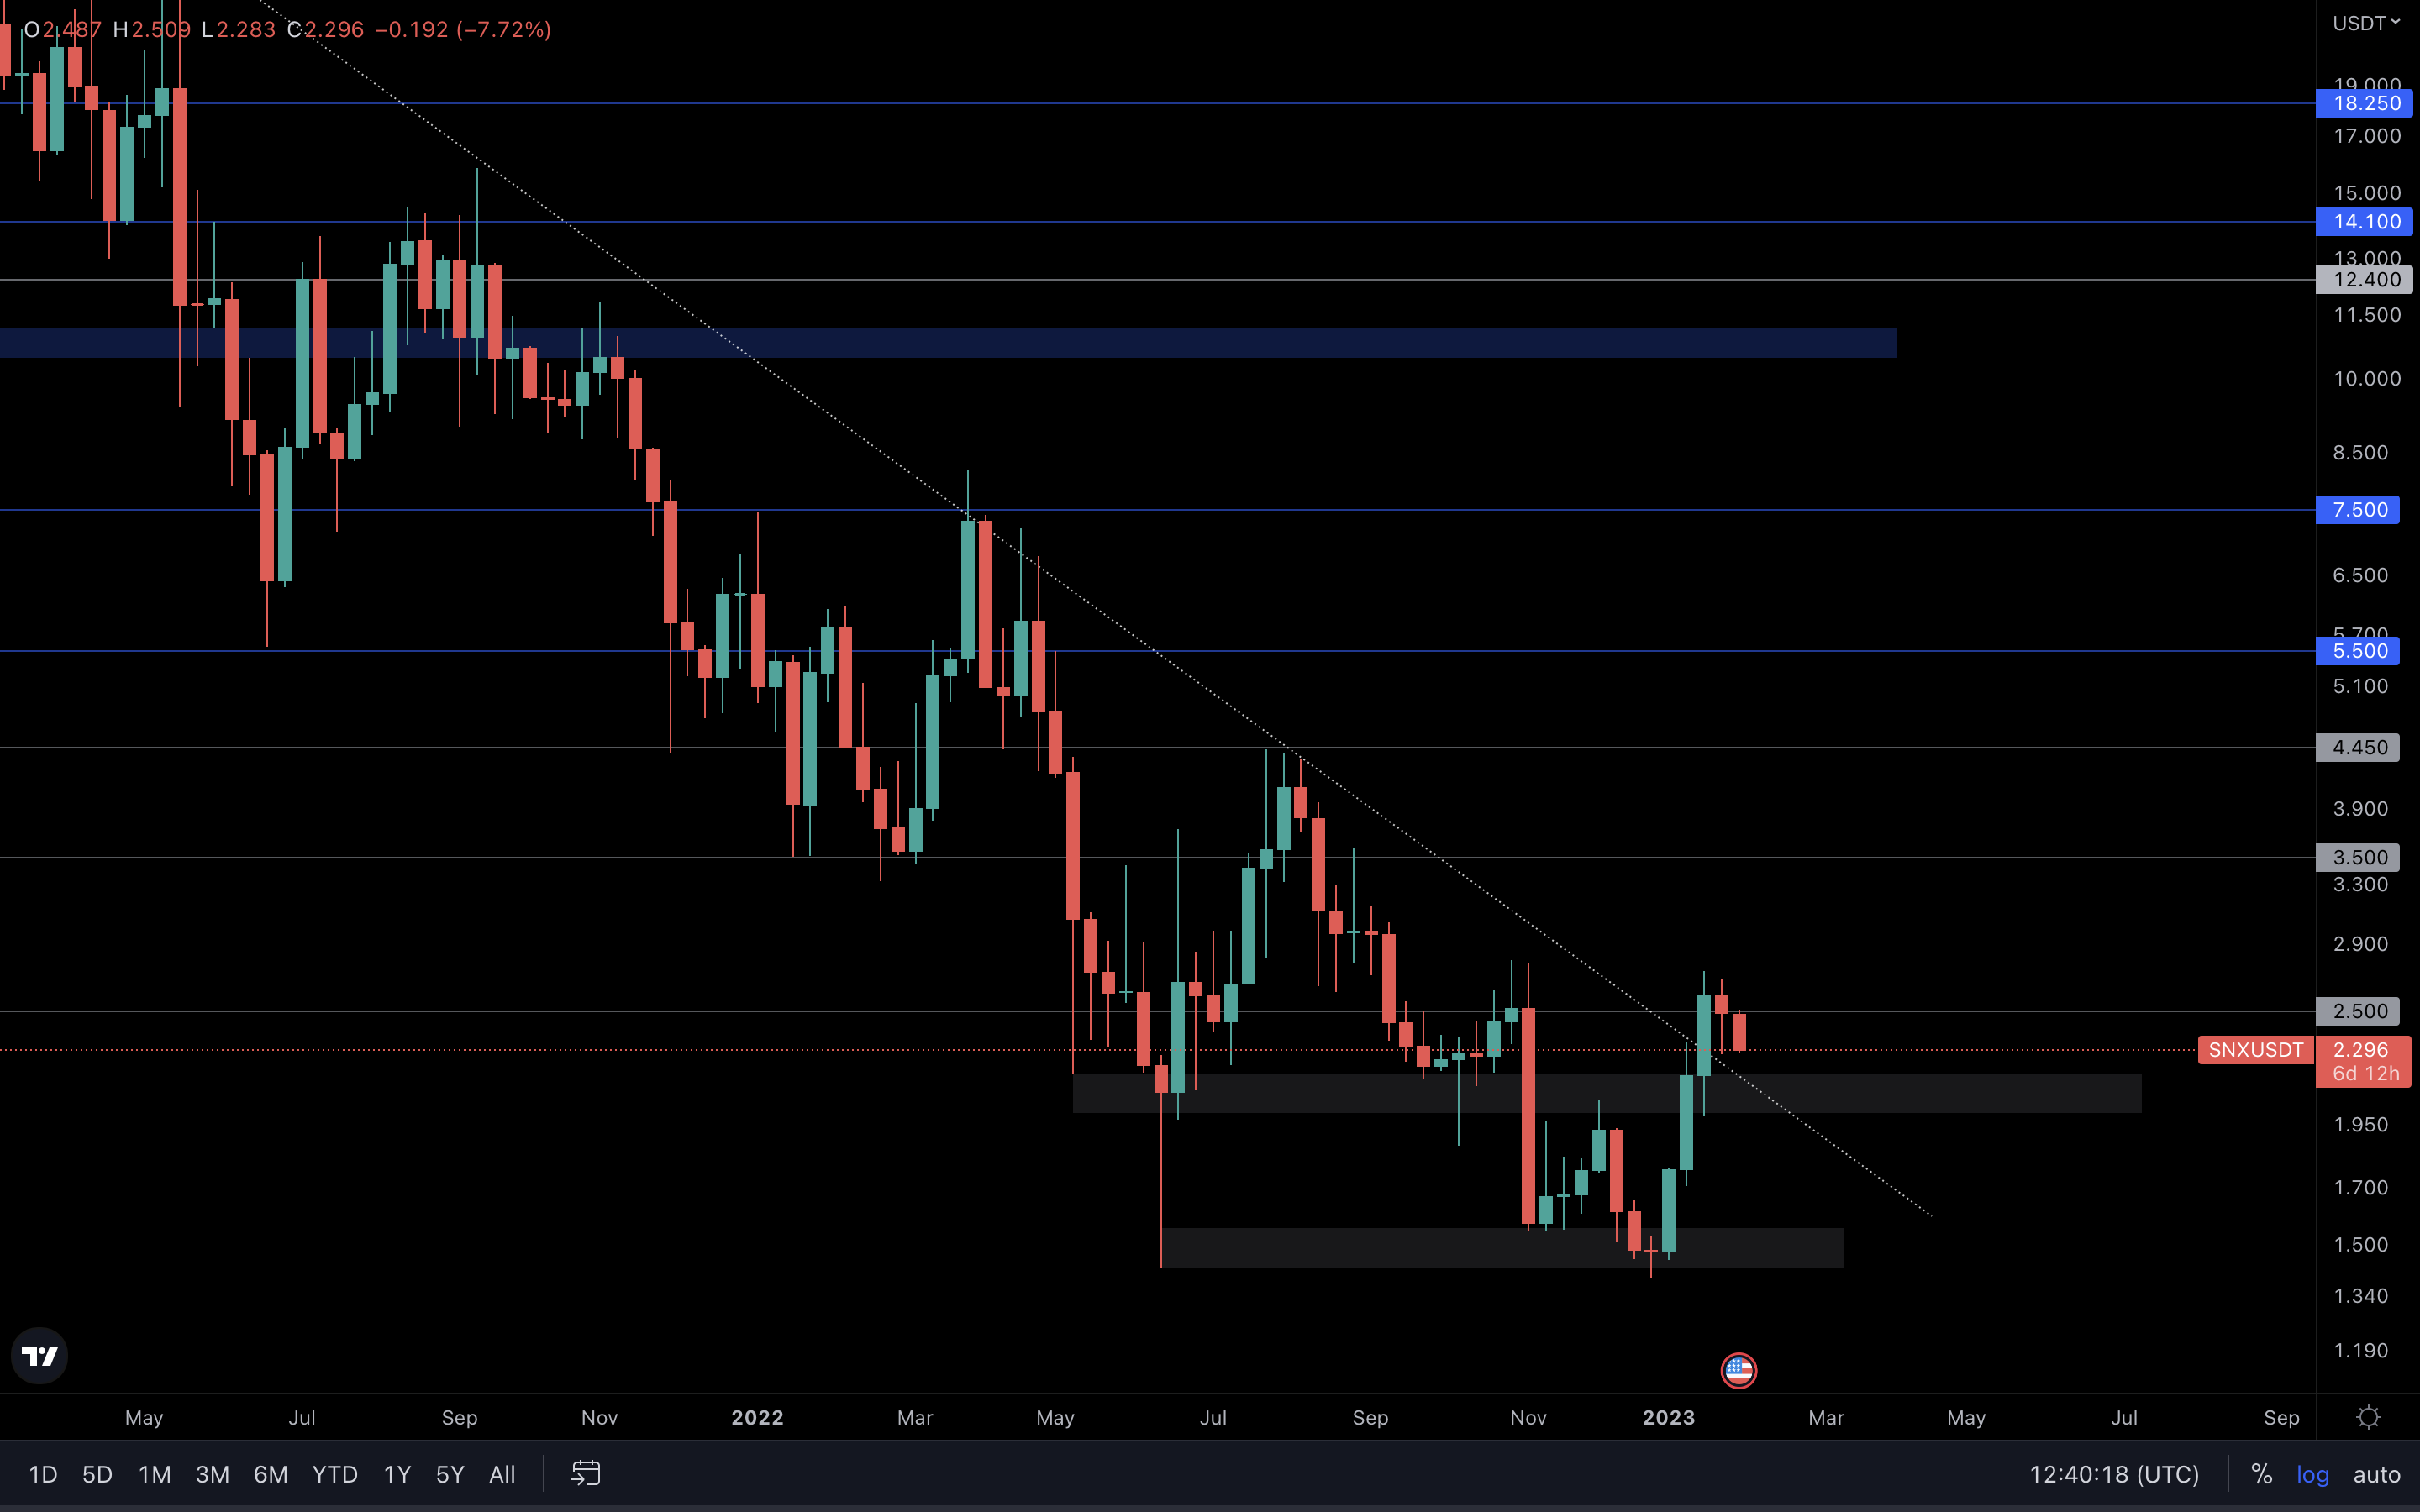
As unfortunate as it may sound, SNX was $0.014 away from closing the week above $2.50. Although this could be regarded as “reclaim” territory, we can’t help but think that SNX may not be able to properly reclaim this level yet.
What we would do in this situation is wait for another weekly closure, hopefully a clearer one which will close above $2.50. This will confirm a reclaim of this level, and open the doors for $3.50 and higher targets such as $4.45 and $5.50 in the near future.
January’s monthly closure is also extremely important for SNX. It would be ideal to see a monthly closure above $2.50. This would reinforce the possibility of going up higher. The higher the timeframe, the more strength there will be.
dYdX | DYDX
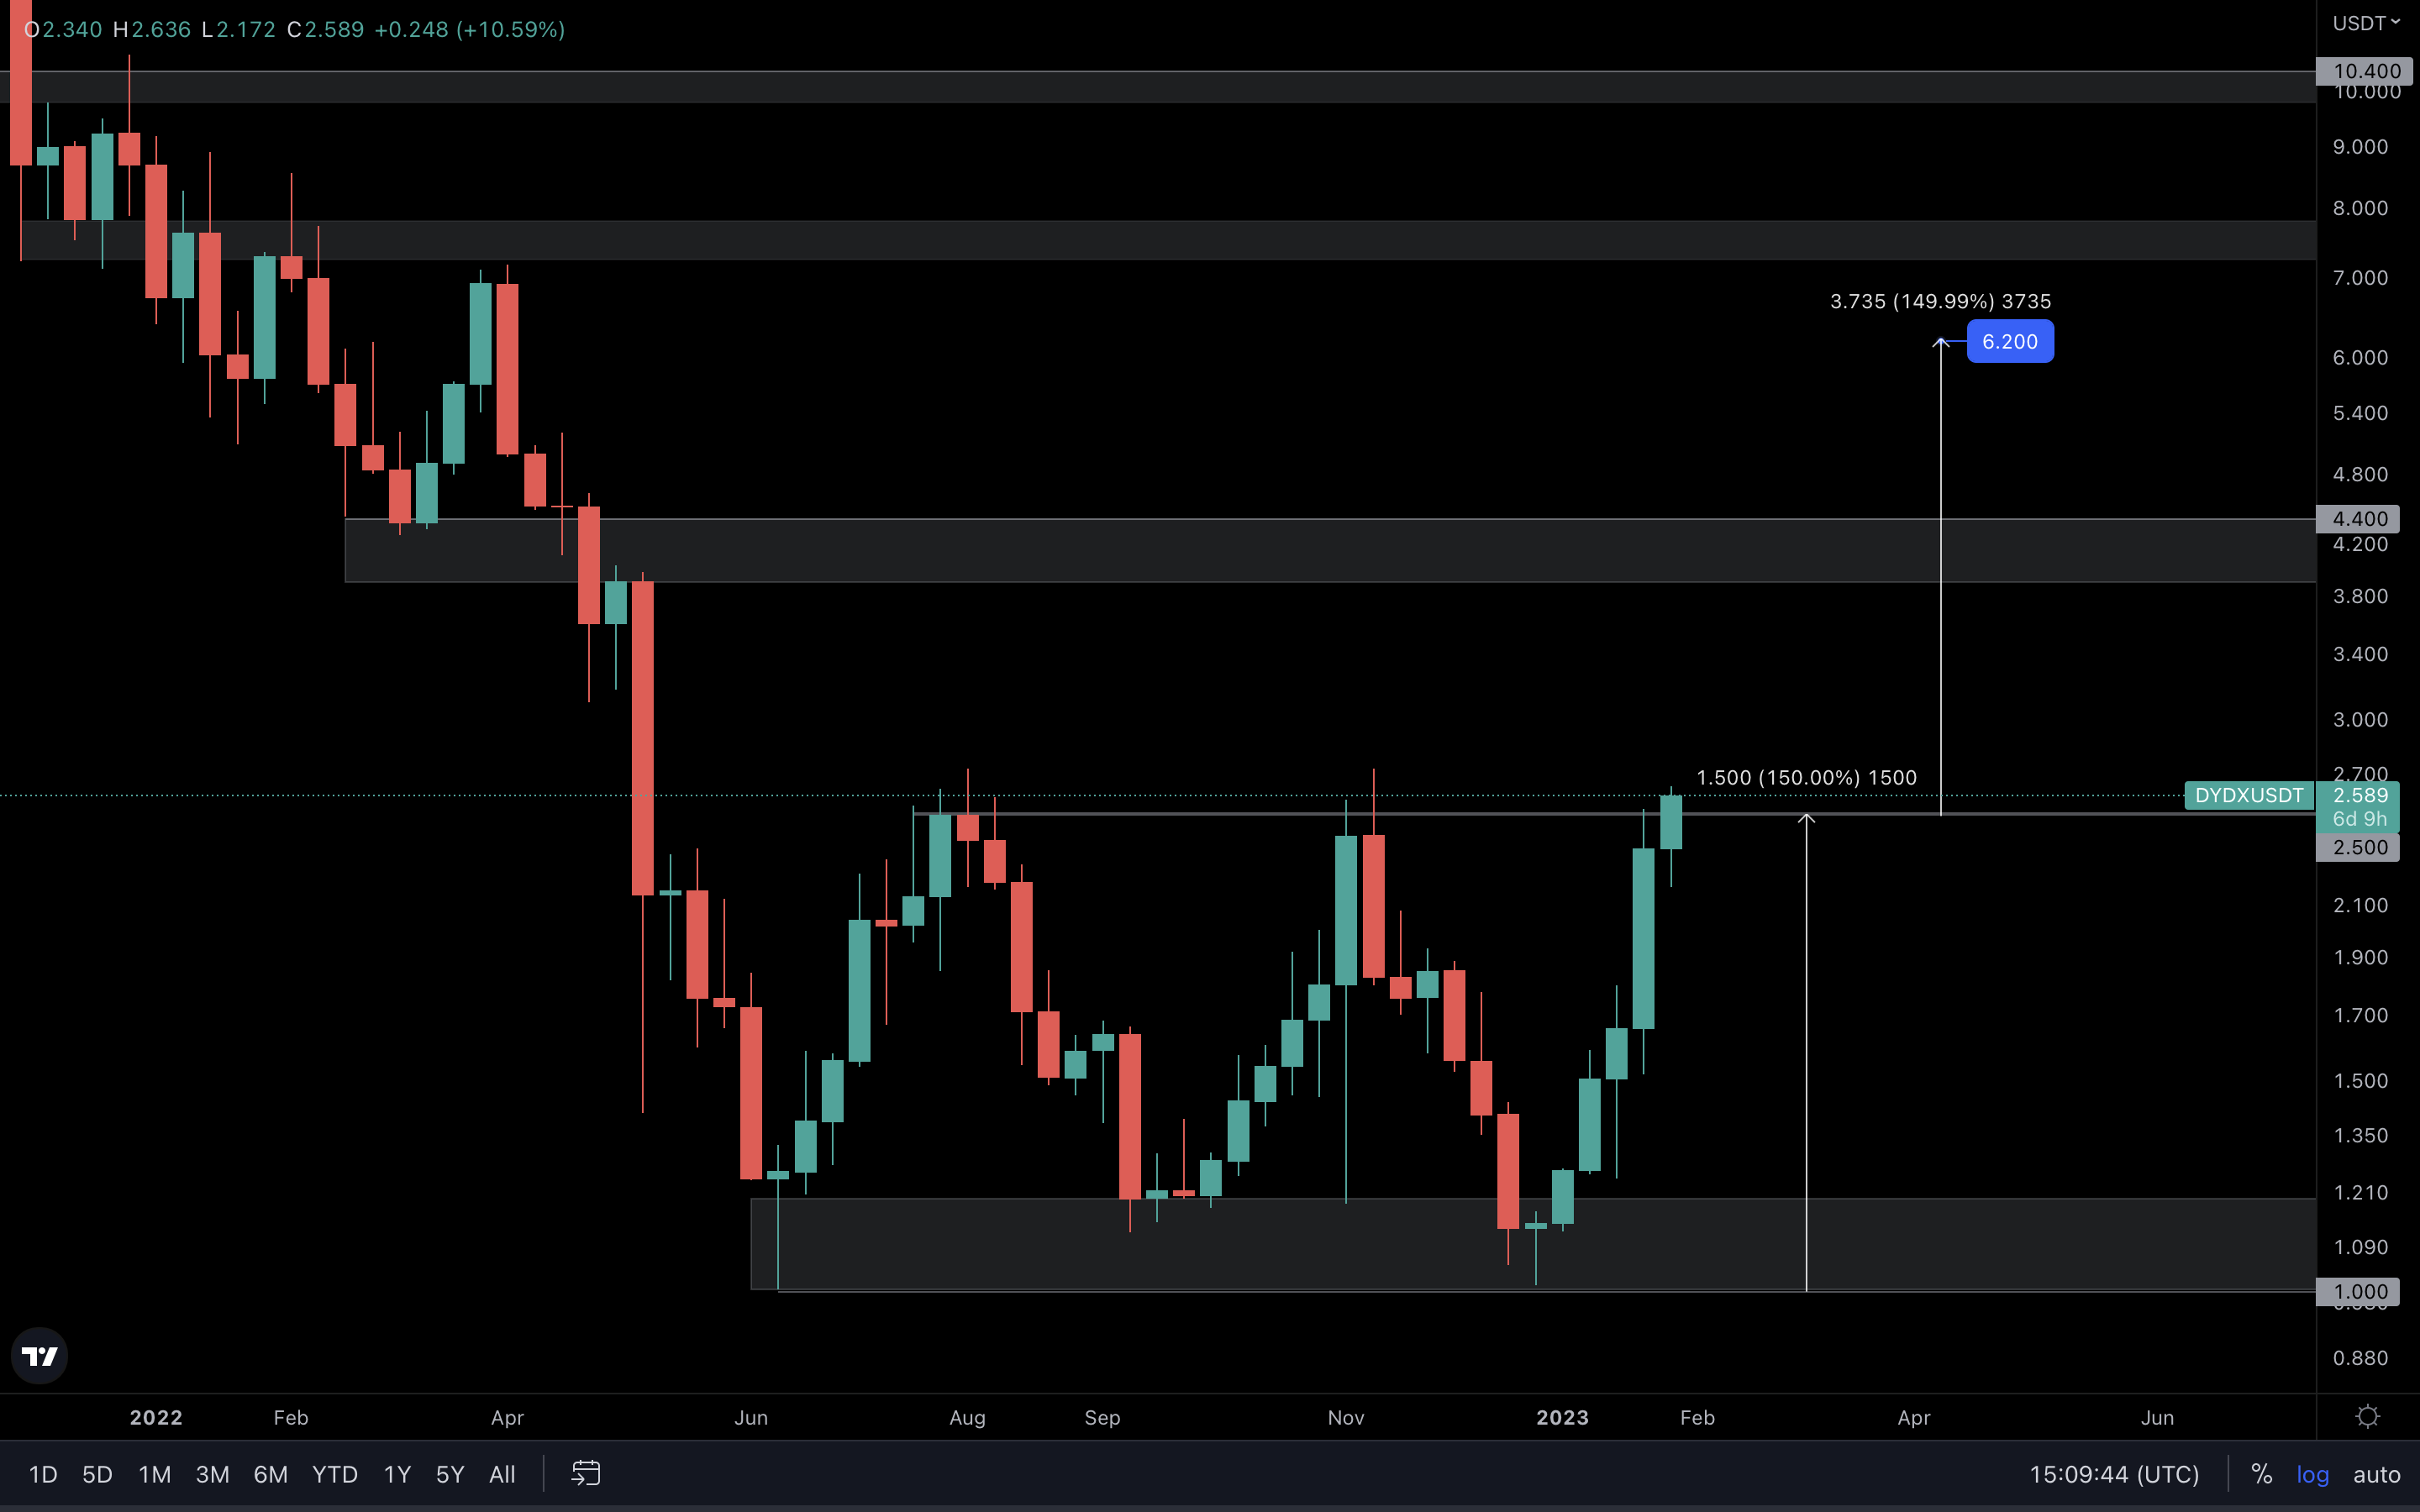
We haven’t yet seen a weekly reclaim of $2.50 here, which means the triple bottom isn’t validated. Only a clear weekly closure above $2.50 would confirm the triple bottom. We recommend waiting for this before deciding to jump. To determine the triple bottom’s technical target, we need to measure the distance between the bottom and top of the pattern. In this case, the distance is between $1 and $2.50. This distance is then placed above the top of the pattern ($2.50), which gives us a target for $6.20 for the triple bottom. There is another resistance area between $2.50 and $6.20. That’s the grey box you’re seeing on the chart between $4 and $4.40. For $6.20 to come into play, DYDX needs to reclaim this area. At this time, DYDX is one of the most interesting opportunities in our asset list.
Cryptonary's Watchlist
DOT | Polkadot
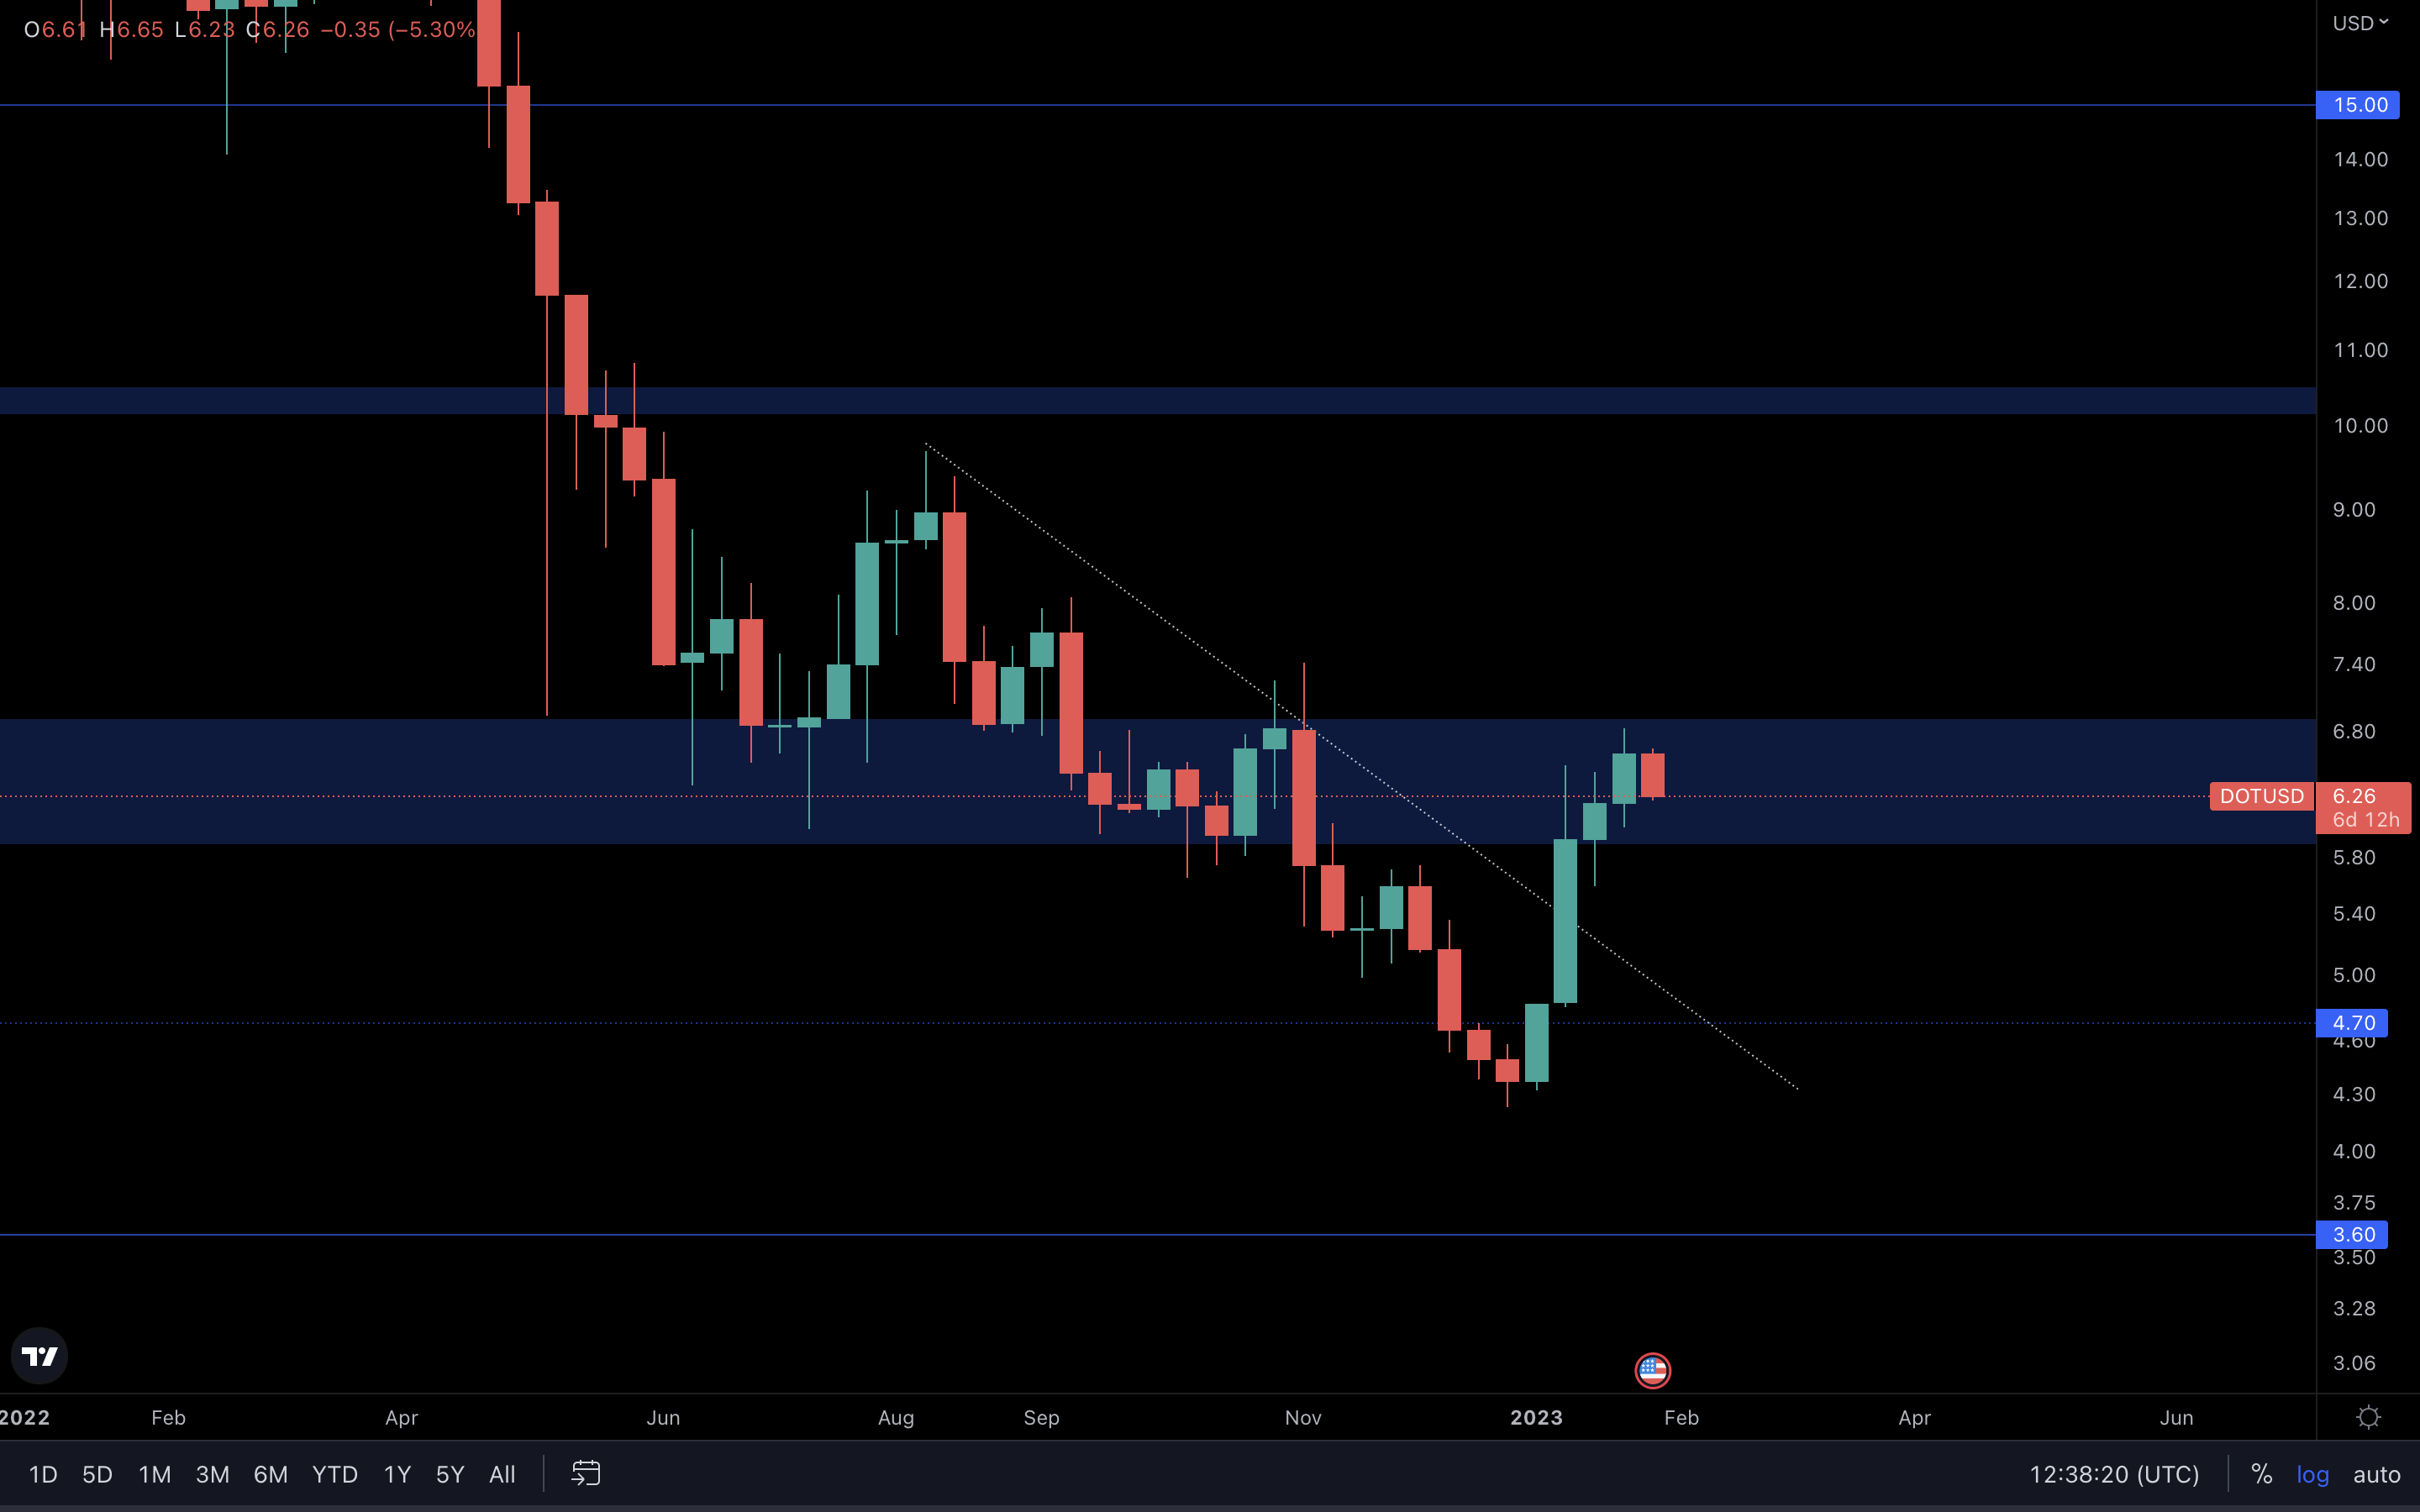
DOT is stuck ranging between $6 and $7. Only a break of one of these levels would confirm where it’s headed next. In the meantime, we can predict where DOT might be headed to by tracking Bitcoin’s price action. Where BTC goes, DOT will follow.
SYN | Synapse
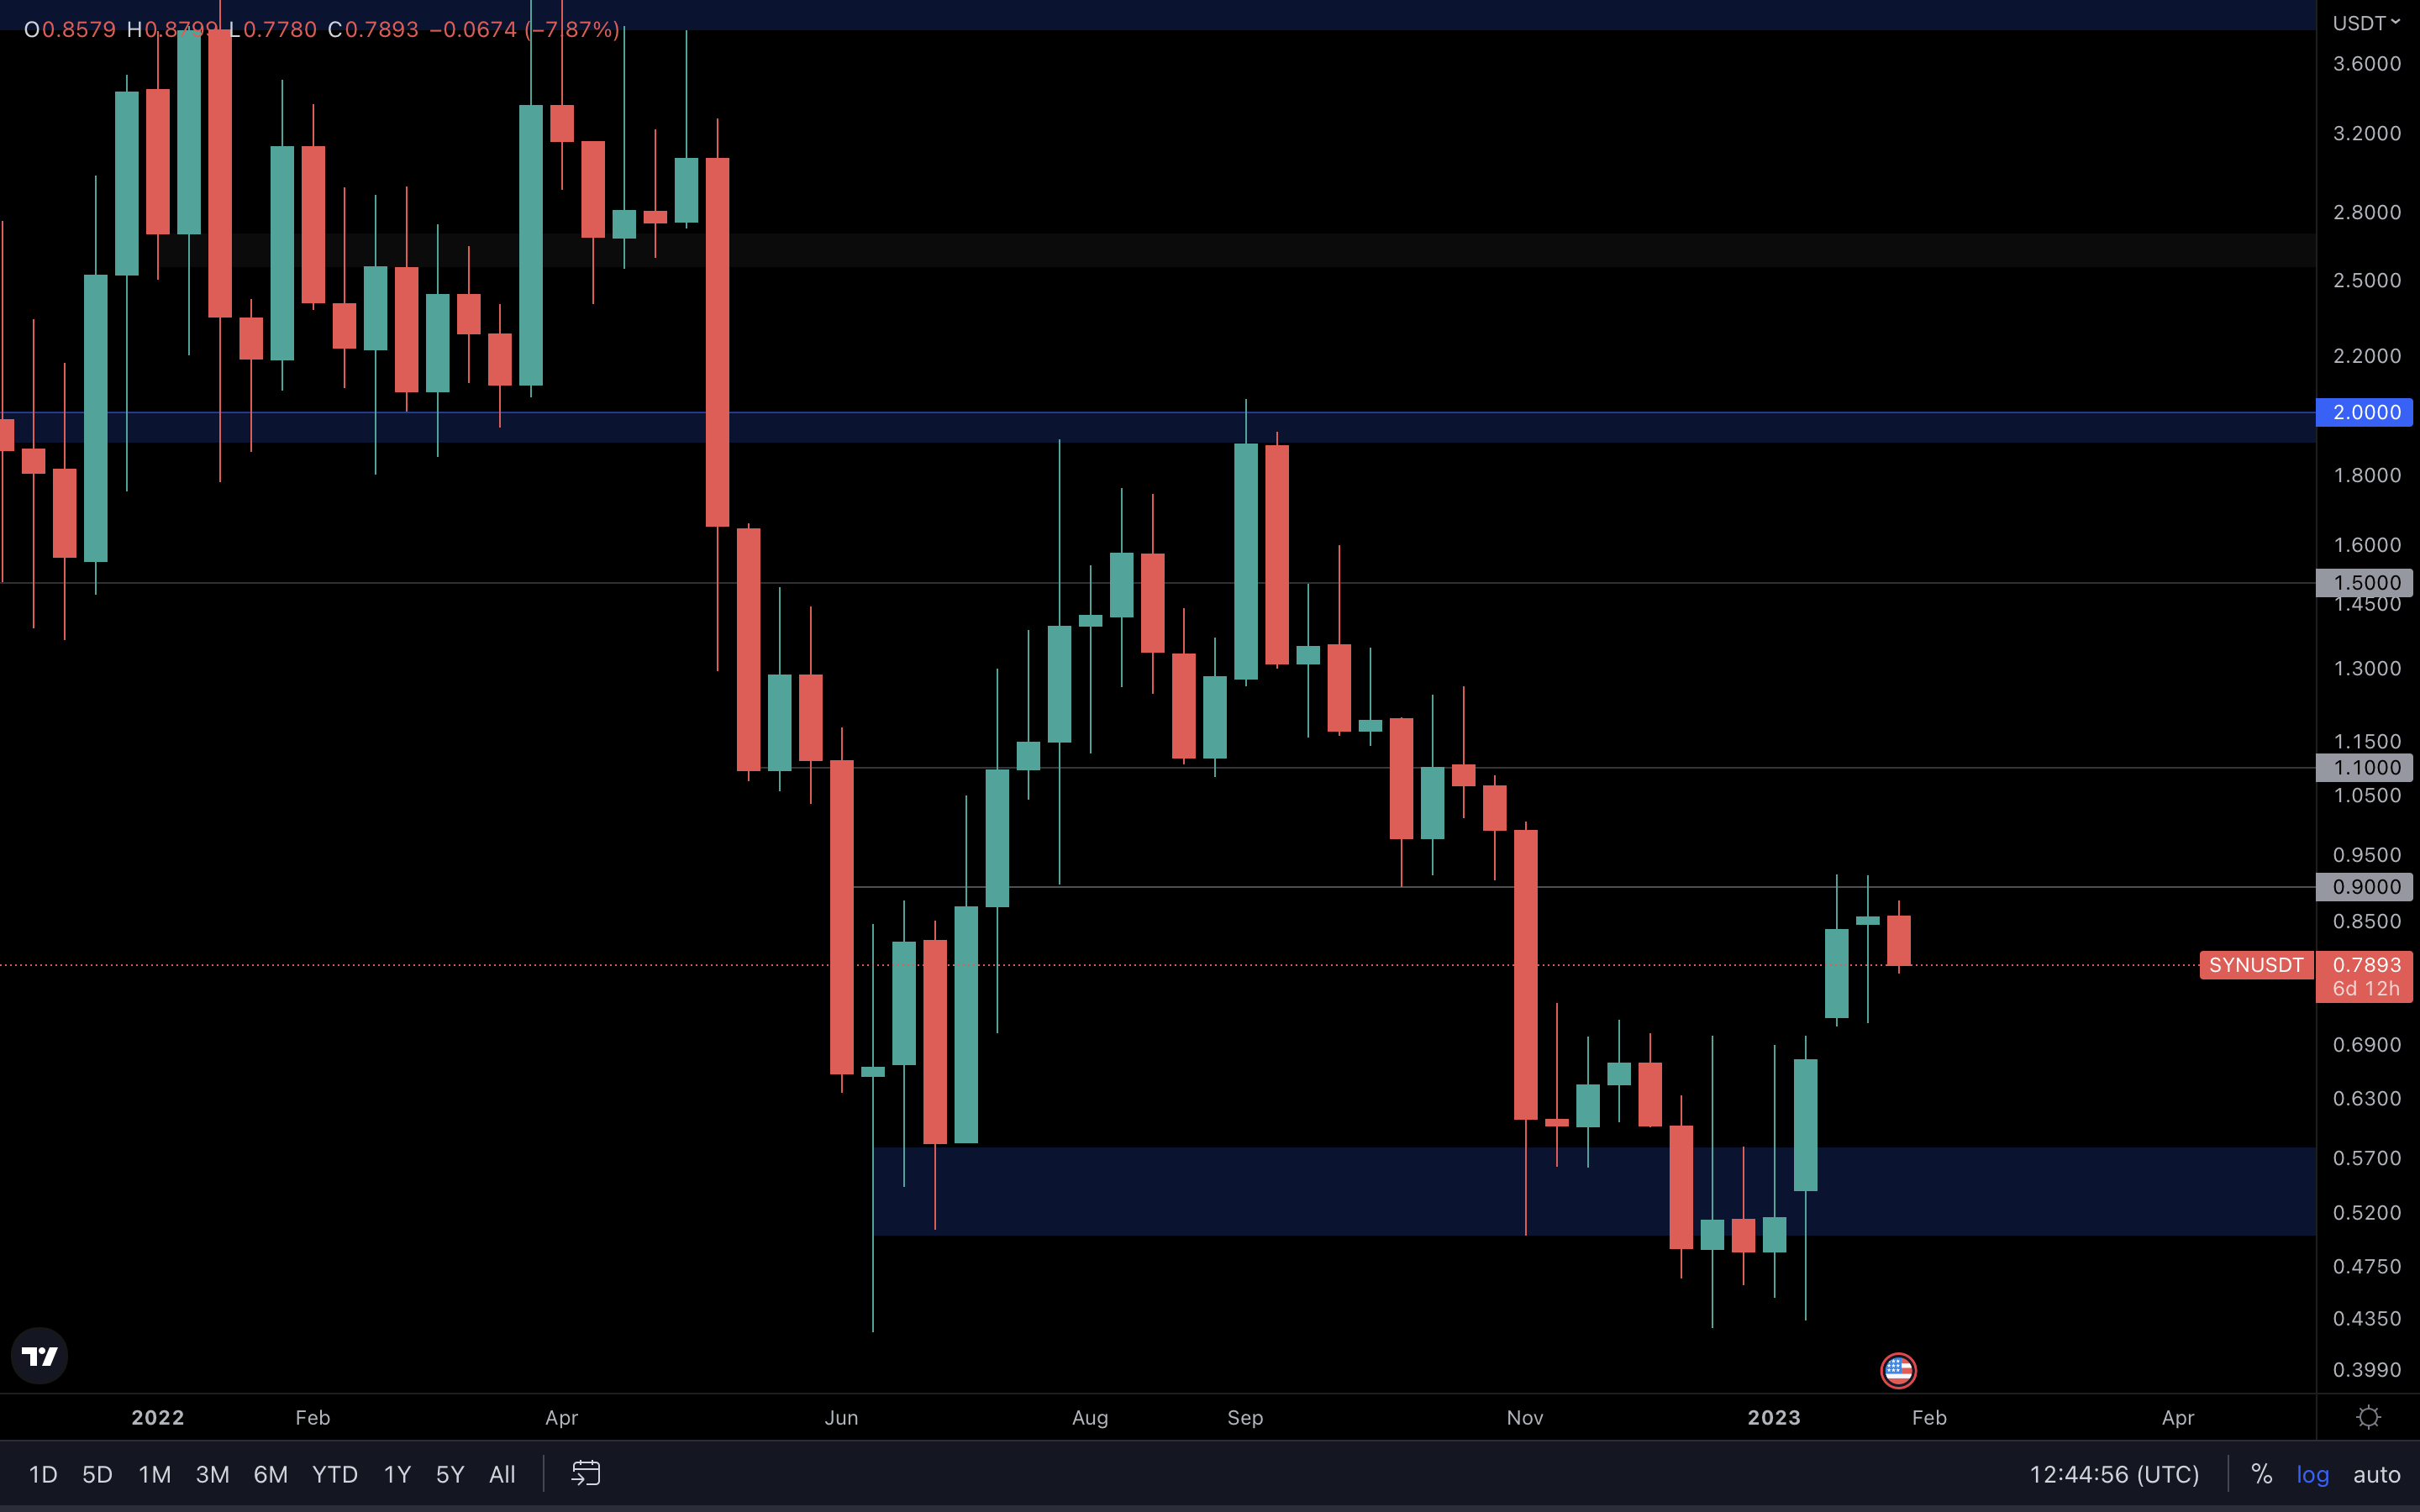
SYN hasn’t seen a reclaim of $0.90 yet, which takes the upside out of play for the time being. Once a reclaim of $0.90, we can expect higher targets, such as $1.10 and $1.50, to follow. Unless the level is reclaimed, SYN risks rejection.
OP | Optimism
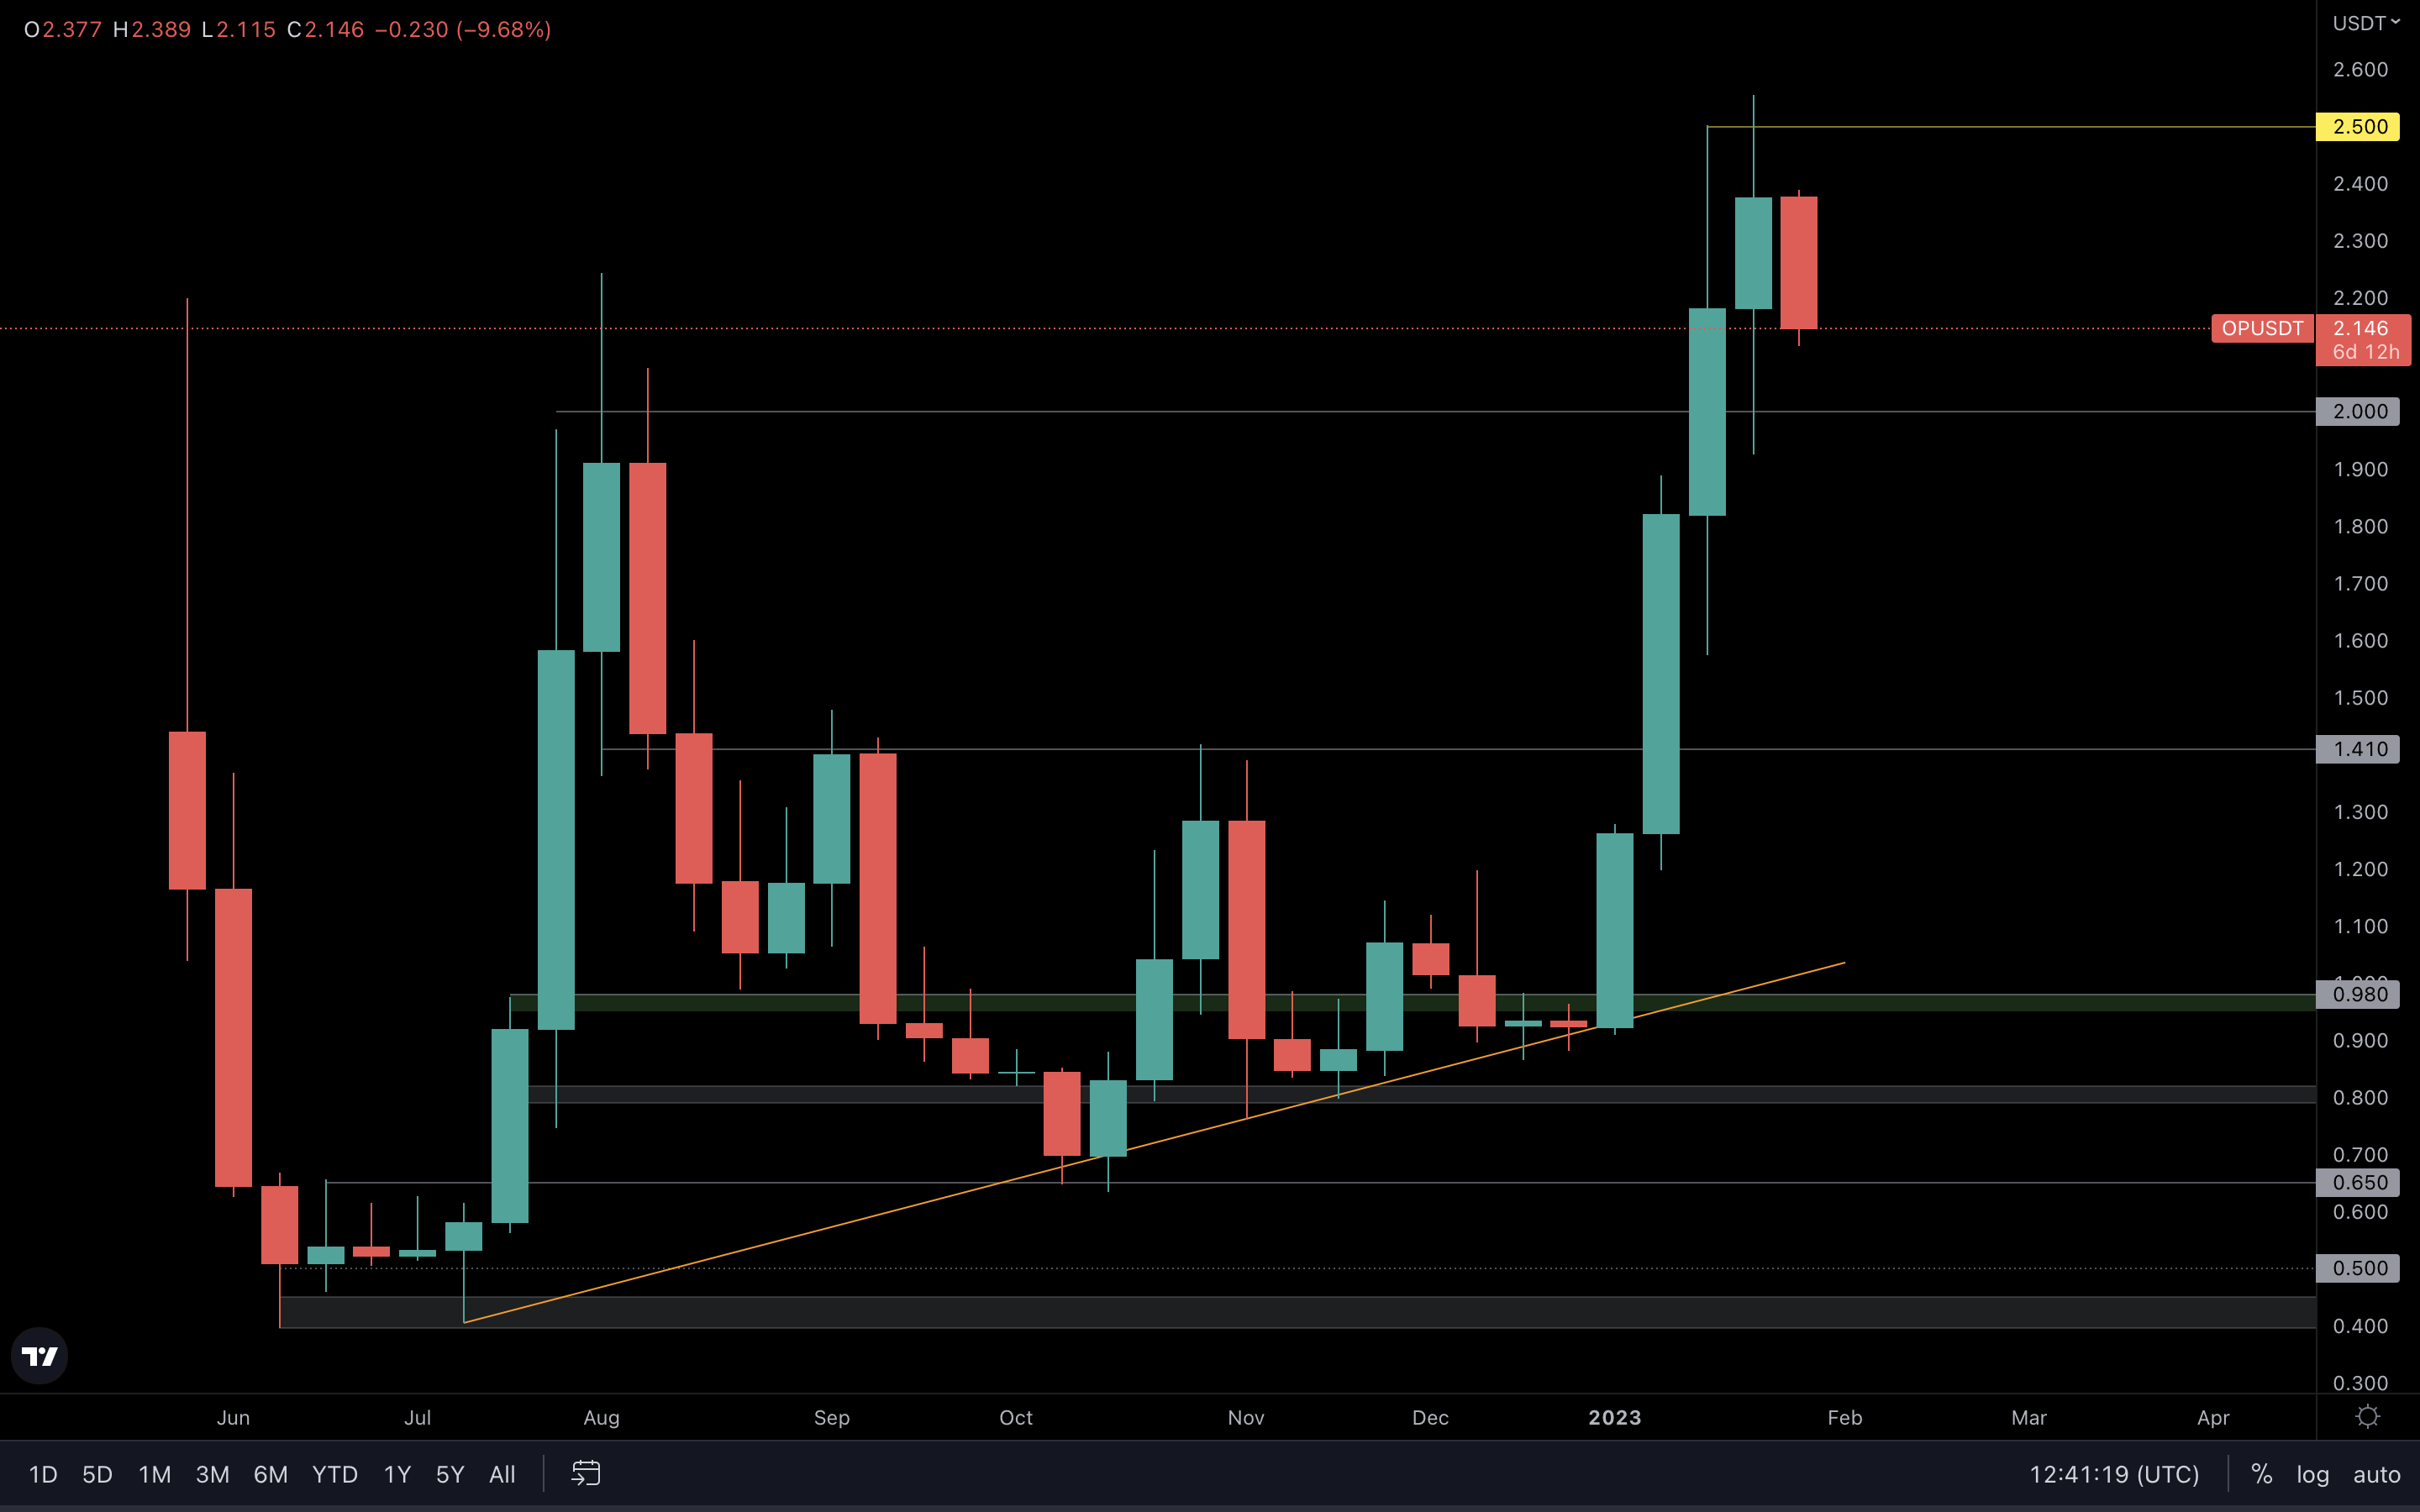
This is one of the most volatile assets we cover in our reports, which makes it a beautiful contestant for all traders out there. Besides $2.50, OP has no technical resistances above that level. This means we’ll have to look for psychological levels like $3, $3.50, $4 and so on instead. For the time being, OP is trading between $2.50 and $2, which again, makes it a great asset to trade within the short term. However, if you’re interested in higher targets, $2.50 needs to be reclaimed first before confirming higher prices. Keep in mind that the risk/reward ratio (R/R) gets worse the higher OP rises. So, it might not be the best asset to accumulate, especially since it’s almost at its peak.
LDO | Lido DAO
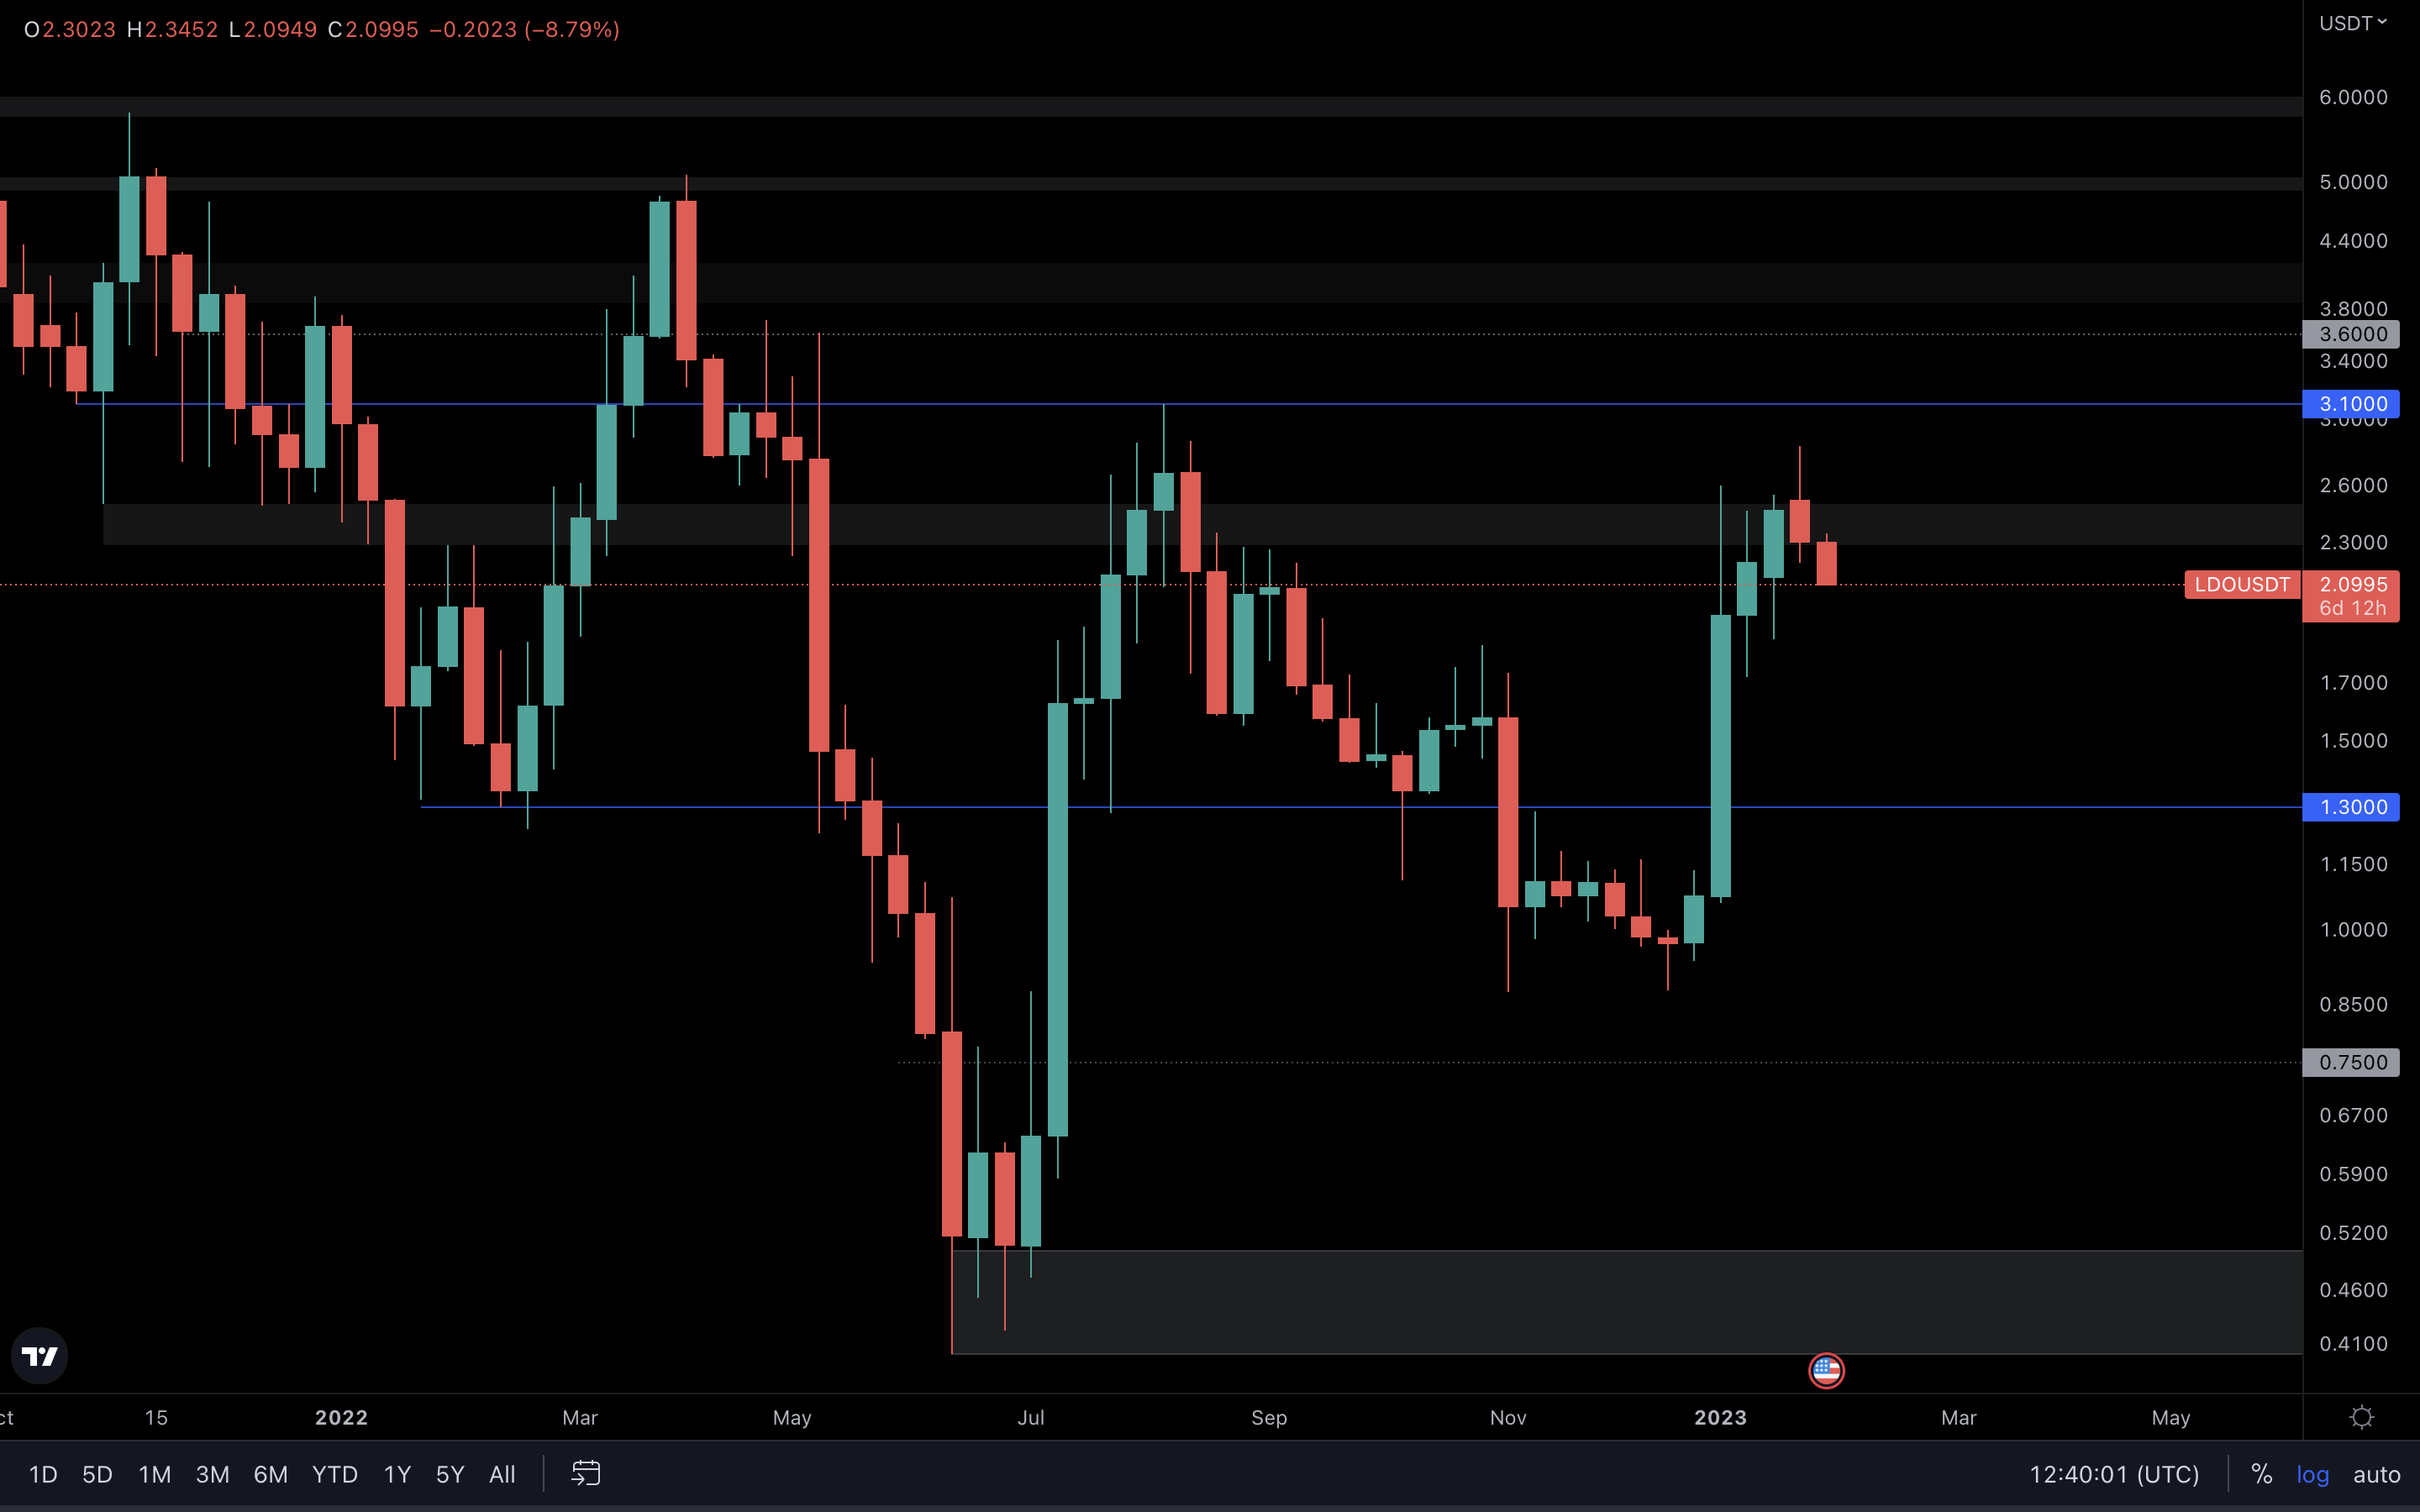 It seems LDO is starting to slow down after reaching this resistance area on the weekly timeframe. This means we could be looking at a rejection as we speak, which will lead to a higher low being formed anywhere between LDO’s current price and $1.30 (the nearest support).
For us to expect more upside for LDO, the grey box needs to be reclaimed ($2.50). This will open the doors for $3.10, which is the closest resistance level after $2.50.
It seems LDO is starting to slow down after reaching this resistance area on the weekly timeframe. This means we could be looking at a rejection as we speak, which will lead to a higher low being formed anywhere between LDO’s current price and $1.30 (the nearest support).
For us to expect more upside for LDO, the grey box needs to be reclaimed ($2.50). This will open the doors for $3.10, which is the closest resistance level after $2.50.
HEGIC | Hegic
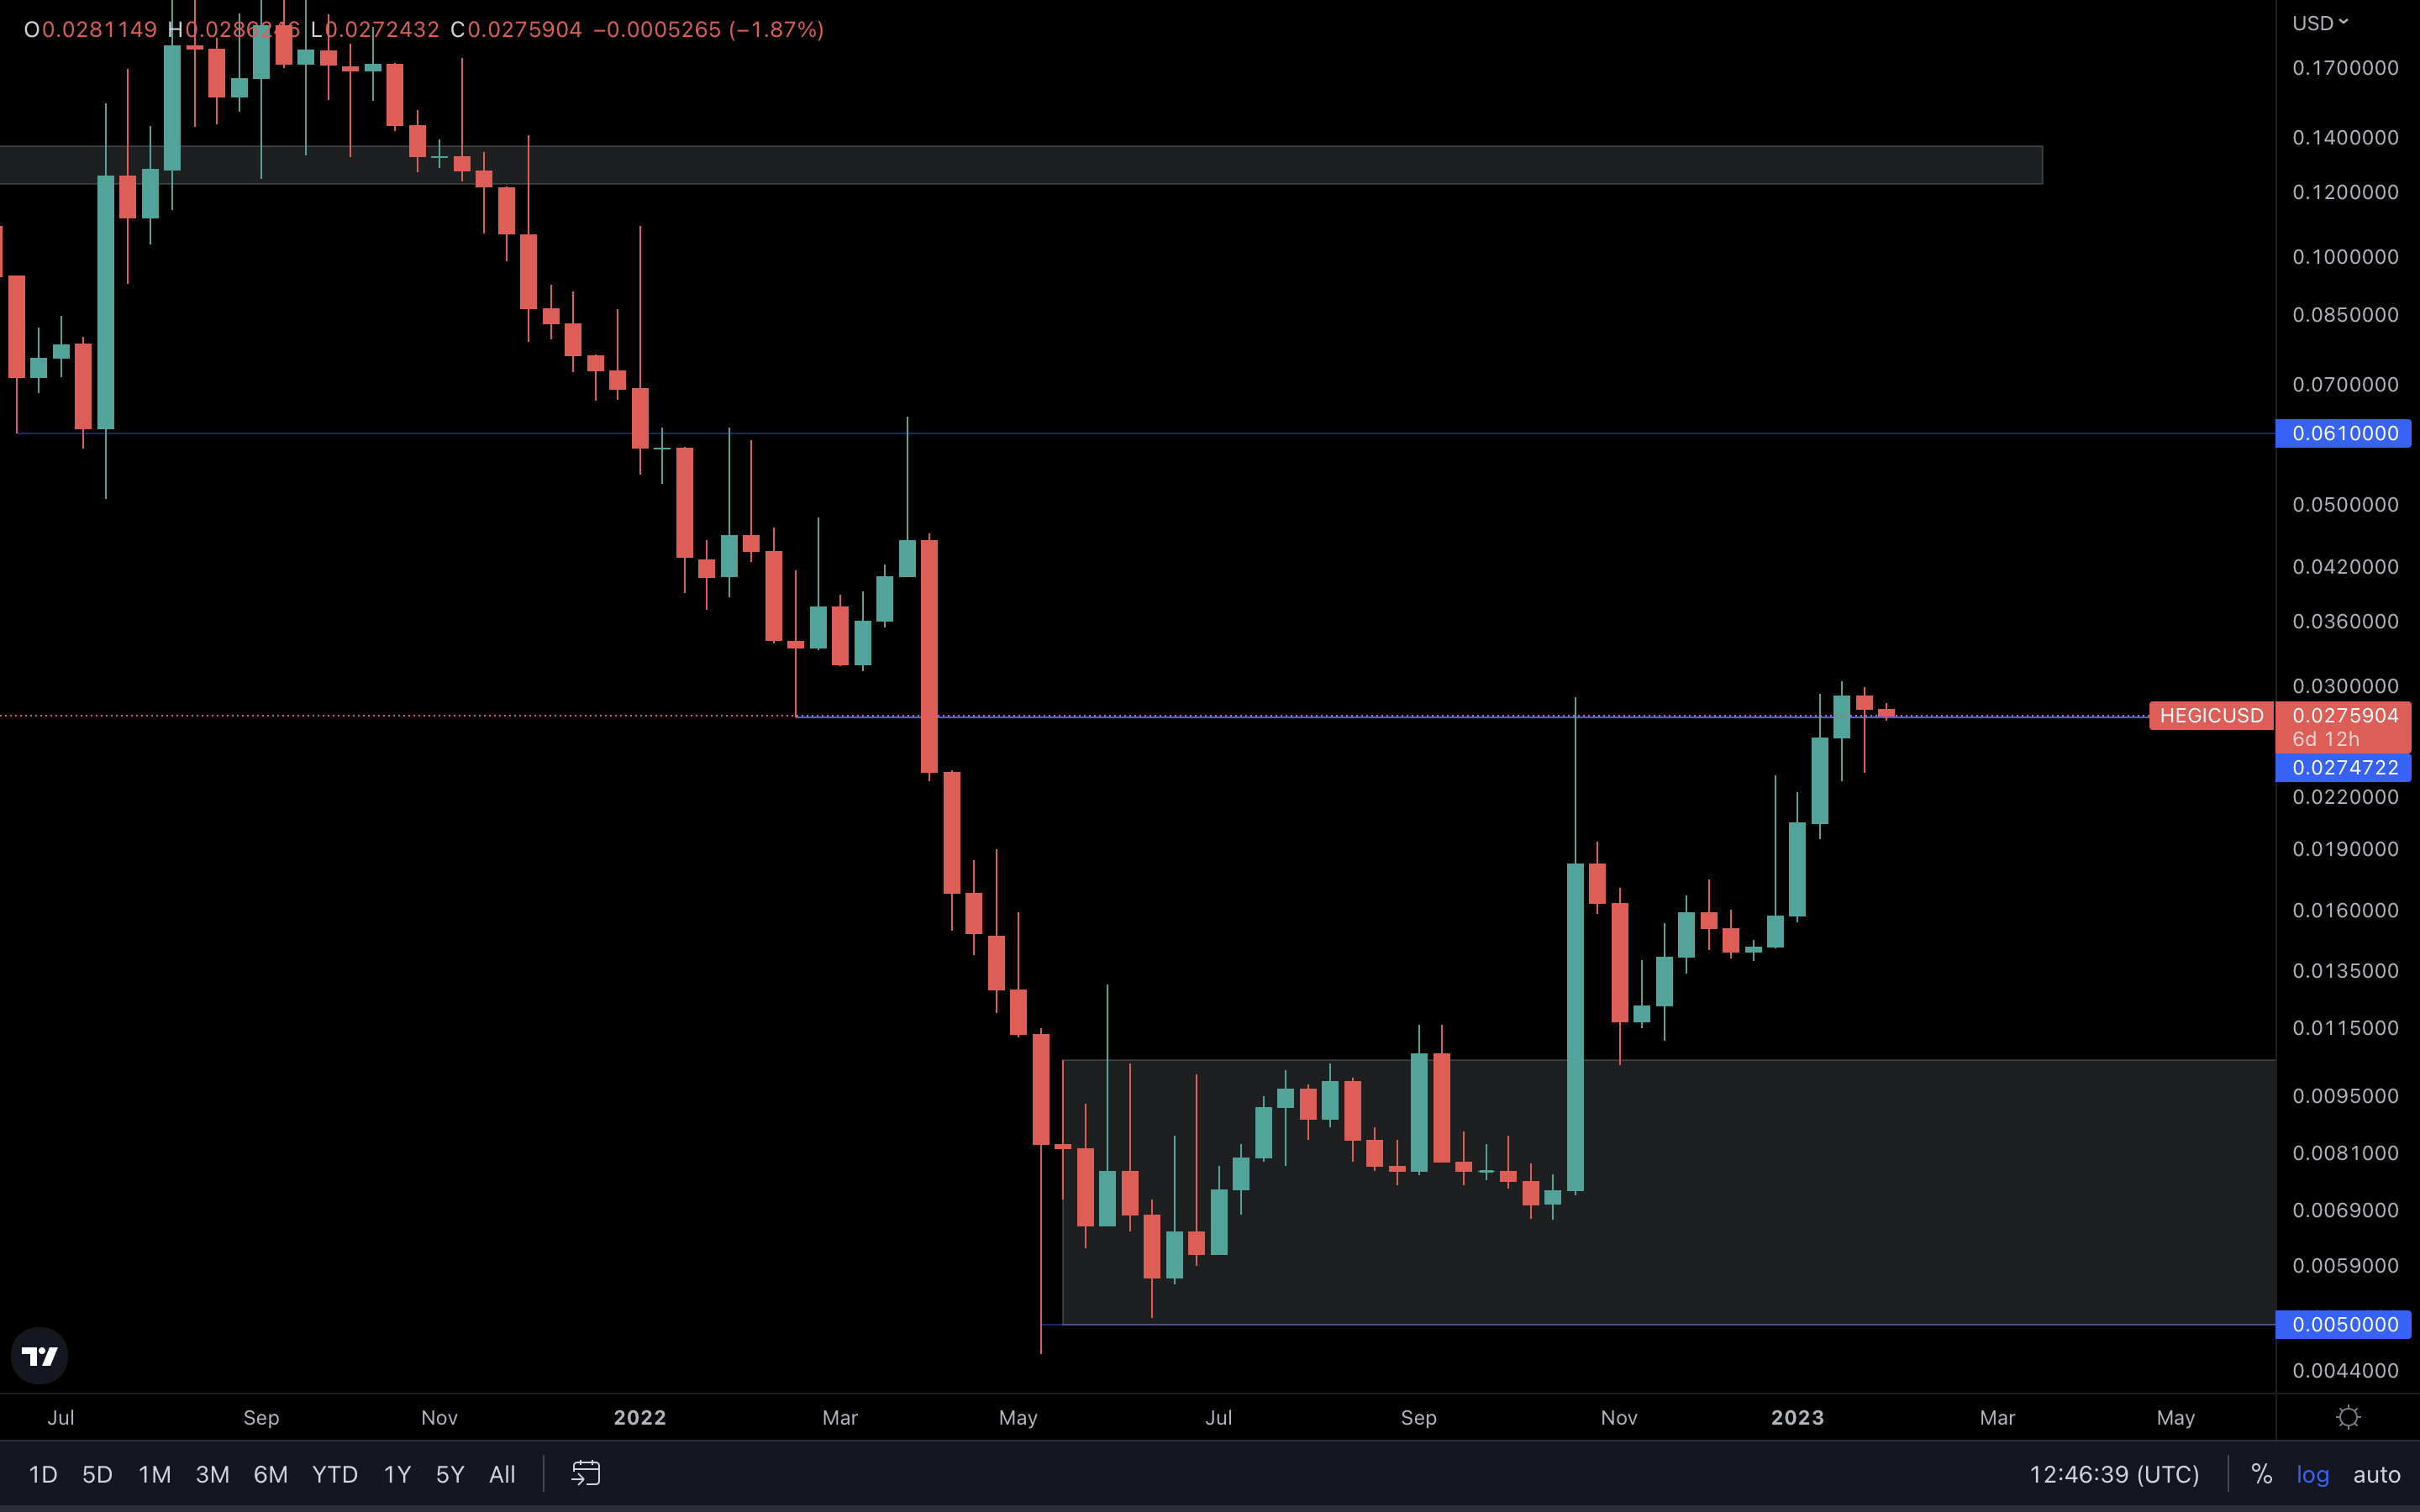
HEGIC’s current level was retested as support last week, and even with all the selling pressure we’ve seen (based on the wick), it still managed to close above support. This confirms a move to $0.061, the next resistance level,which is about 120% away from its current price. There’s one issue here though, and that’s the way HEGIC may react if Bitcoin experiences a pullback. A pullback for Bitcoin will affect most altcoins, and HEGIC is likely one of them. This means that if Bitcoin goes down, HEGIC will invalidate the reclaim and lose support. In return, the move to $0.061 will also be invalidated. In short, if HEGIC holds support at the current level, $0.061 remains on the cards.
ASTR | Astar
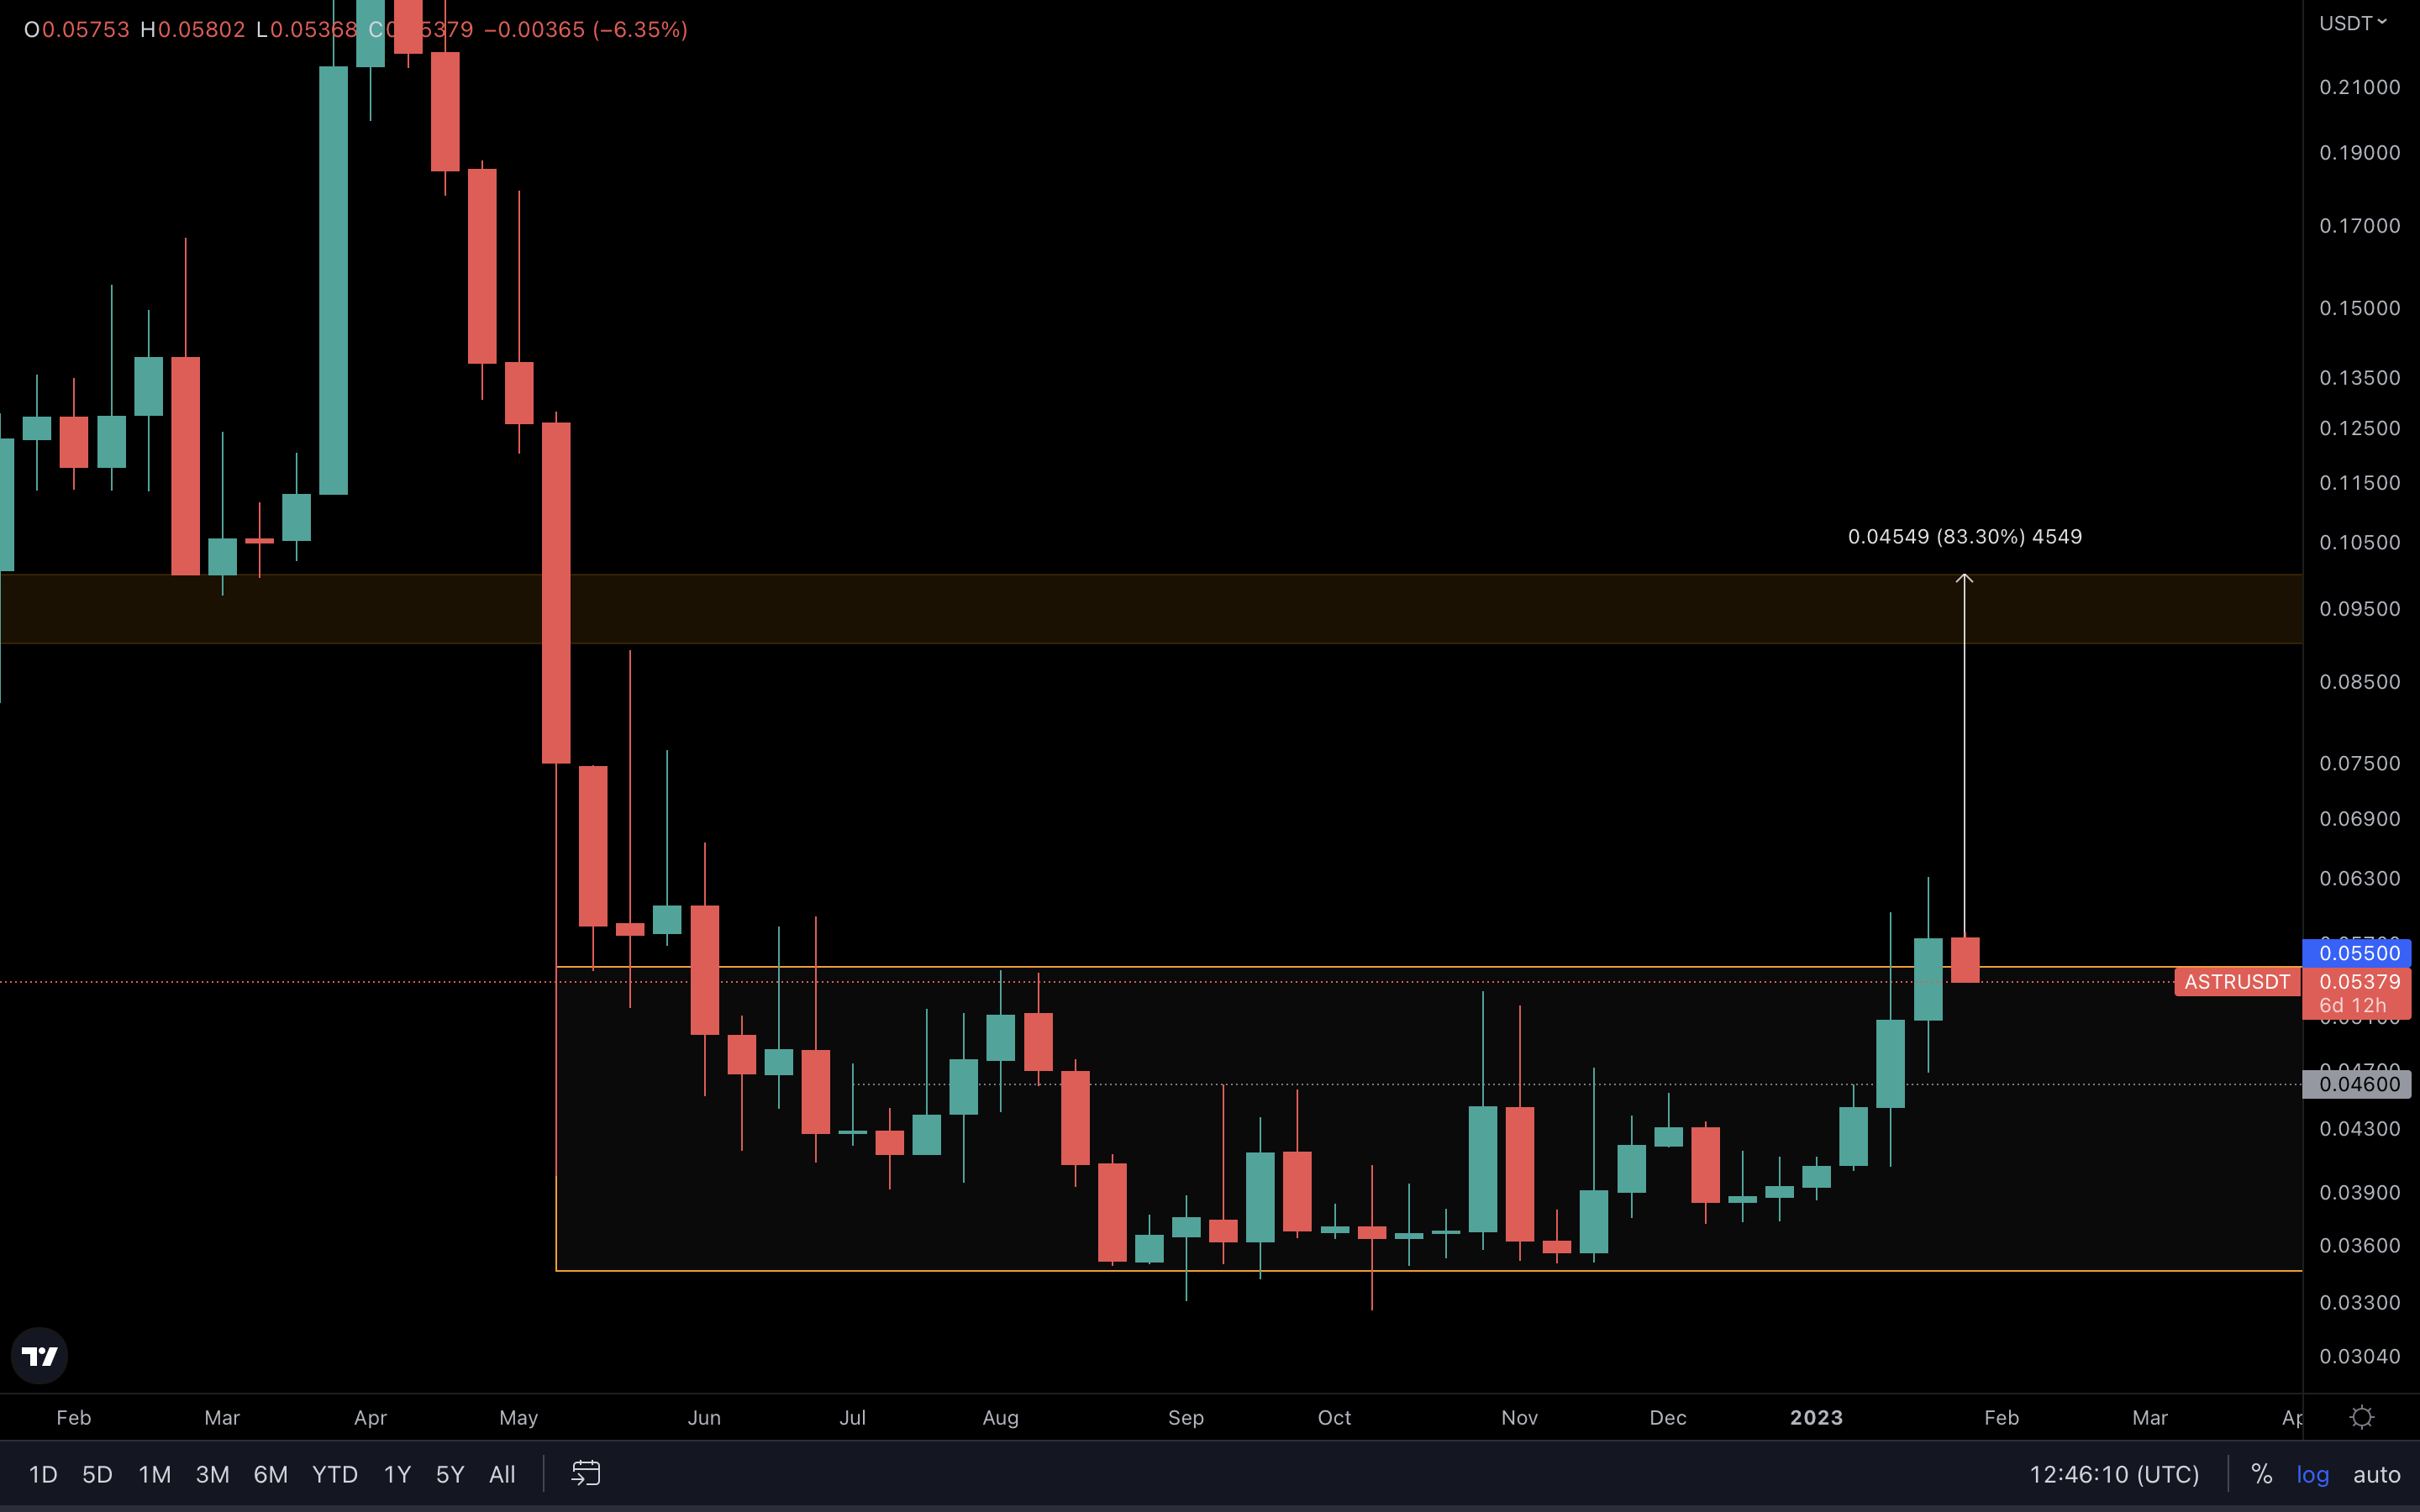
ASTR closed last week above the 7-month-old accumulation area. From a technical standpoint, we’re now on track for the next resistance area sitting between $0.09 and $0.10. That’s 60% - 80% away from $0.05500, the top of the accumulation area. Those are great returns if you ask us. An invalidation of this scenario would occur if ASTR closes back inside the orange box, which means we’d need to see a loss of $0.05500 as support to invalidate more upside.
THOR | THORSwap
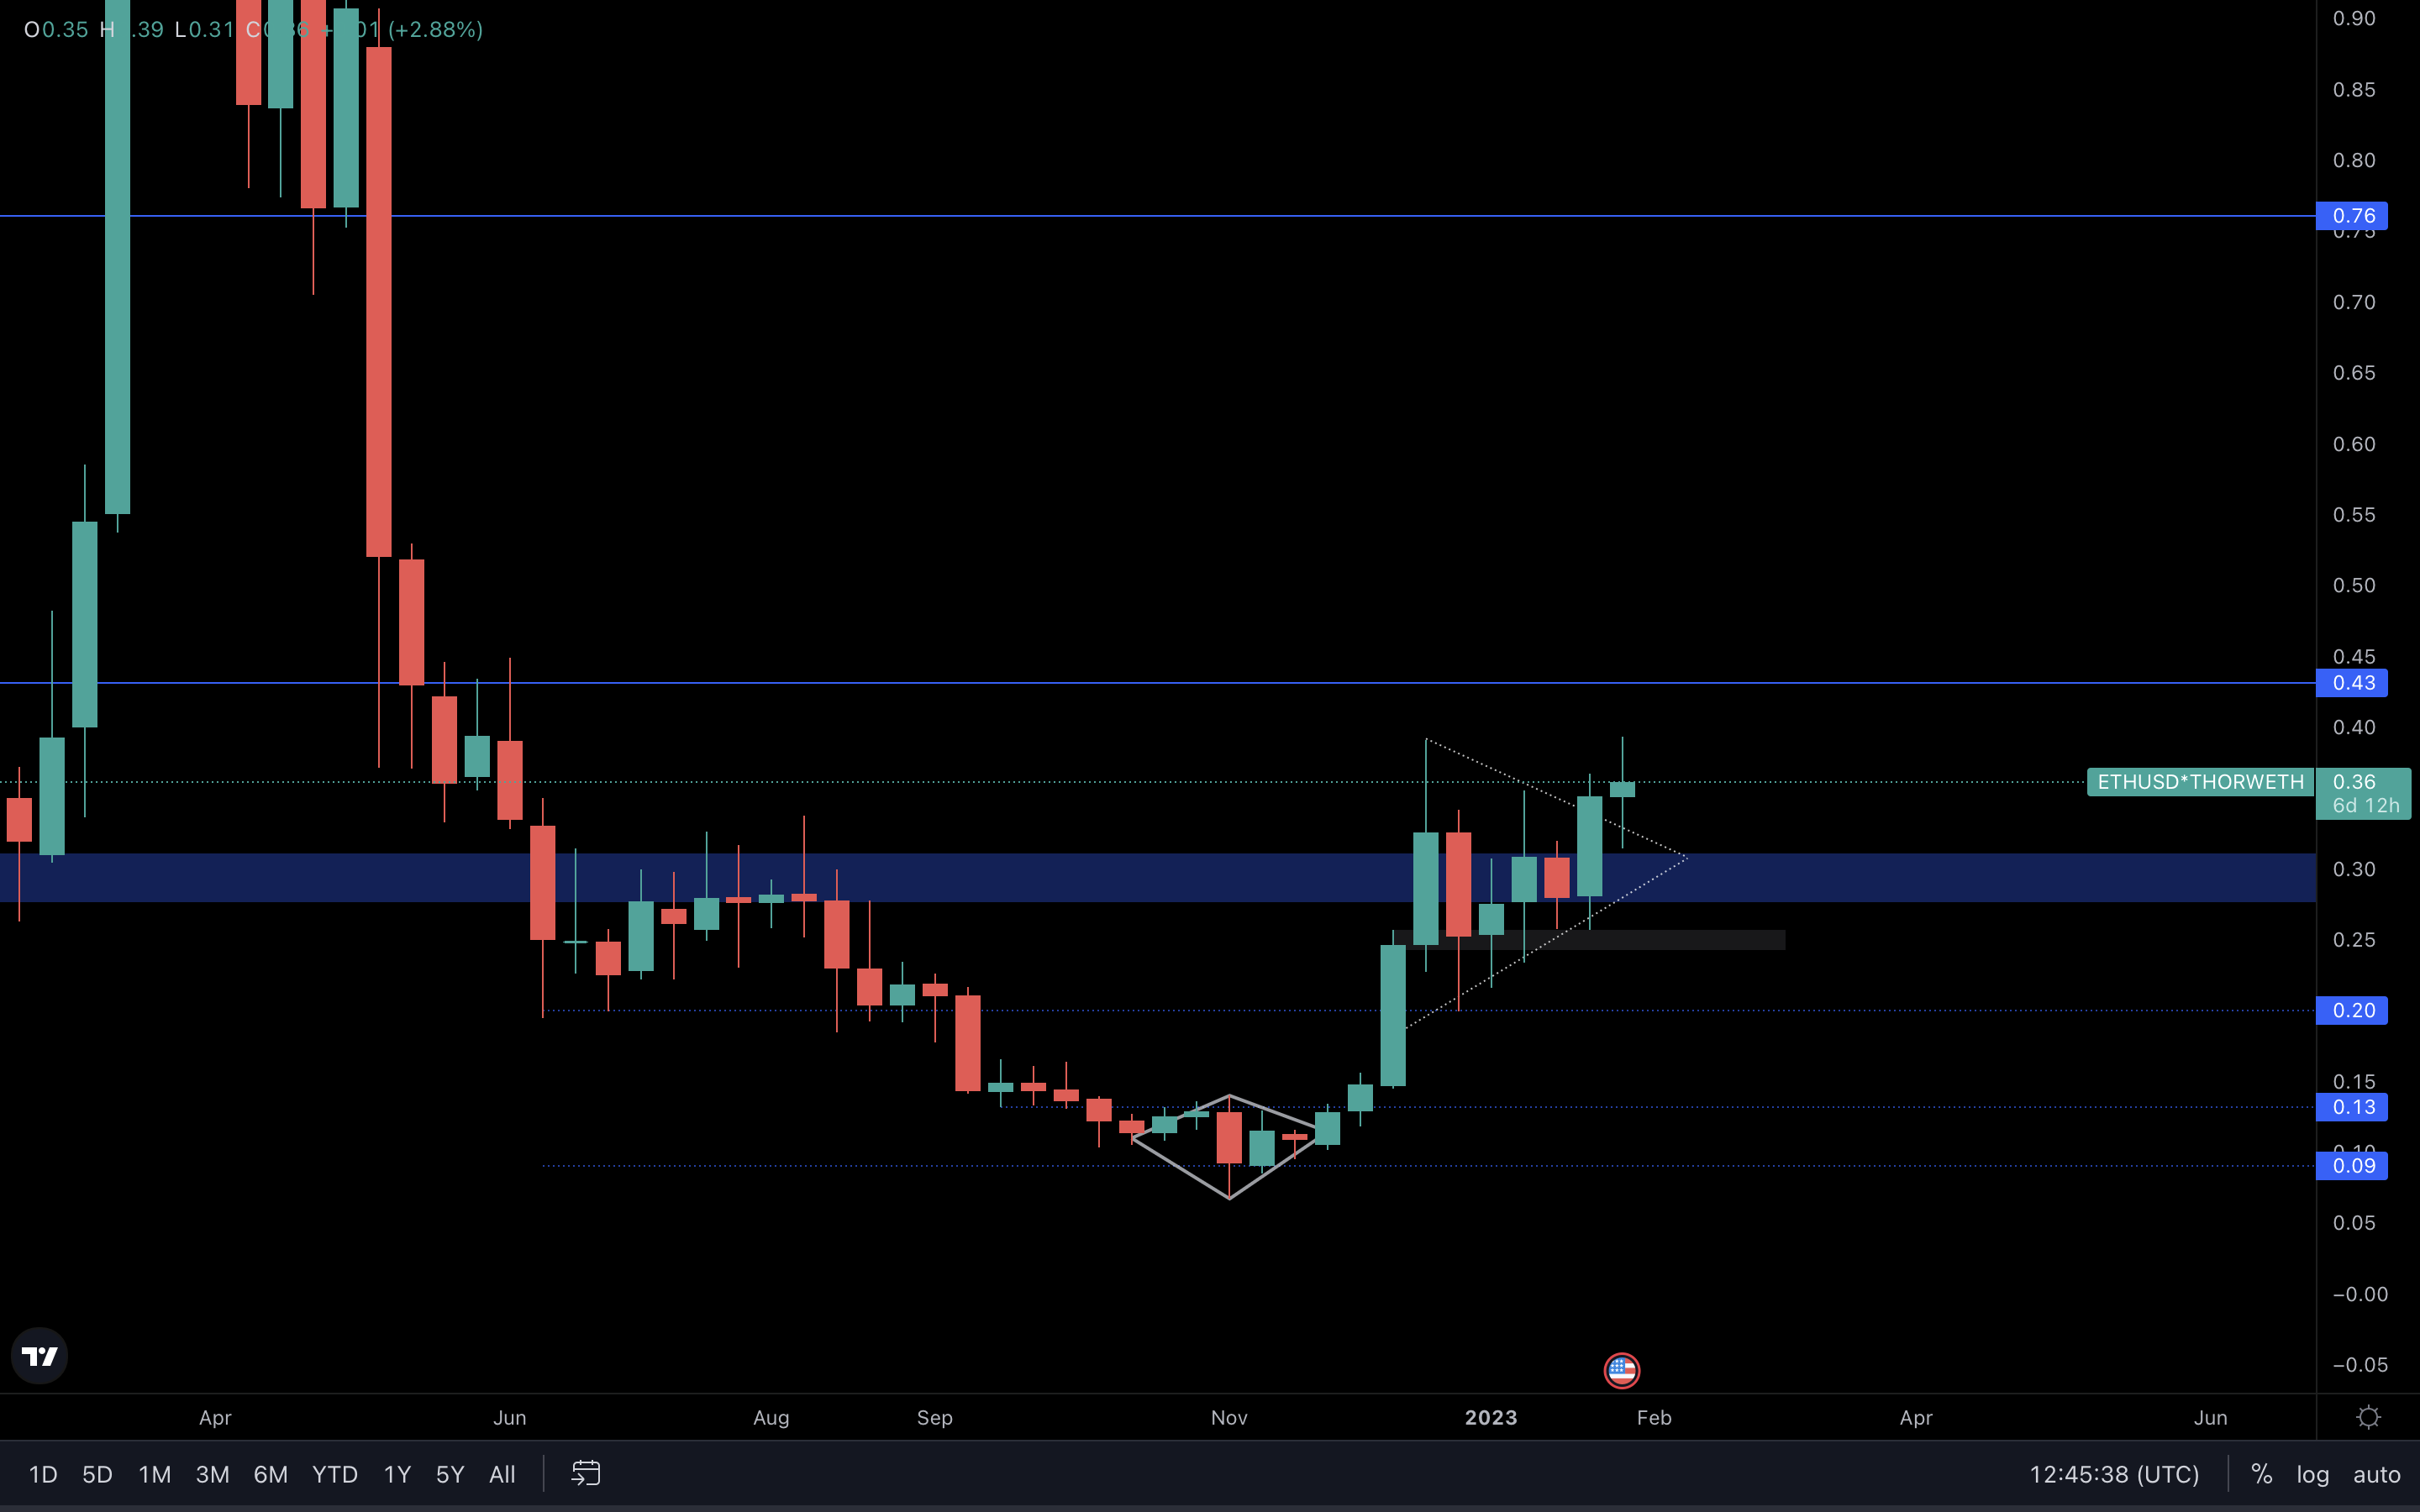
What you’re seeing on this chart is a lower timeframe symmetrical triangle, from which THOR broke out last week. We should now be expecting a move to $0.43. From its current price of $0.37, that’s a move of around 16%.
MINA | Mina Protocol
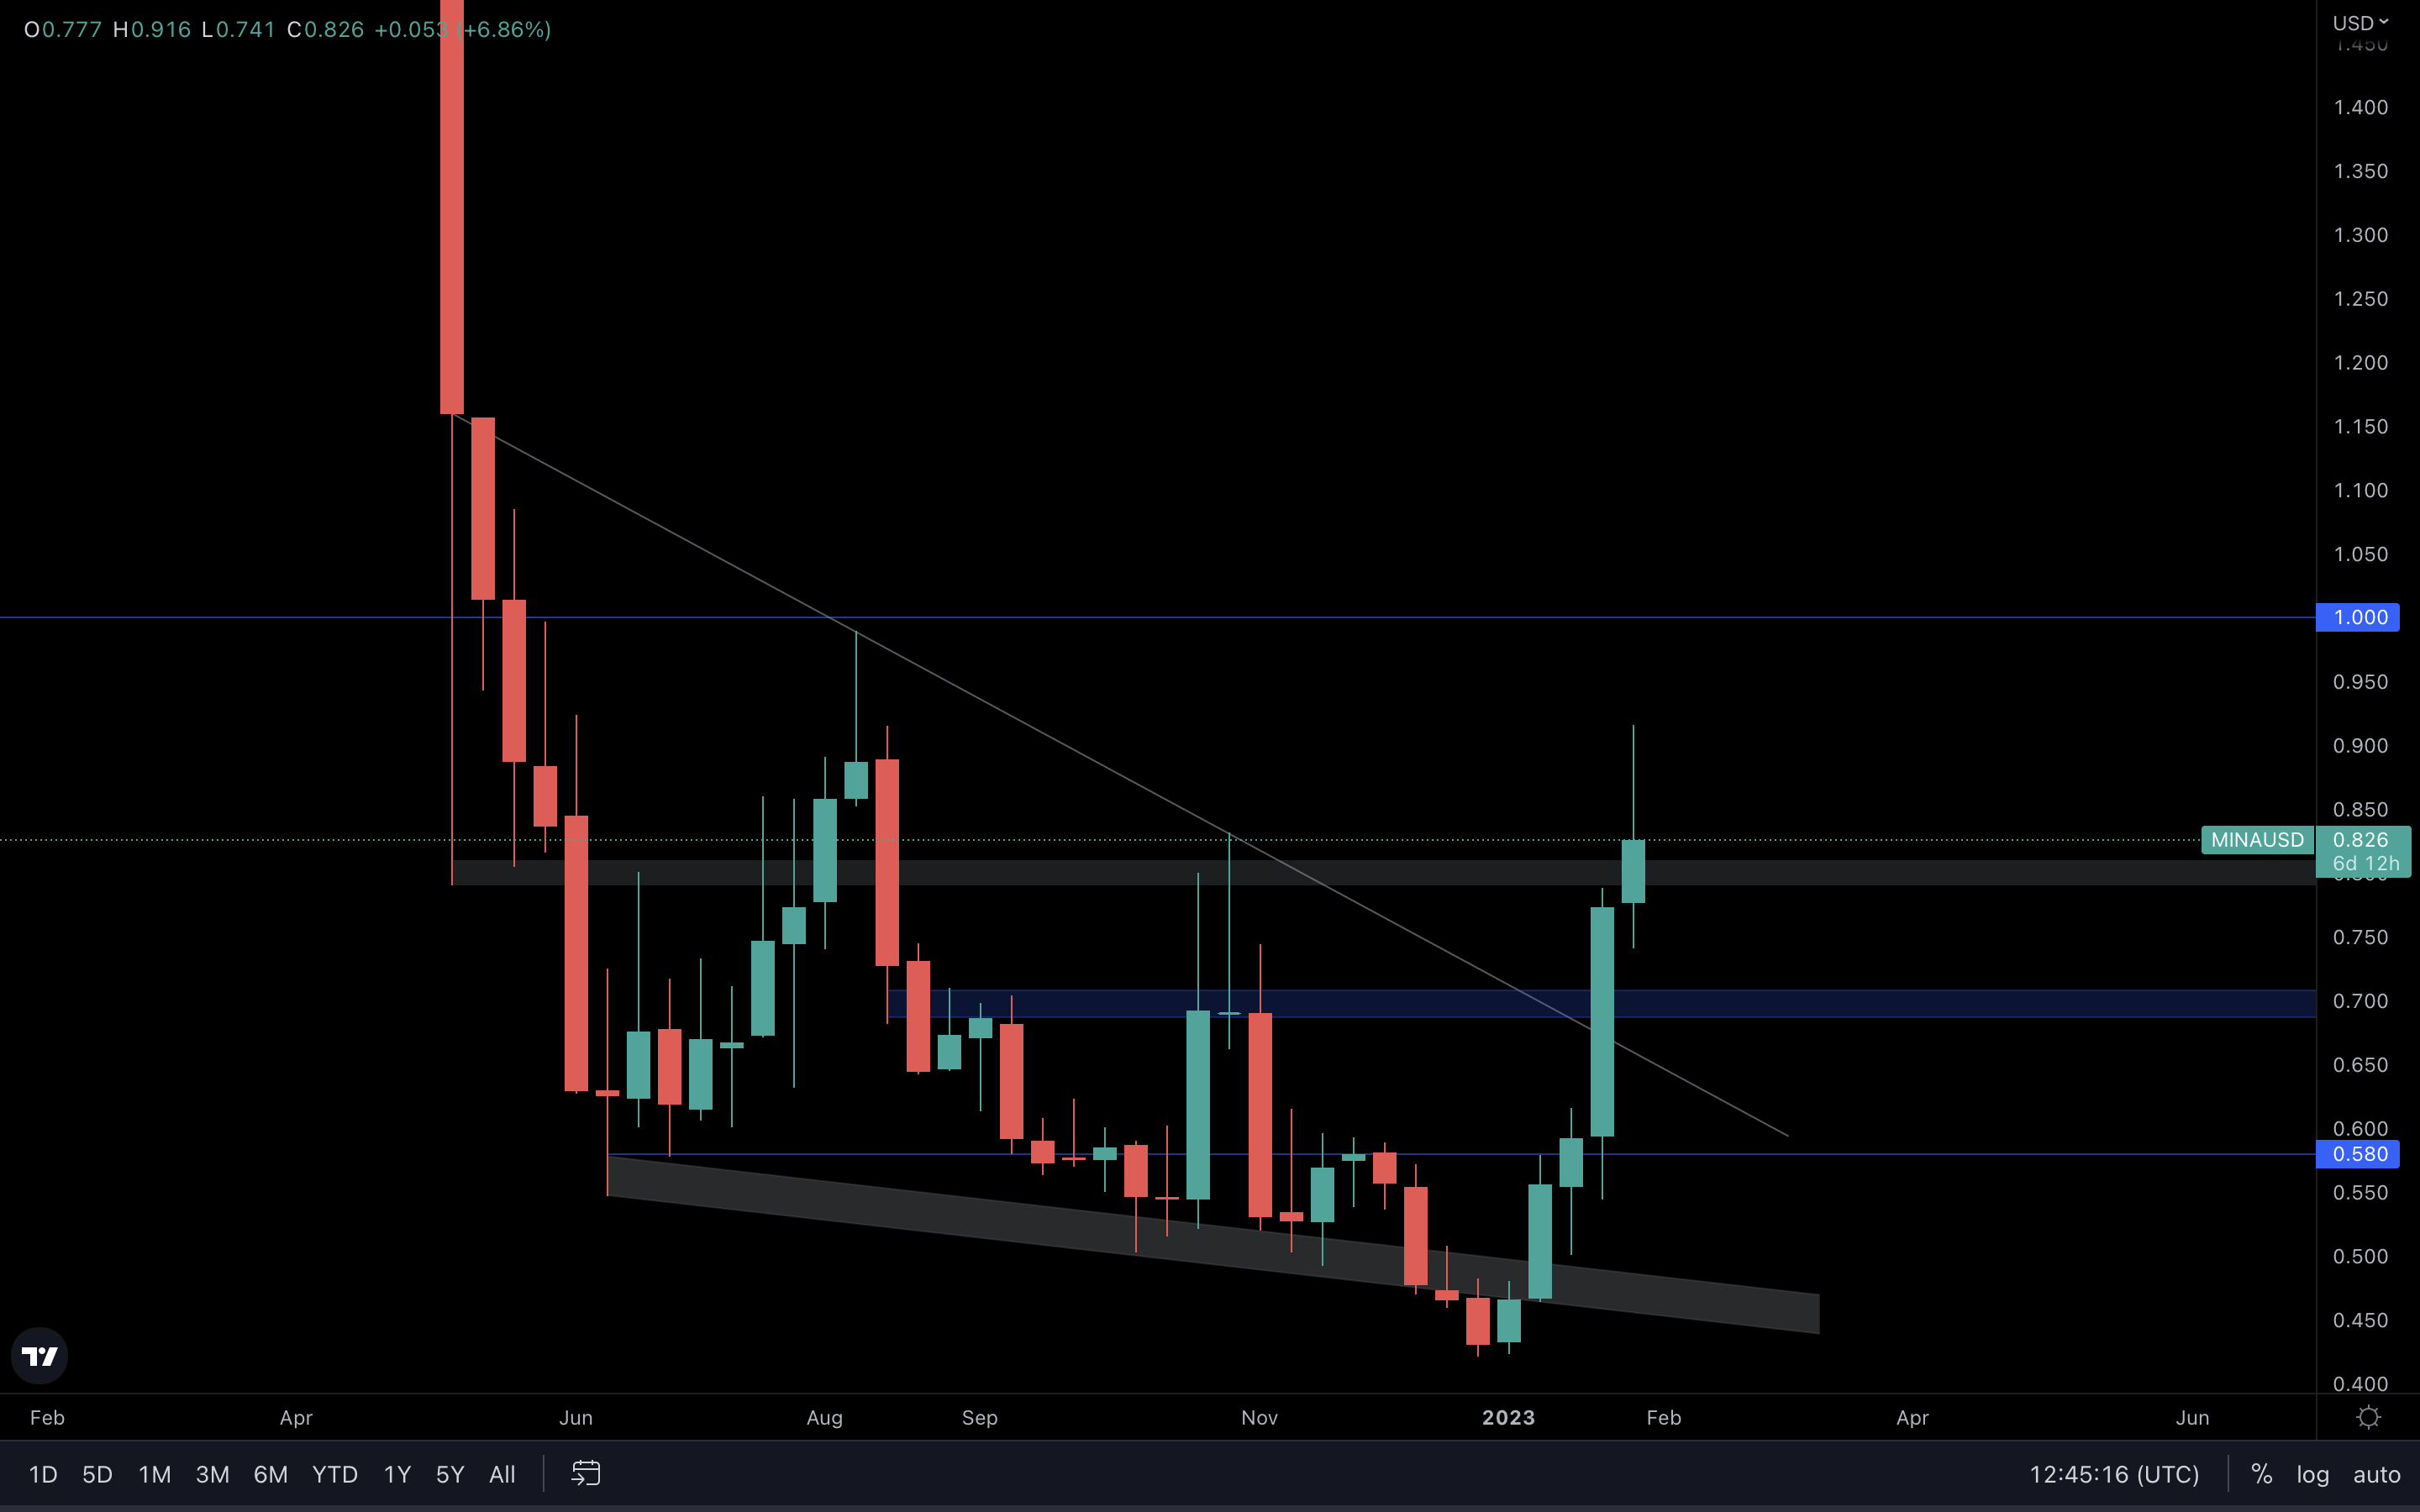
Insanely beautiful performance from MINA, last week was craaazy. $0.70 was reclaimed and turned into support last week, and now, we have a confirmed breakout from this falling wedge. The final target for the final wedge sits at $1, which MINA almost tested today. Not only did we see a weekly reclaim of $0.70, but we might be looking at a reclaim of the grey box ($0.79 - $0.81) on the daily timeframe. This would confirm upside toward $1. Honest opinion - this opportunity has already been exhausted. The risk/reward ratio is down a lot, and it isn’t as intriguing as before. A test of $1 is definitely possible, but we believe there are better opportunities out there (DYDX and SNX, for example).
Cryptonary’s take
With the Total Market Cap reaching resistance, the upcoming FOMC meeting and the fact that the market needs to catch a breath, we might be looking at a pullback in the short term. That doesn’t mean the rally is over. On the contrary, a pullback makes room for even more upside.
- Taking partial profits now is recommended, as the risk of a pullback has increased. This will leave room for lower entries if a pullback does occur.
- All eyes on DYDX & SNX. These are two opportunities we’re tracking at all times.
- If the market reacts well and continues to the upside after the FOMC meeting, expect Bitcoin to reach $25k next. This will increase the price of most altcoins as well.
Recommended from Cryptonary


