Save 23% ($351) & Get a Free 1-1 Call with our Team ⏰ : 0d 2h 59m 43s
Disclaimer: This is not financial or investment advice. You are responsible for any capital-related decisions you make, and only you are accountable for the results.
BTC:
- BTC's Open Interest remains high, although it has pulled back approximately 9% over the last week, as BTC has been in the range bound at $ 90k.
- BTC's Funding Rate has crept up over the last few days, now up to 0.035%. This is beginning to get somewhat elevated, and therefore, a pullback in price could catalyse a further pullback. For now, we're not too worried, but we're watching to see how this develops.

Technical analysis
- Price has held up really well in the mid $90k's, which continues to be a positive development.
- The price is also well above the more major horizontal support of $91,500. If the price were to break below $91,500, we'd expect $87k to be the next major support.
- Price is now also in a bullish pennant, as outlined by the borders. This has a bias to break out to the upside, with a target being between $100k - $105k, assuming huge sell orders don't move back in at the $100k level again.
- To the upside, it's $100k, which is the clear level for the price to clear above.
- The RSI has pulled back, having been substantially overbought, and now it's just shy of overbought territory at 63. This is positive.
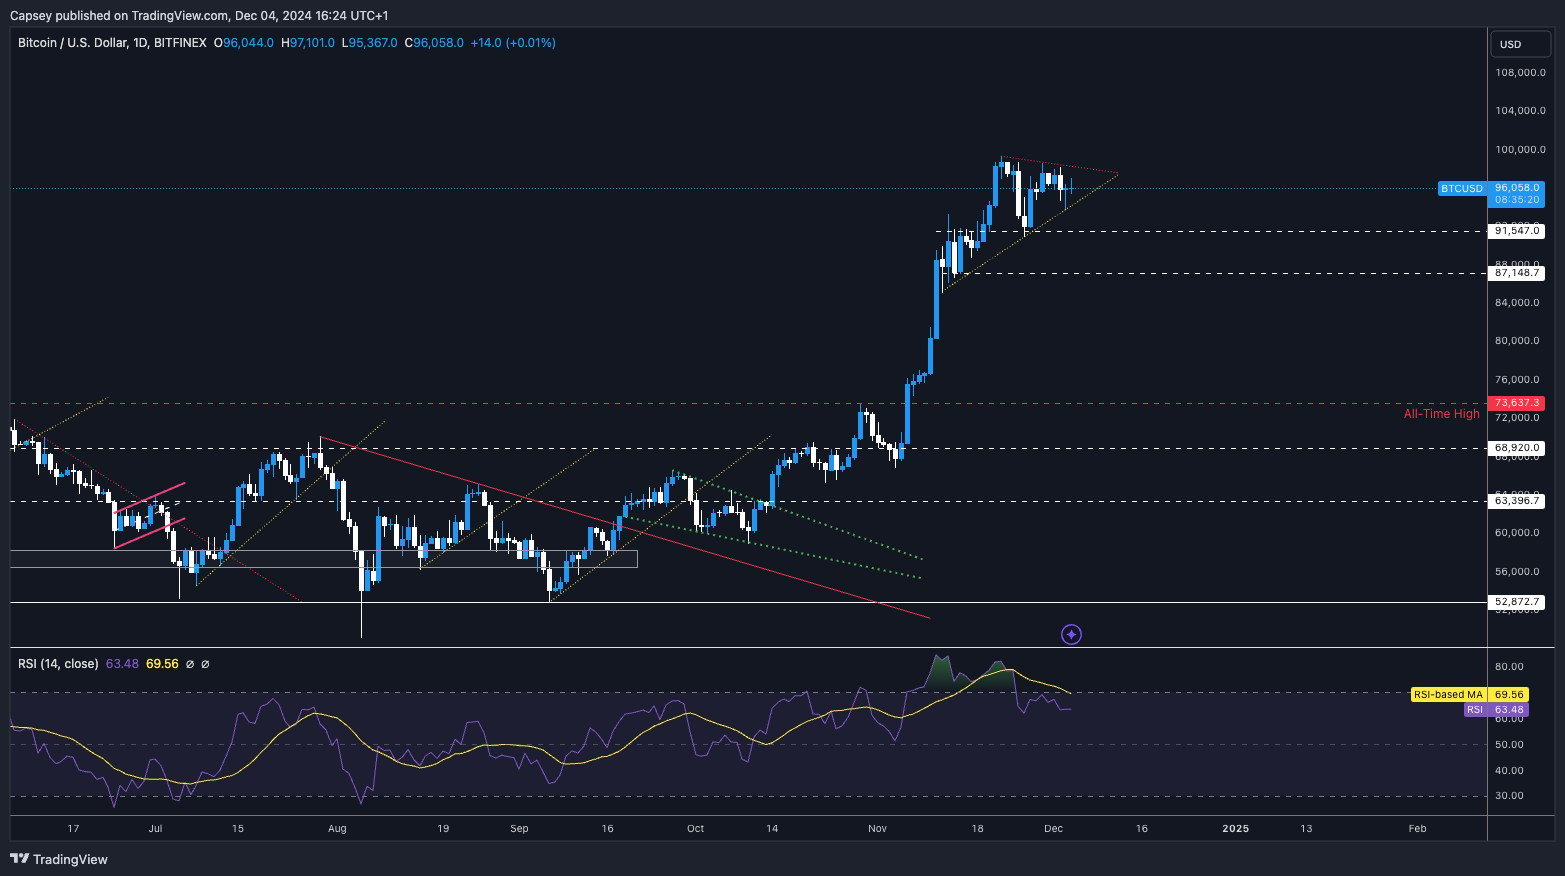
- Next Support: $91,500
- Next Resistance: $97,500
- Direction: Neutral/Bullish
- Upside Target: $100k to $105k
- Downside Target: $87,500
Cryptonary's take
At the start of the week, the thinking was that BTC might be range-bound for more time, and therefore, the range between $87k to $91k might be a possible downside target. However, over the last few days, we've seen strong Spot buying pressure, with price dips quickly and aggressively bought up.It's possible in the coming days, and due to the lack of breakdown for price, it's possible that we might be close to a break out to the upside. It's hard to judge here, as we also see it as possible that the price is range-bound for more time. We're bullish/neutral here.
ETH:
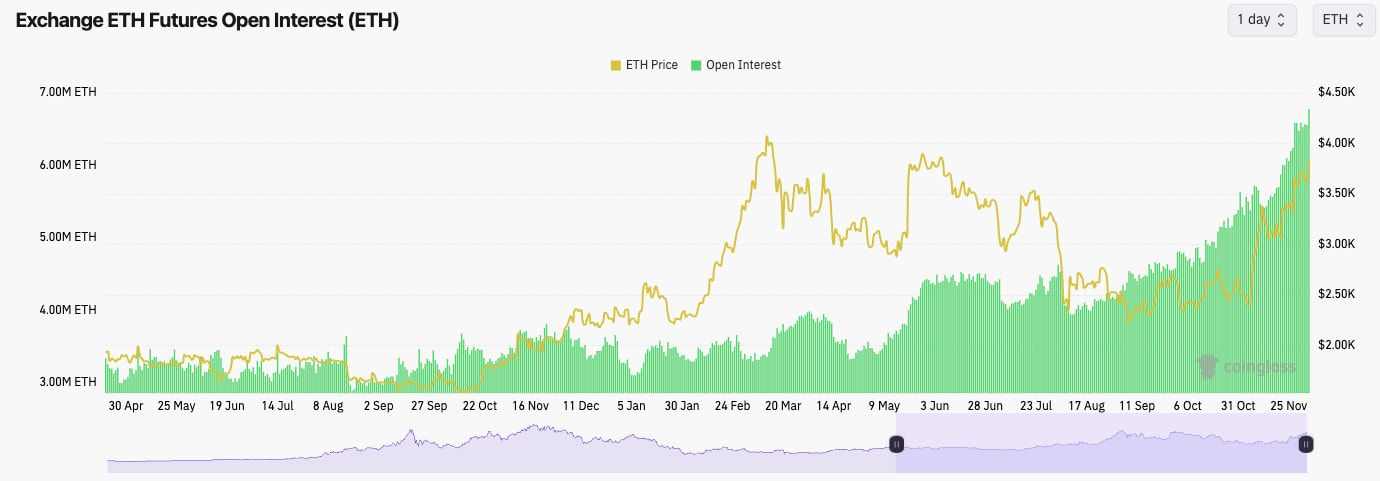
- ETH's Open Interest is on an absolute rip, on both the USD terms and the by the number of ETH. This is likely due to increased 'cash-and-carry' trades and more large players entering the ALT market following Trump's win.
- ETH's Funding Rate has also increased to 0.03%. Again, this is relatively elevated; however, we're not greatly concerned about it in the immediate term.
Technical analysis
- It was just a really clean move up to nearly $4,000, which we have called for perfectly over the last few weeks.
- Price has managed to find support and held key horizontal levels before moving higher. First, it was $3,000, then $3,280, then $3,480, and now it's a straight move to $4k.
- To the downside, we'd expect $3,550 to $3,700 to be a strong support zone for ETH.
- For now, ETH is moving in a nice uptrend, and it's possible that, at an approach of $4,000, there might be significant psychological resistance for ETH.
- The RSI is also grinding higher into overbought territory. If ETH approaches $4,000 and struggles to have a smooth break out above that level, we might see a short-term overbought pullback.
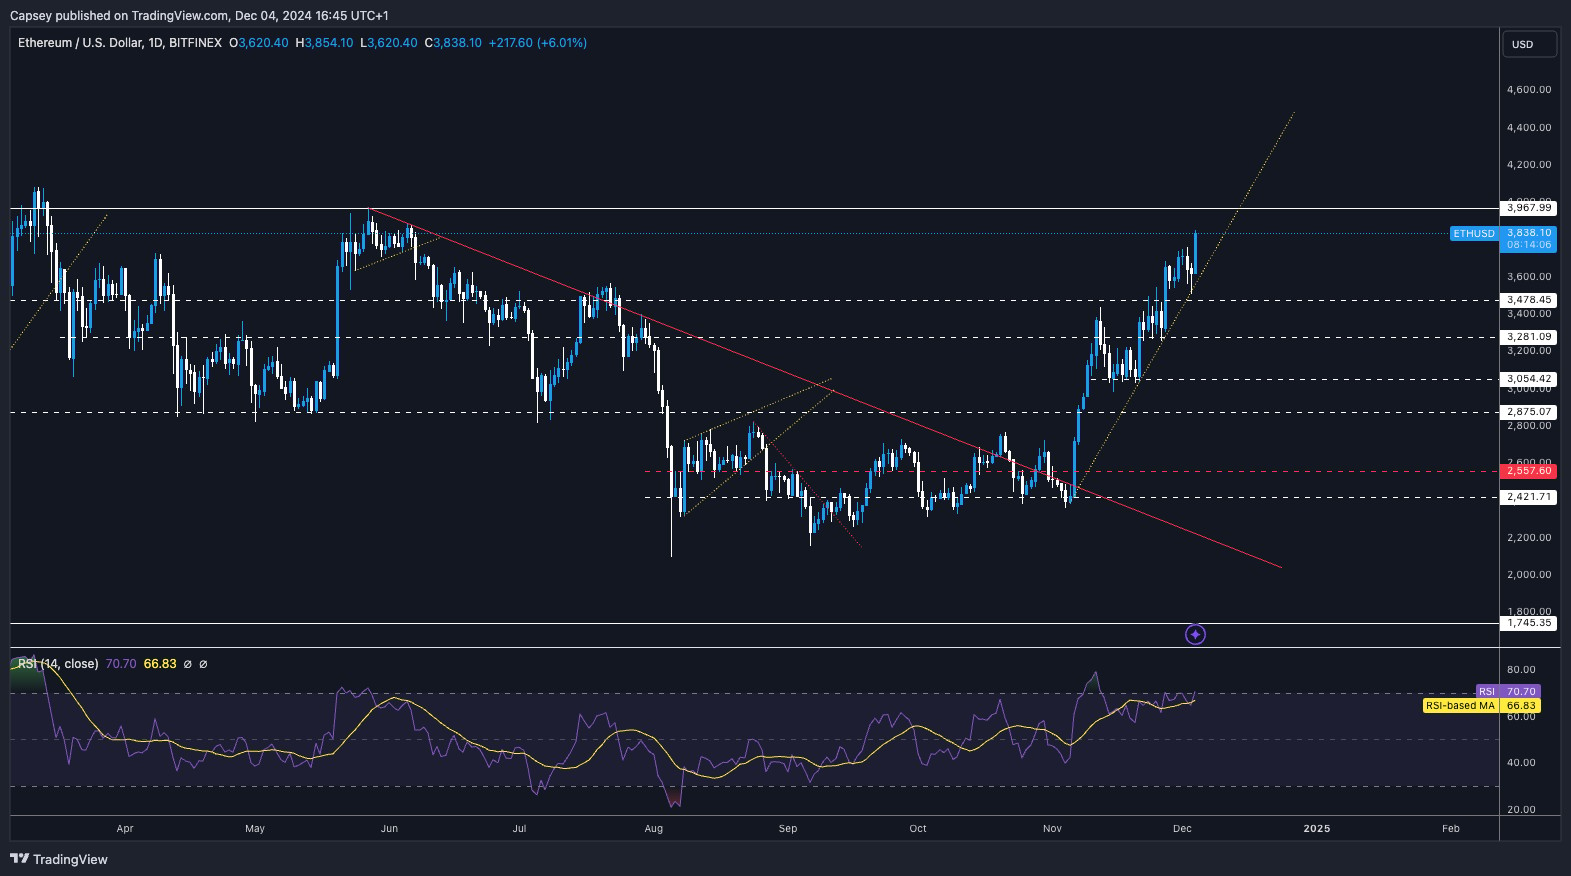
- Next Support: $3,700
- Next Resistance: $4,000
- Direction: Bullish
- Upside Target: $4,000
- Downside Target: $3,480
Cryptonary's take
ETH is one we've got really spot on over the last few weeks, having perfectly called for the move up from the lows around $2,300 to $2,500. ETH is now approaching the short-term target of $4,000. While it's possible we will see a major break out of that level, it's also possible that we will see ETH stall in the short term at the $4,000 mark. If that then generates a small pullback, a retest of $3,700 might be a good place for a new entry.SOL:
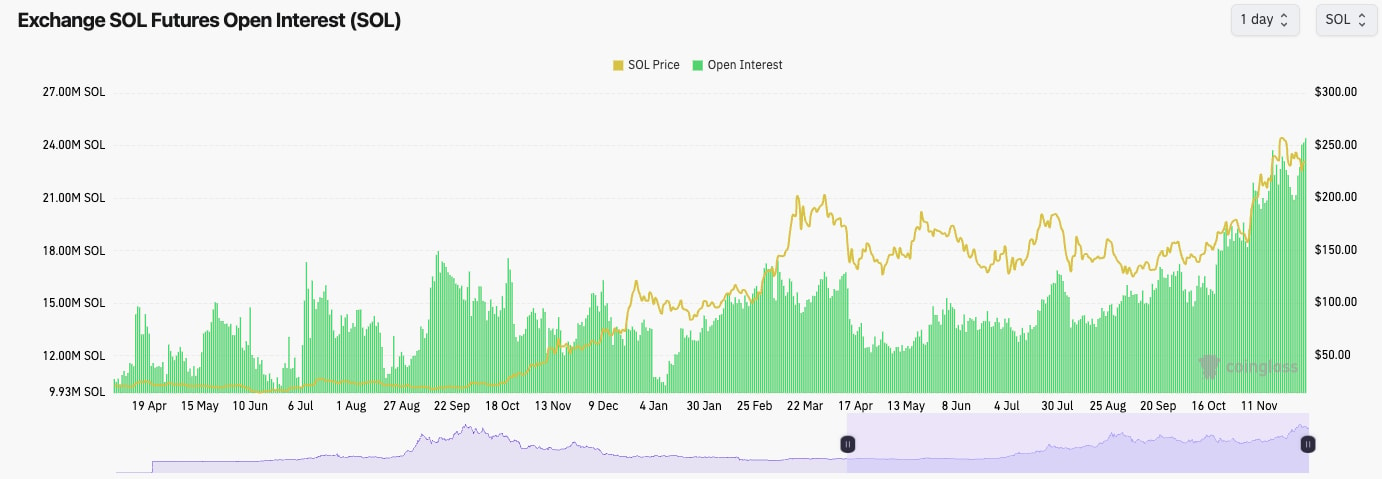
- SOL's Open Interest has increased by north of 20% over the last 3-5 days.
- SOL's Funding Rate is also at high levels, close to 0.06%. This means there's a strong bias amongst traders to be Long here, and with Open Interest where it is, SOL is becoming more vulnerable to a potential flush-out.
- Price can perform with Funding Rates at these levels, but it would be a warning sign to us if Funding Rates spiked much further from here.
Technical analysis
- From a TA perspective, SOL is showing a different story - a bullish setup.
- SOL is currently forming a descending wedge that would have a break-out target to the upside, with a target of $290 - $300.
- Price is also holding nicely above major horizontal support at $220 with there being a large support range beneath that down to $200.
- On the upside, $250 to $260 remains the price resistance zone.
- Another positive point with regards to SOL's price pulling back from the highs here is that the RSI has pulled back substantially and is now in the middle territory, nowhere near being overbought.

- Next Support: $220
- Next Resistance: $260
- Direction: Bullish
- Upside Target: $260
- Downside Target: $220
Cryptonary's take
From a mechanics perspective, SOL does look overheated here. But the TA setup is great/bullish, and the narrative and momentum continue to be positive.We expect SOL to hold above $220, but if there is a drop below, we expect it to be aggressively bought up, especially if this kind of move sees small leverage flush out. We're looking for SOL to move higher in the coming week/weeks, although in the immediate term, we're expecting more range-bound price action.
WIF:
- WIF has remained range-bound for a few weeks now between the support, grey box ($2.84 and $2.97) and the resistance of $3.40.
- Between $2.55 and $2.97, there are large supports, and we expect WIF to be aggressively bid below $3.00.
- A break above $3.40 would be the signal to us that WIF is breaking out, and from there, a swift move up to $4.30 is possible.
- With price being range bound and subdued for a number of weeks, this has allowed the RSI to meaningfully reset, and now it sits in the middle territory and nowhere near overbought.

- Next Support: $3.00
- Next Resistance: $3.40
- Direction: Neutral
- Upside Target: $3.40 (then $4.00)
- Downside Target: $3.00
Cryptonary's take
We fully expect once WIF breaks out to the upside, that we will see explosive action higher. That key level, we believe, is a clean break of $3.40. For now on WIF, we'll continue to just monitor the levels. We're not expecting any major breakdown, but if we were to see a move below $3.00, we expect bidders to come in. So, essentially, in the short-term, this is a waiting game whilst we expect price to just continue to be range-bound.POPCAT:
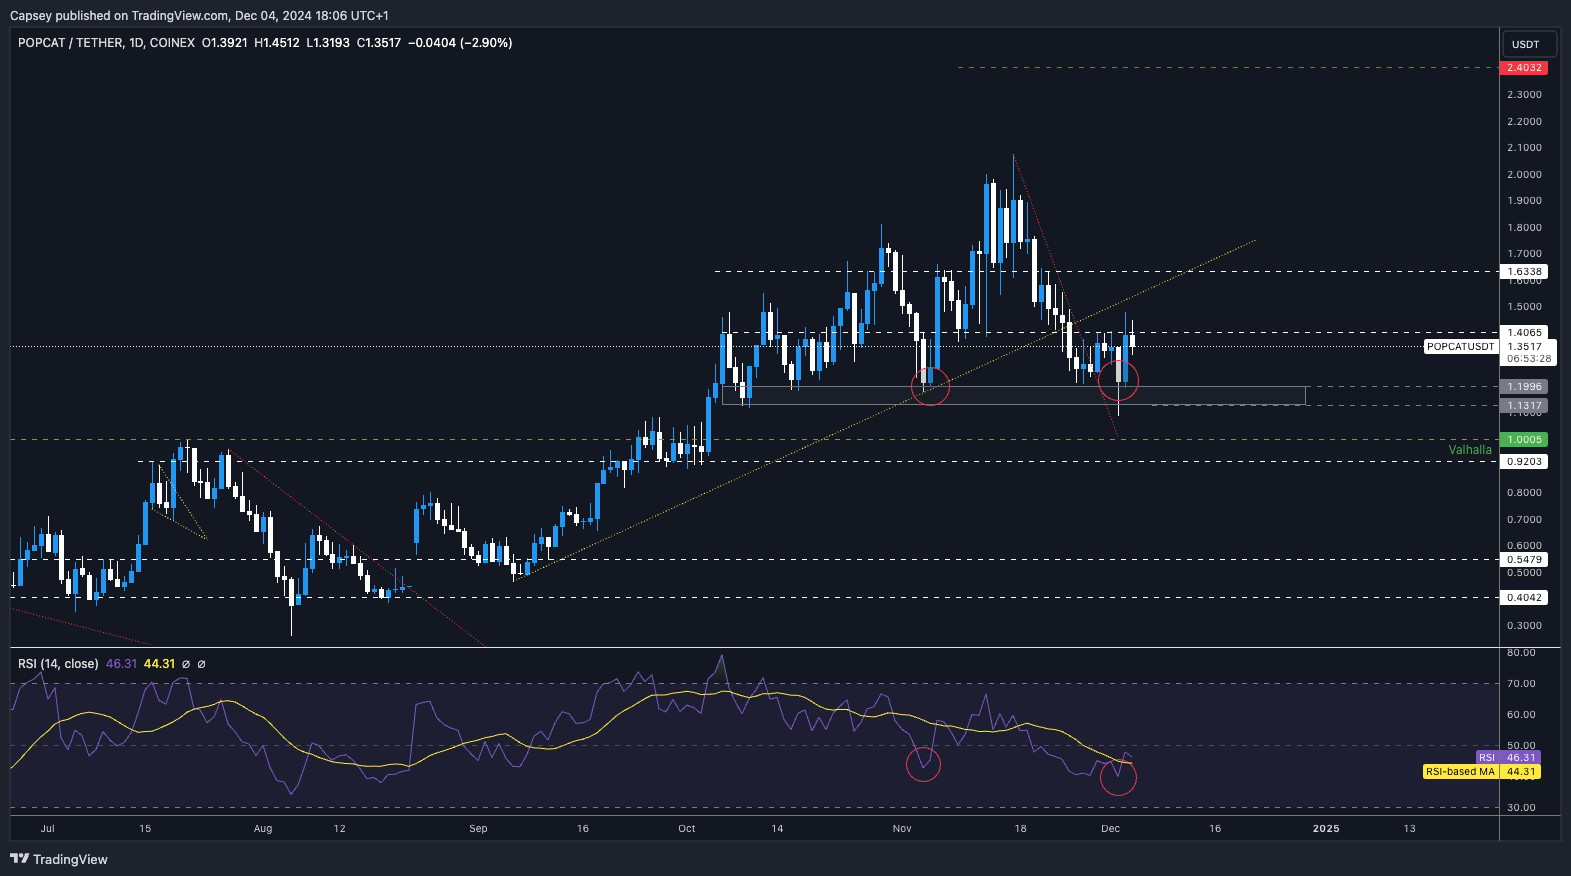
- It's a really tricky price action for POPCAT recently, having been in a more meaningful downtrend, with POP not really having experienced one of these for a while.
- Price found support in the grey box between $1.13 and $1.19 and has now moved back up to retest the old support of $1.40 as new resistance, and the price is currently looking as if it's rejecting there.
- POPCAT remains out of its main uptrend line and is now also below both key levels of $1.40 and then $1.60.
- However, we do still have the hidden bullish divergence (lower low on the oscillator and a higher low in price) in play, which may help drive a stronger bounce for price.
- The RSI is also now in the middle to the low territory at 46, so there is an upside to be had. But there is still room for a downside also.
- Next Support: $1.20
- Next Resistance: $1.40
- Direction: Neutral
- Upside Target: $1.40 (then $1.60)
- Downside Target: $1.20
Cryptonary's take
POPCAT also looks to be range-bound here between $1.20 and $1.40, and although the TA isn't very bullish here, we do have a hidden bullish divergence in play. Alongside this, the ALT and Meme market does seem to be recovering slightly, so if POPCAT is going to see a more substantial upside in the immediate term, it's likely going to be due to being dragged up by the rest of the market.It's also possible that POP does remain range-bound in the immediate term, though, between $1.20 and $1.40. We continue to hold Spot bags despite this being somewhat of a more uncomfortable hold recently.
SPX:
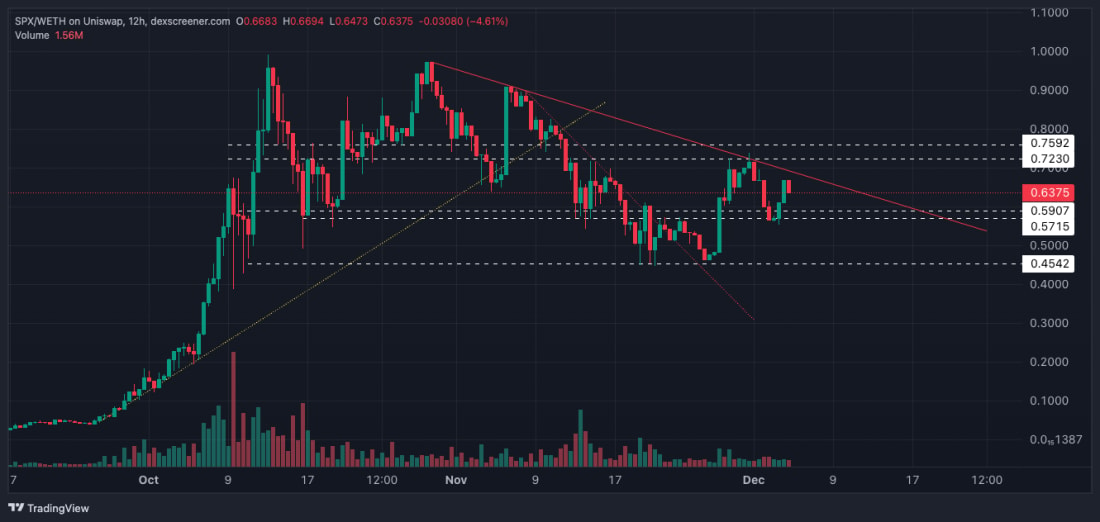
- SPX is looking interesting from a TA perspective here.
- The key zone of support for SPX is between $0.57 and $0.60, the price of which is now above, and the price also used this level as support on the first pullback.
- The resistance area for the price is between $0.72 and $0.75, but the price is now also contending with the main downtrend line as a resistance.
- If the price can clear above the main red downtrend line and the horizontal resistance of $0.75, then a retest of the highs is likely on the cards following that more major breakout.
- Volumes were downtrending. However, they have now stabilised, so that's positive.
- Next Support: $0.60
- Next Resistance: $0.75
- Direction: Neutral
- Upside Target: $0.75 (then $1.00)
- Downside Target: $0.57
Cryptonary's take
Like most major memes here, the price is range-bound between two key levels/zones of support and resistance. We fully expect the memes to break out meaningfully to the upside, but we expect that this may take more time. Therefore, in the immediate term, we're expecting a continuation of the price being range-bound. We expect $0.60 will be supported in the short-term for SPX, and then we'd like to see a turn and a break out to the upside above the main downtrend line.Recommended from Cryptonary


