Save 23% ($351) & Get a Free 1-1 Call with our Team ⏰ : 0d 2h 59m 43s
Crypto on a rampage | March 20th
Last week, the market showed us why you DO NOT WANT to bet against market structure. The market reached levels that haven’t been tested in +9 months, and saw a huge increase in volumes. But, we’re here to tell you that there could be even more upside in store.
In this week’s report, we dissect the charts to understand what comes next for the crypto market.
Friends, let’s dive in!
TLDR
- The Total Market Cap and Bitcoin are approaching their first resistance levels ($1.18T and $28,750, respectively). Securing some profits is recommended.
- After closing above $1740 last week, Ether is now on track for $2000.
- RUNE closed above resistance ($1.43), which puts $1.67 on the cards (~14% away from its current price).
- DYDX closed the week above $2.50. This opens the the door for $4.
- PENDLE’s spree isn’t stopping. Expect it to reach $0.52 in the coming weeks.
- SYN closed under resistance ($1.10). For upside to be confirmed, a weekly closure above $1.10 is needed.
- HEGIC successfully bounced from support, marking a weekly higher low. It’s now heading to $0.02725 (~30% away from current price).
- ASTR closed as a bullish engulfing candle last week. The next resistance level of $0.082 will be tested in the coming weeks.
- MINA closed a bullish engulfing candle, putting it on track for $1.
Disclaimer: Not financial or investment advice. You are responsible for any capital-related decisions you make, and only you are accountable for the results.
Total Market Cap (Weekly)
The Total Market Cap index represents the entire cryptocurrency market valuation. We track this index to understand where the market is now and to predict where it will likely go next.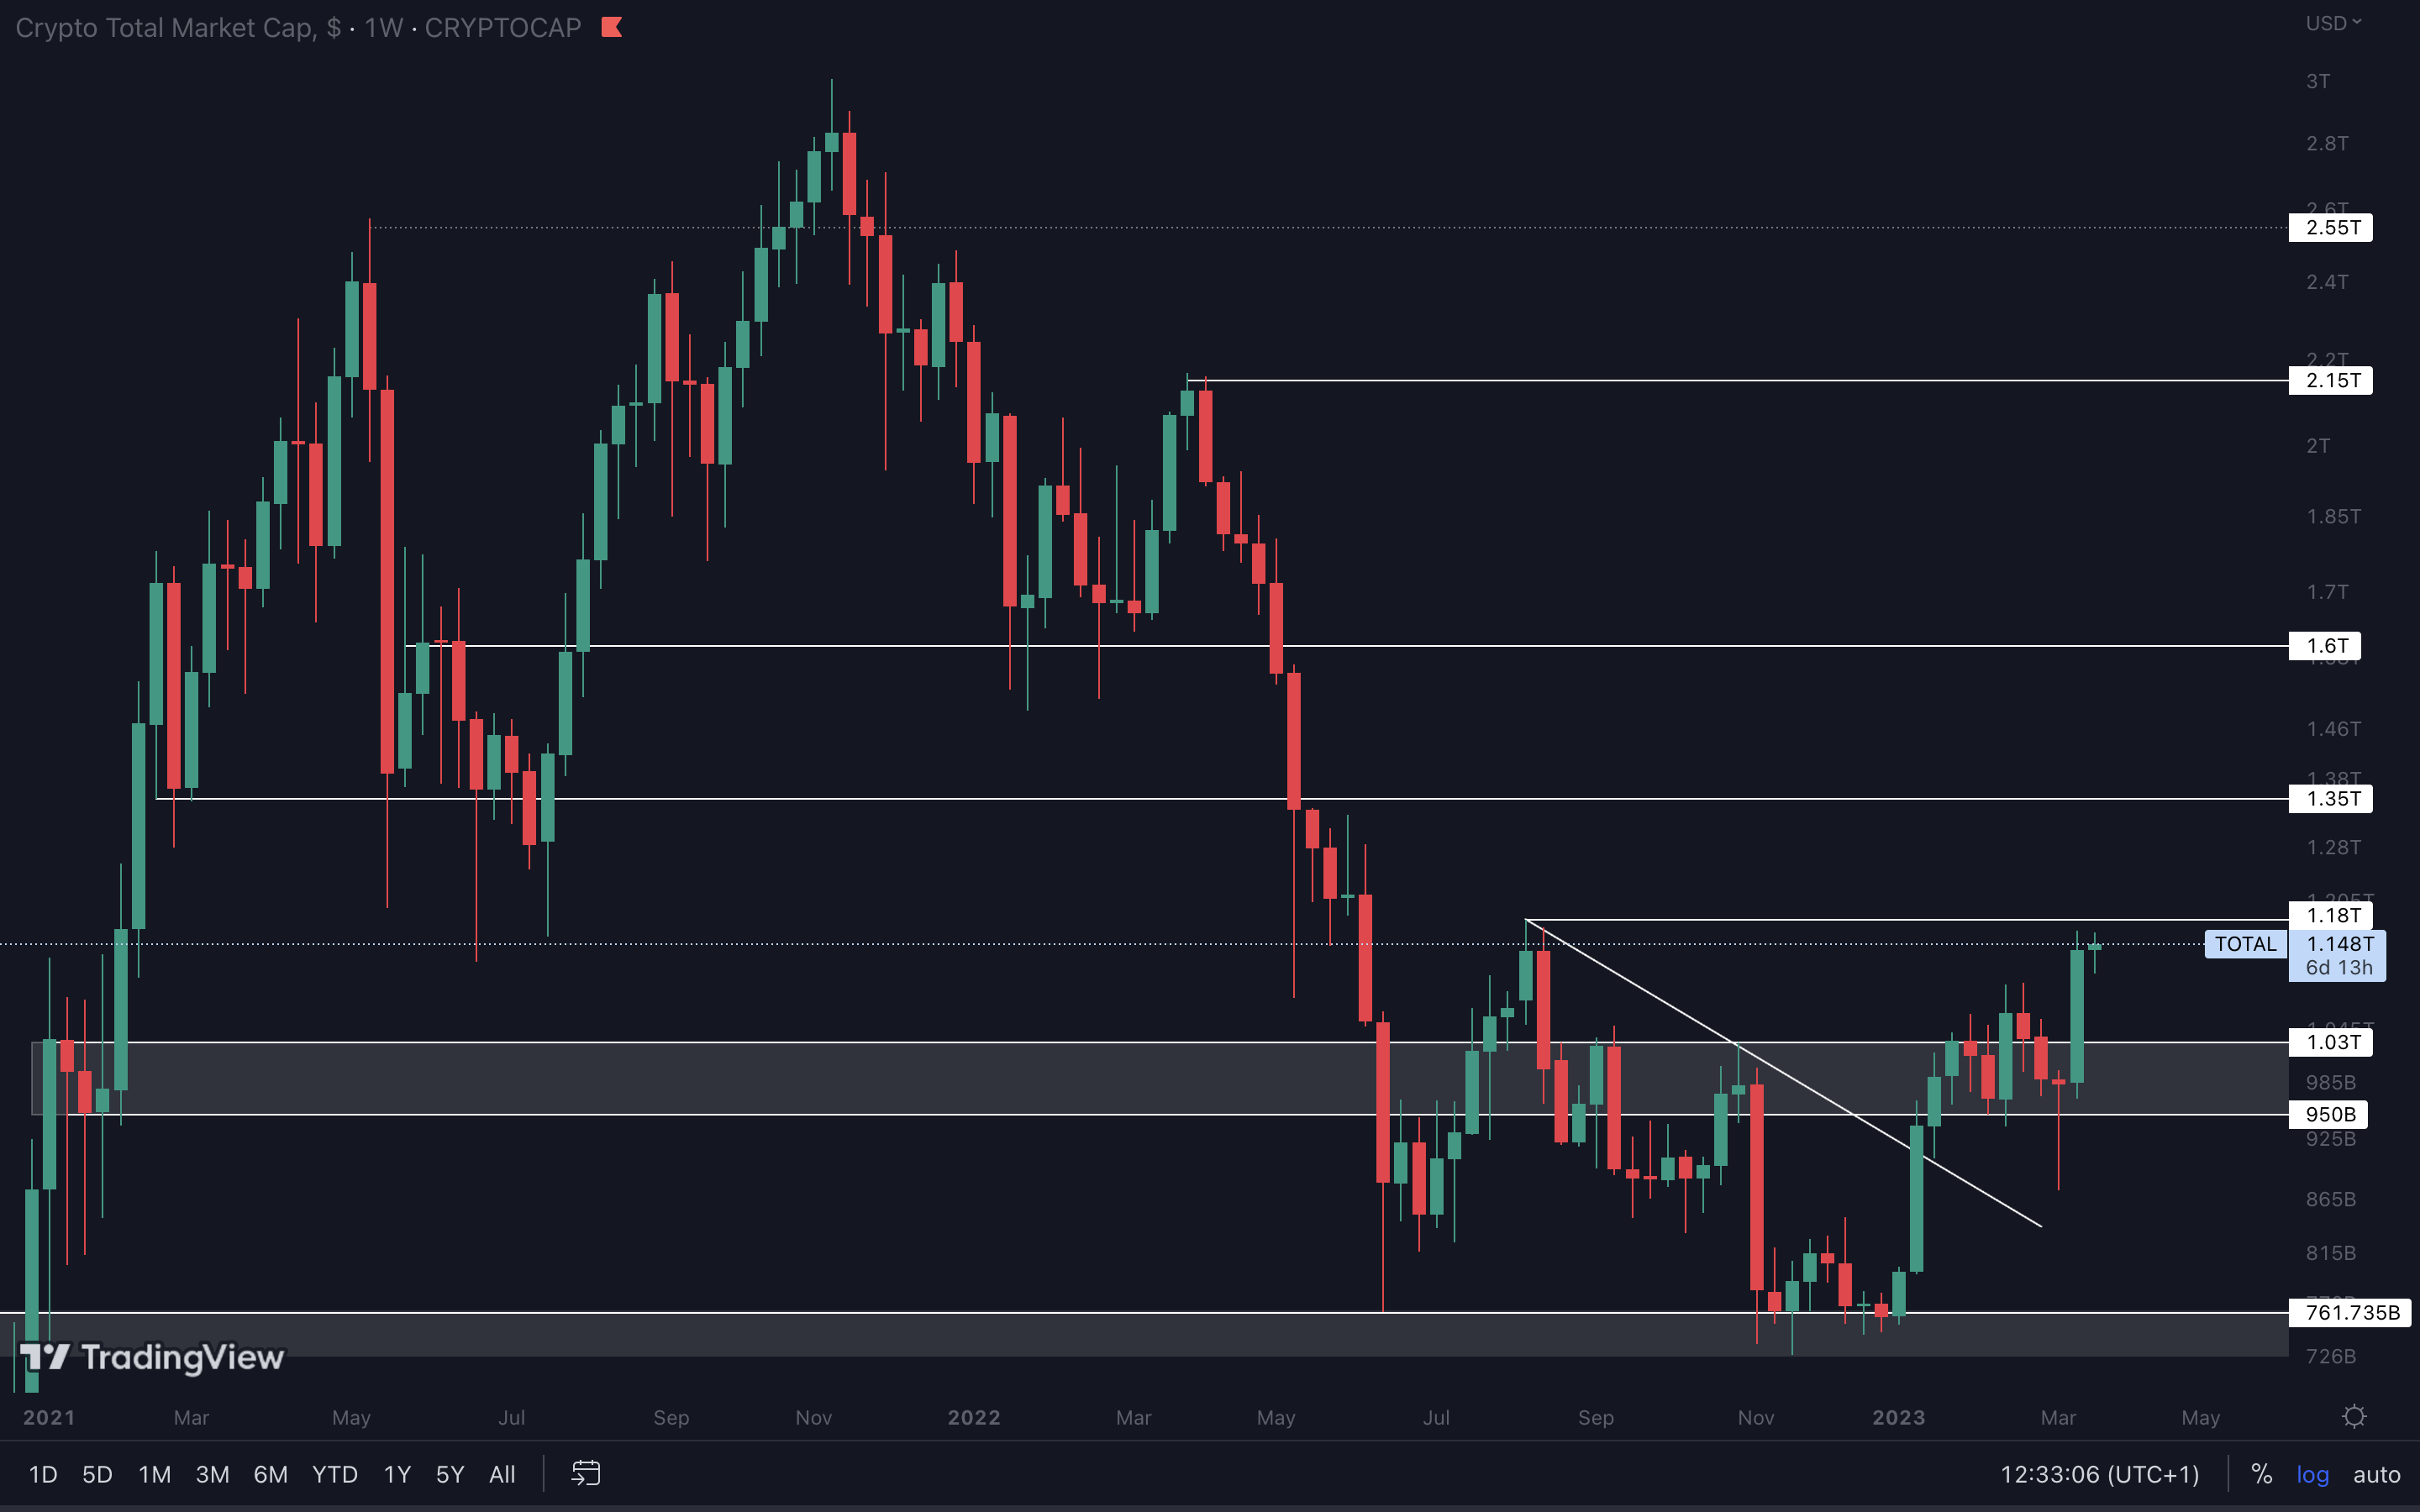
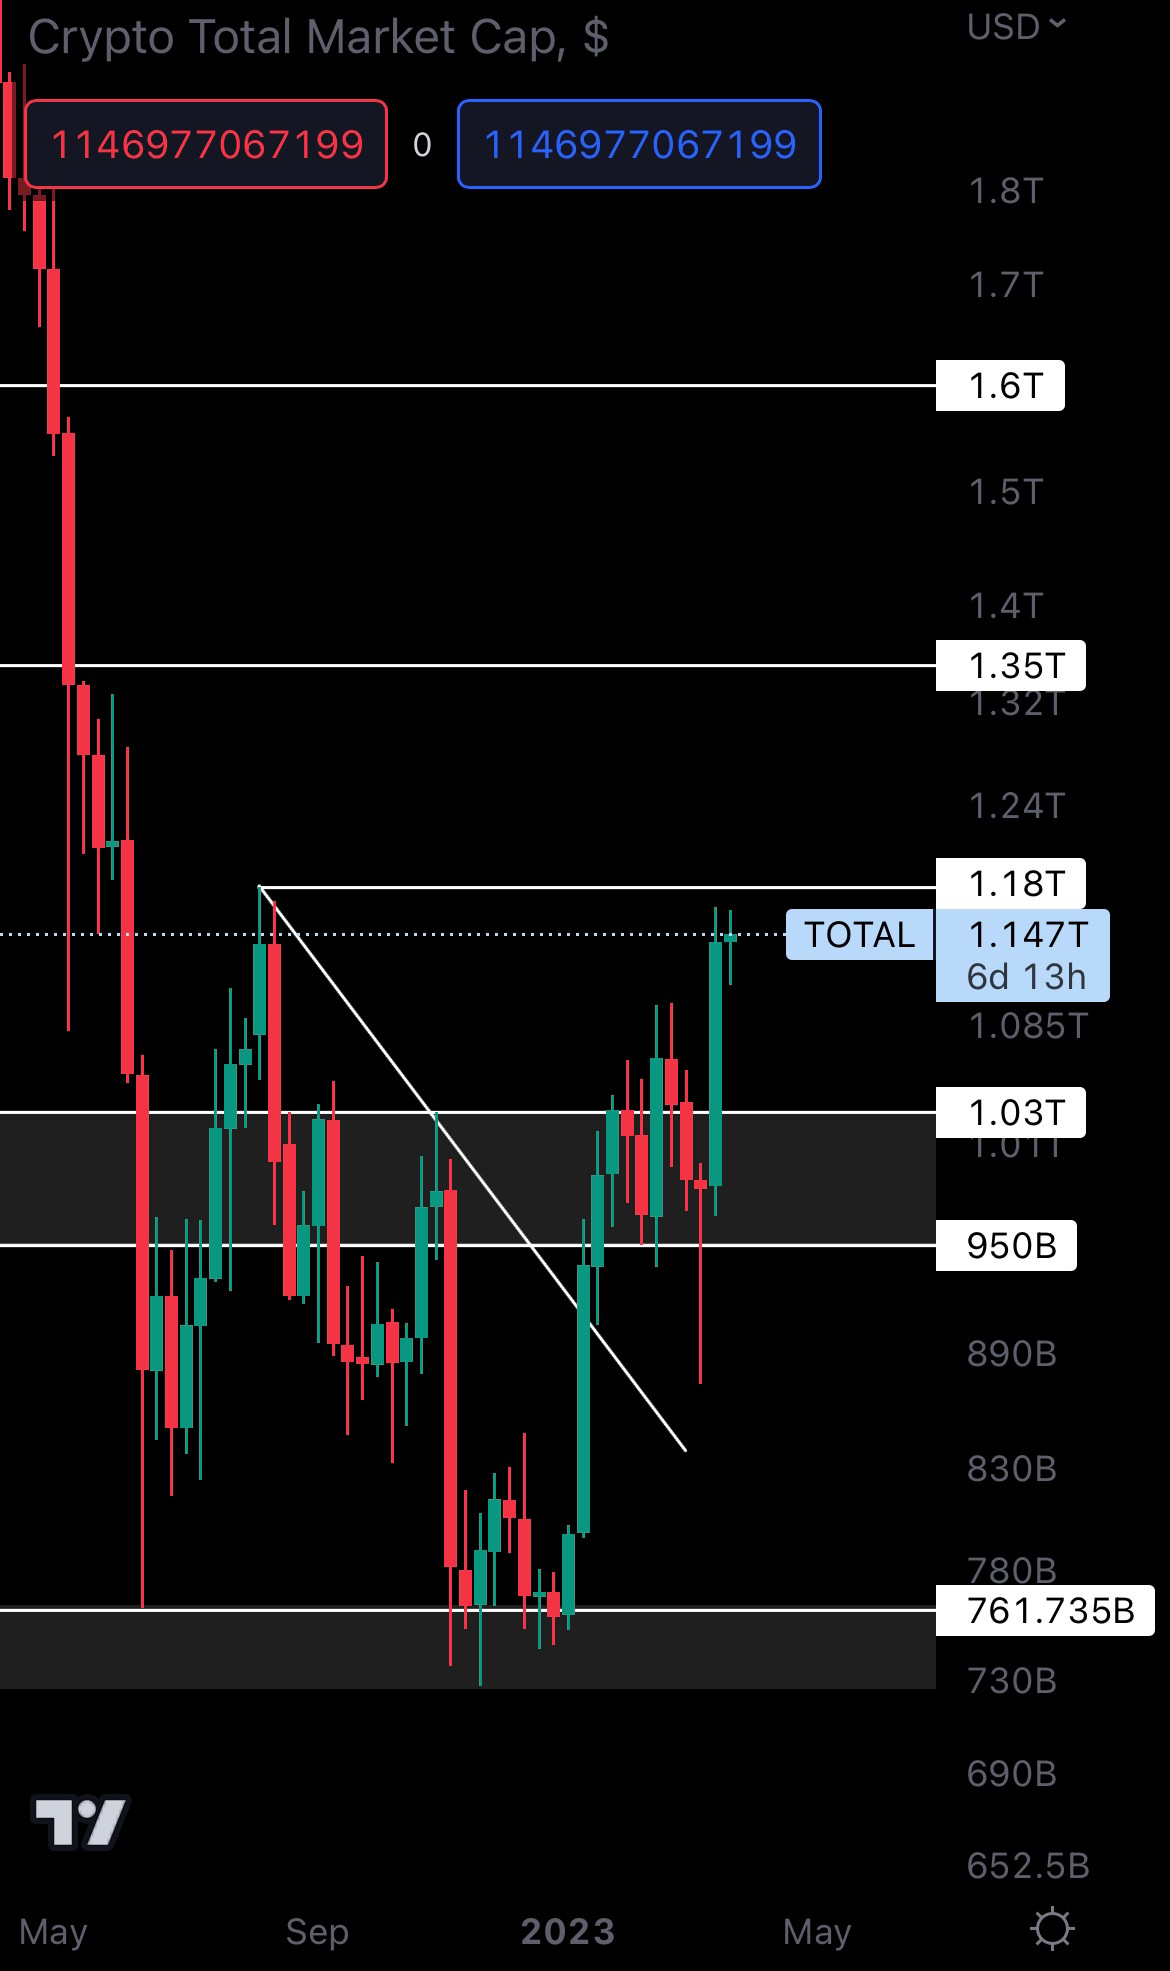
What a week! The crypto market saw a +15% increase, and broke from its $1.03T - $950B range.
It’s now approaching resistance at $1.18T, and it just happens that Bitcoin is also reaching resistance simultaneously. This suggests we could see some turbulence, despite the market looking ready for more upside.
So, we recommend preparing to secure profits from your short-term positions. No point in getting greedy.
We do believe that there is more upside to come, but a slight retrace first is not impossible.
Altcoins Market Cap (Weekly)
The Altcoins Market Cap index represents the entire evaluation of the altcoins market (all coins other than BTC).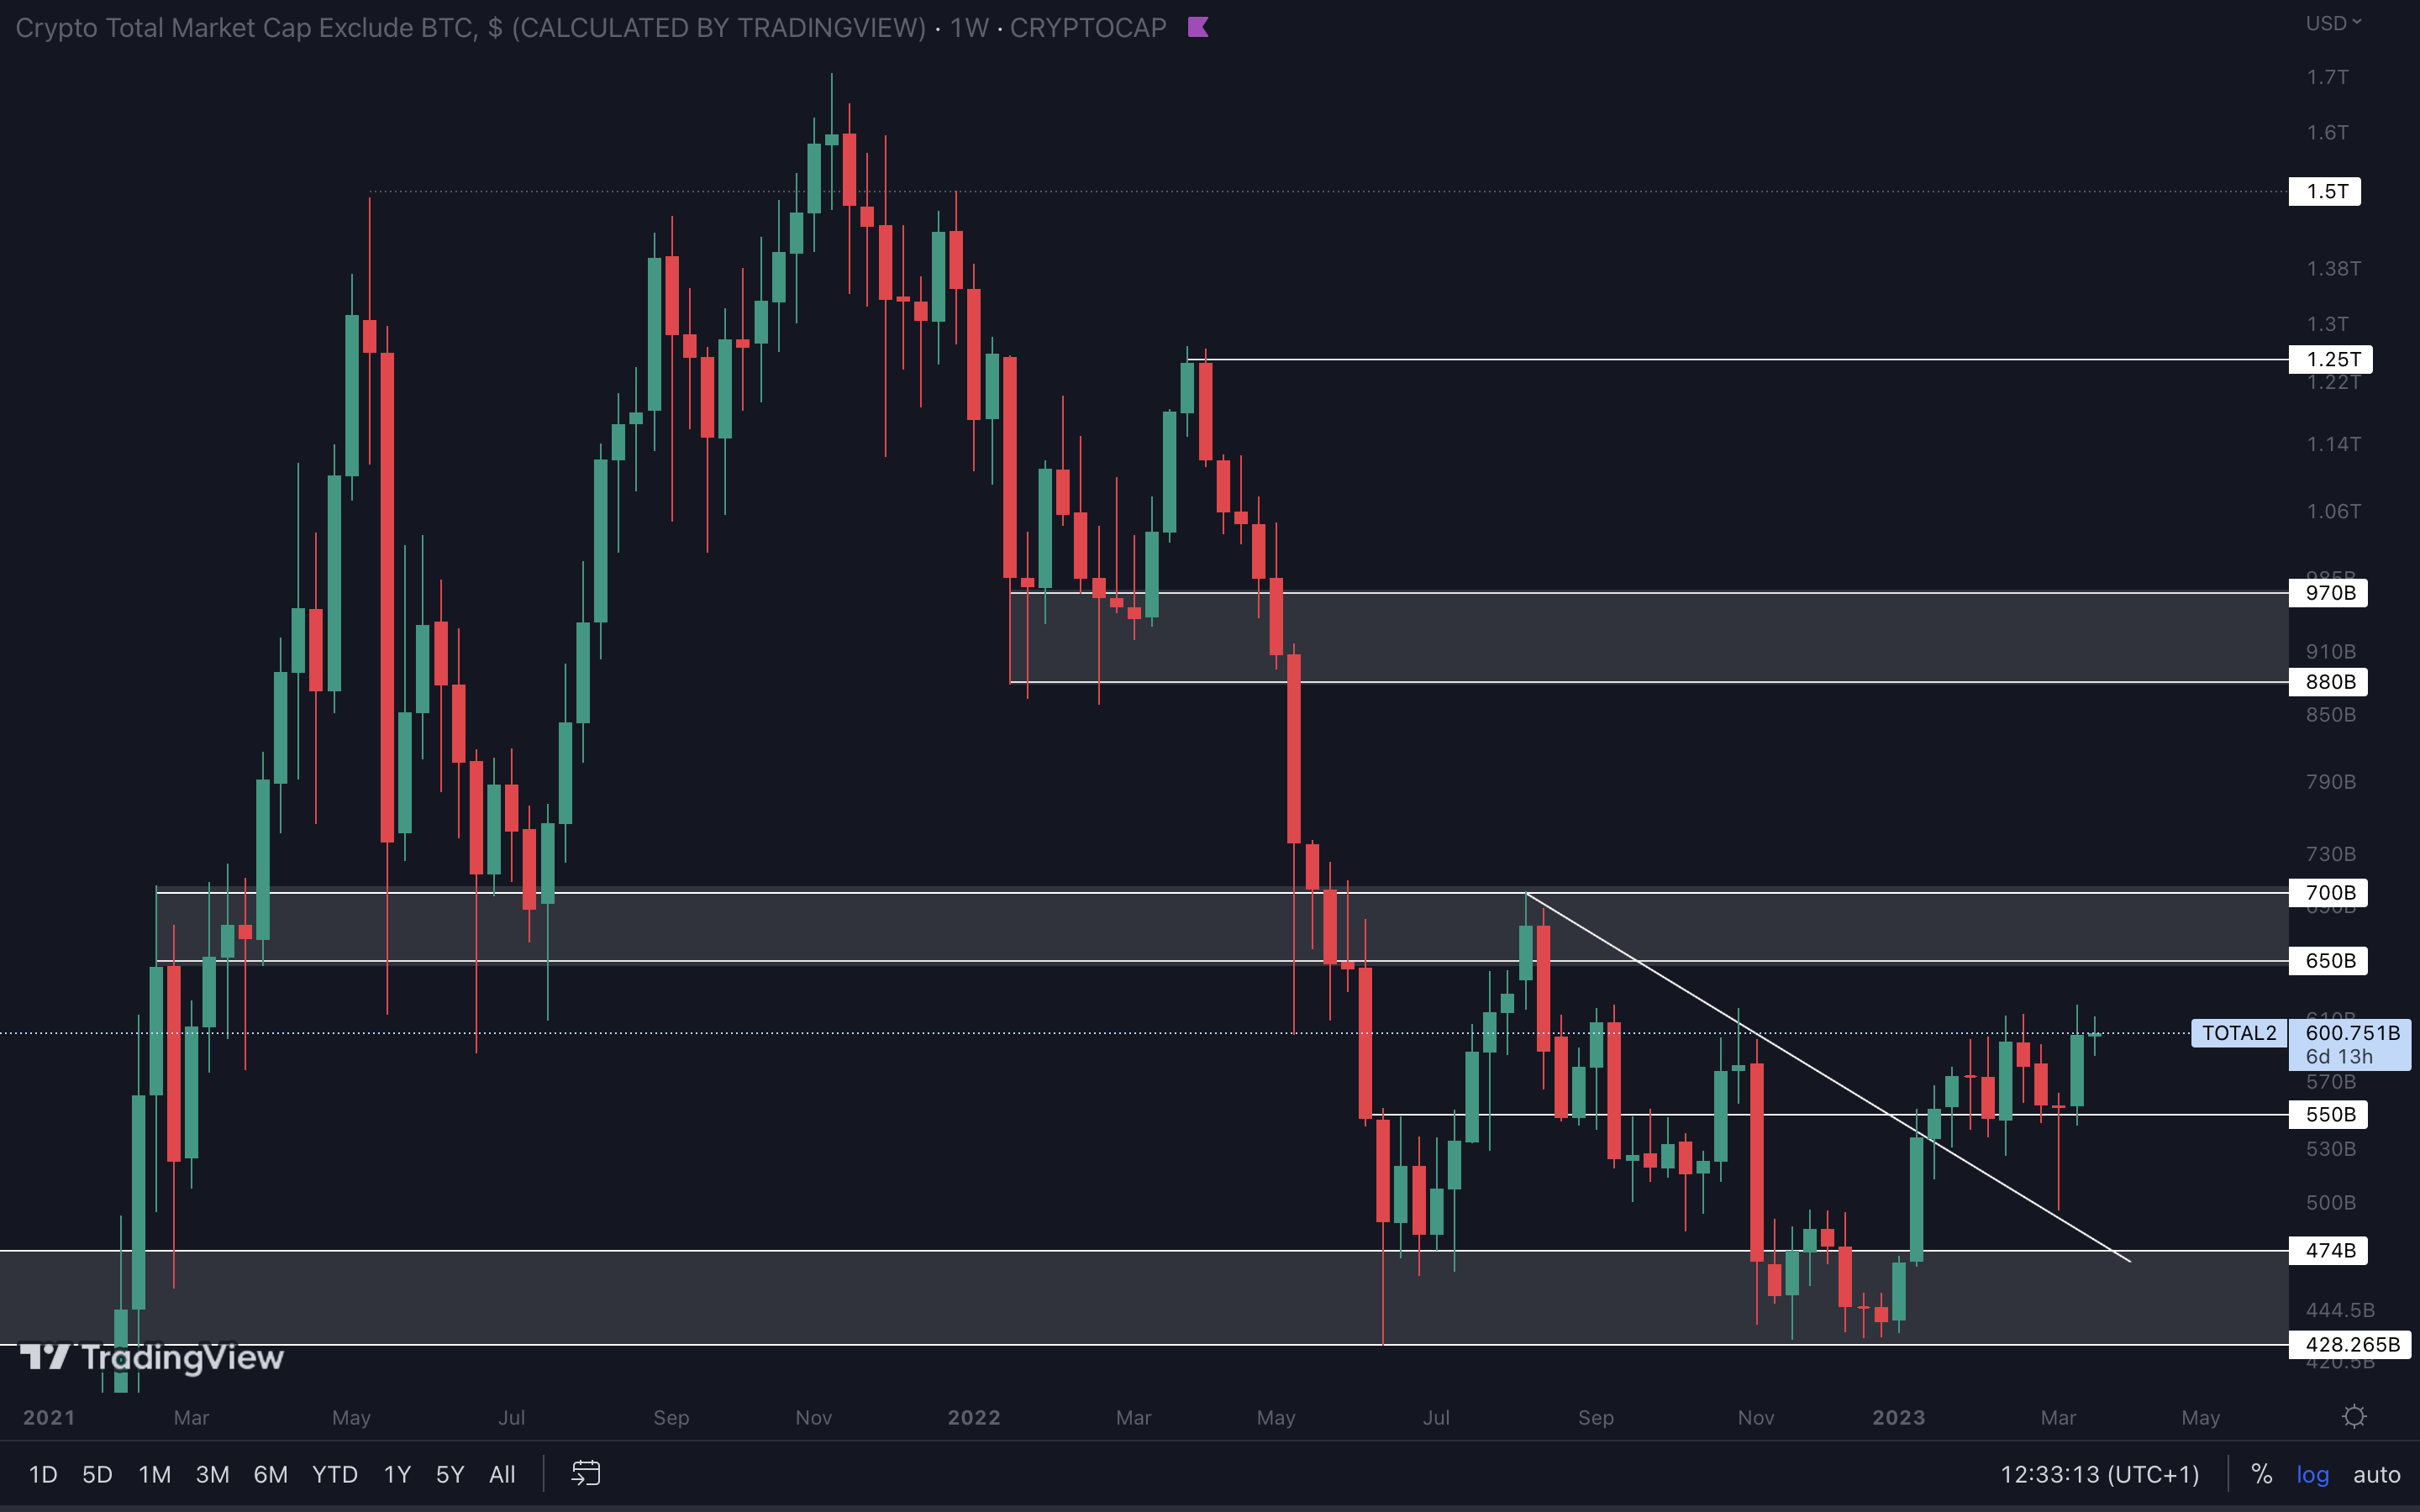
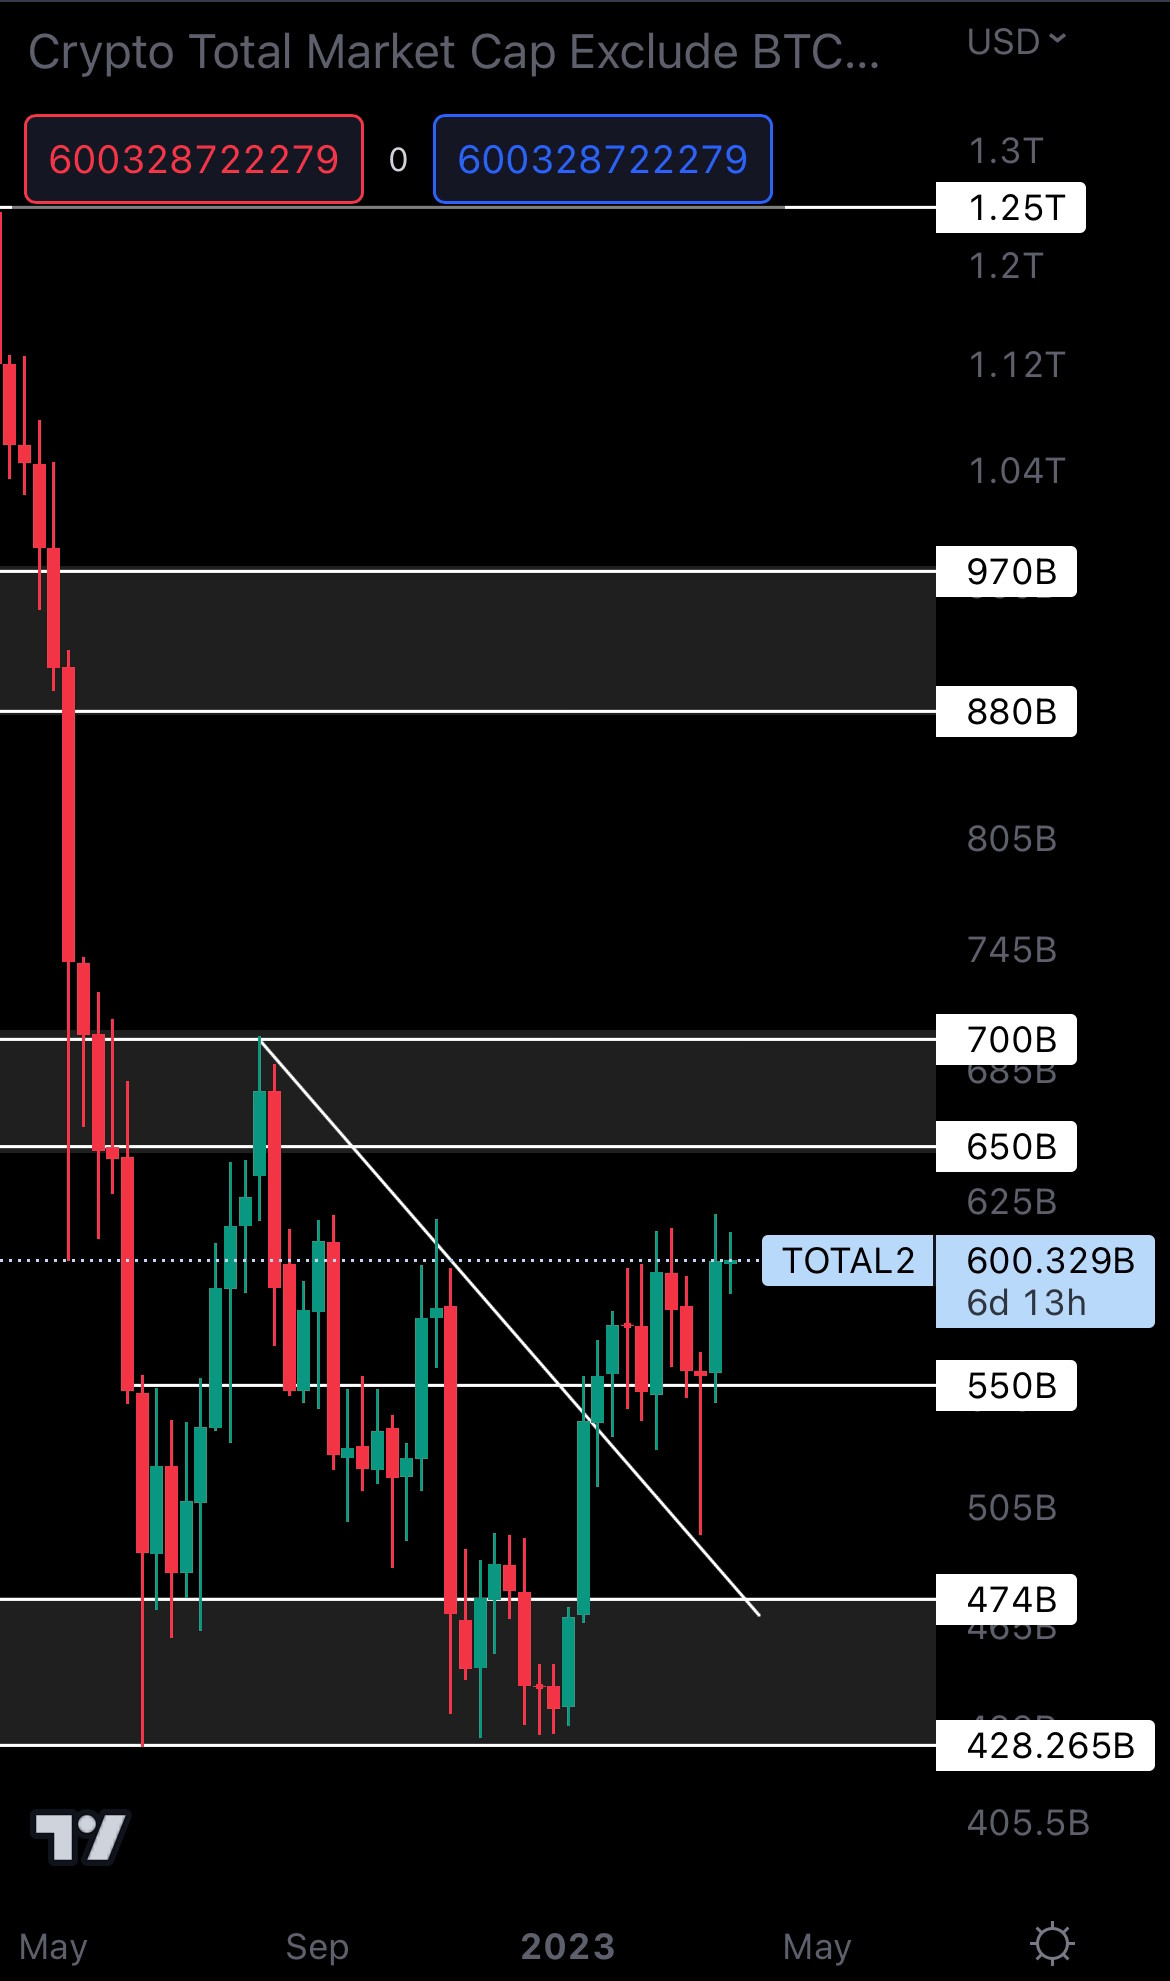
The Altcoins Market Cap marked a weekly higher high last week. As we’ve said before - you should never bet against market structure. From a technical standpoint, the altcoins market is now heading to $650B. For this level to be reached, we’d want to see the Total Market Cap break $1.18T.
Cryptonary's Watchlist
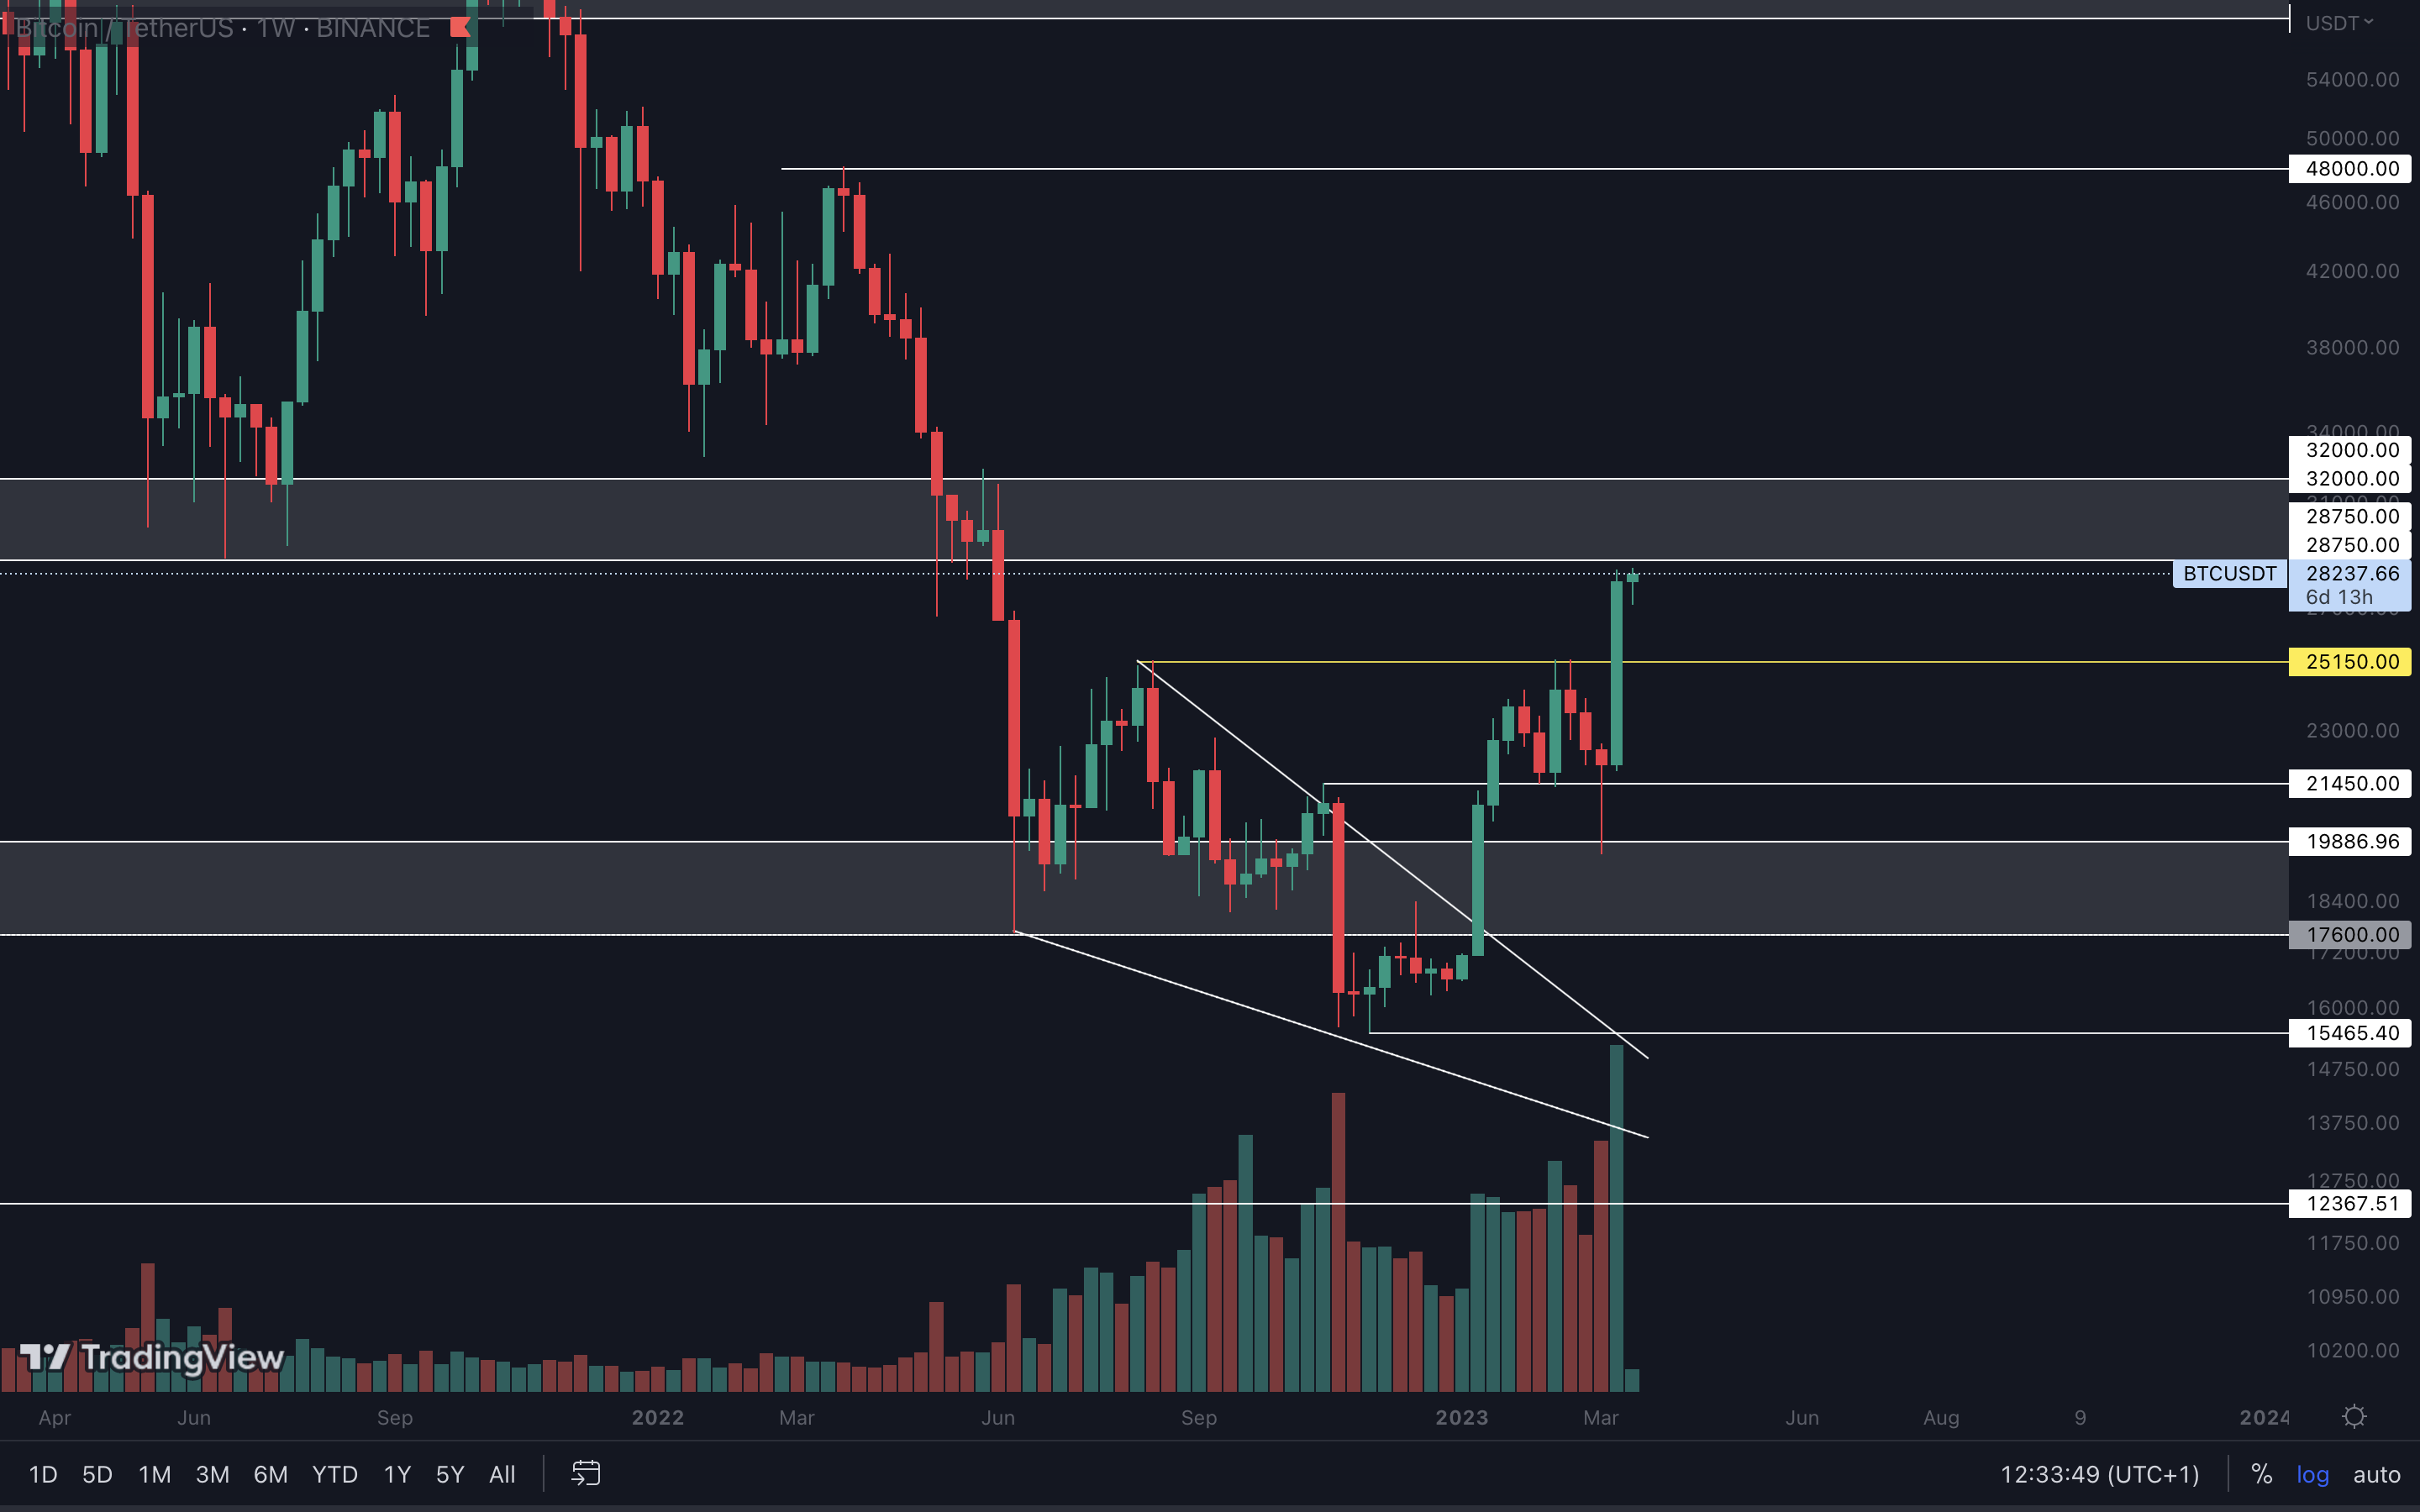
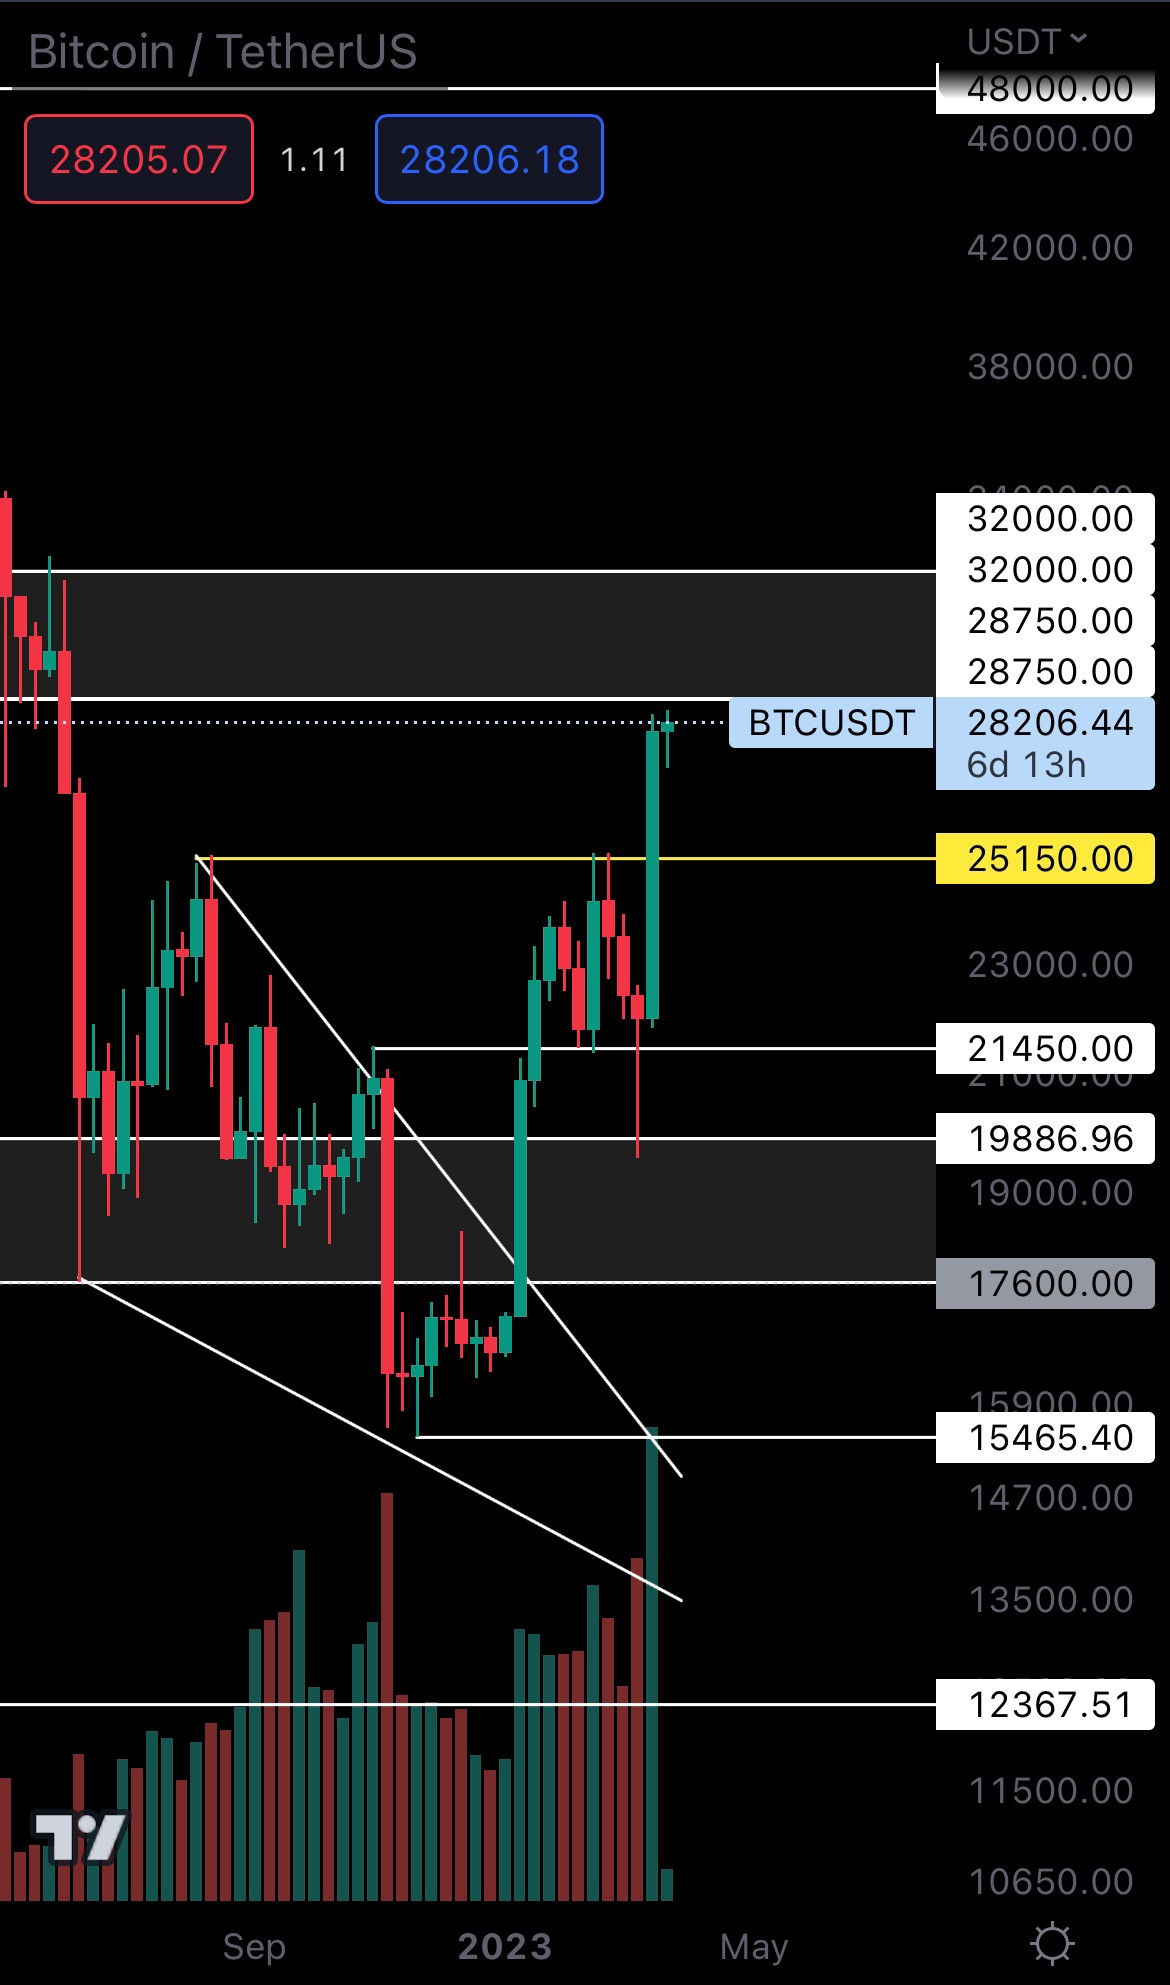
BTC | Bitcoin (Weekly)
ETH | Ethereum (Weekly)
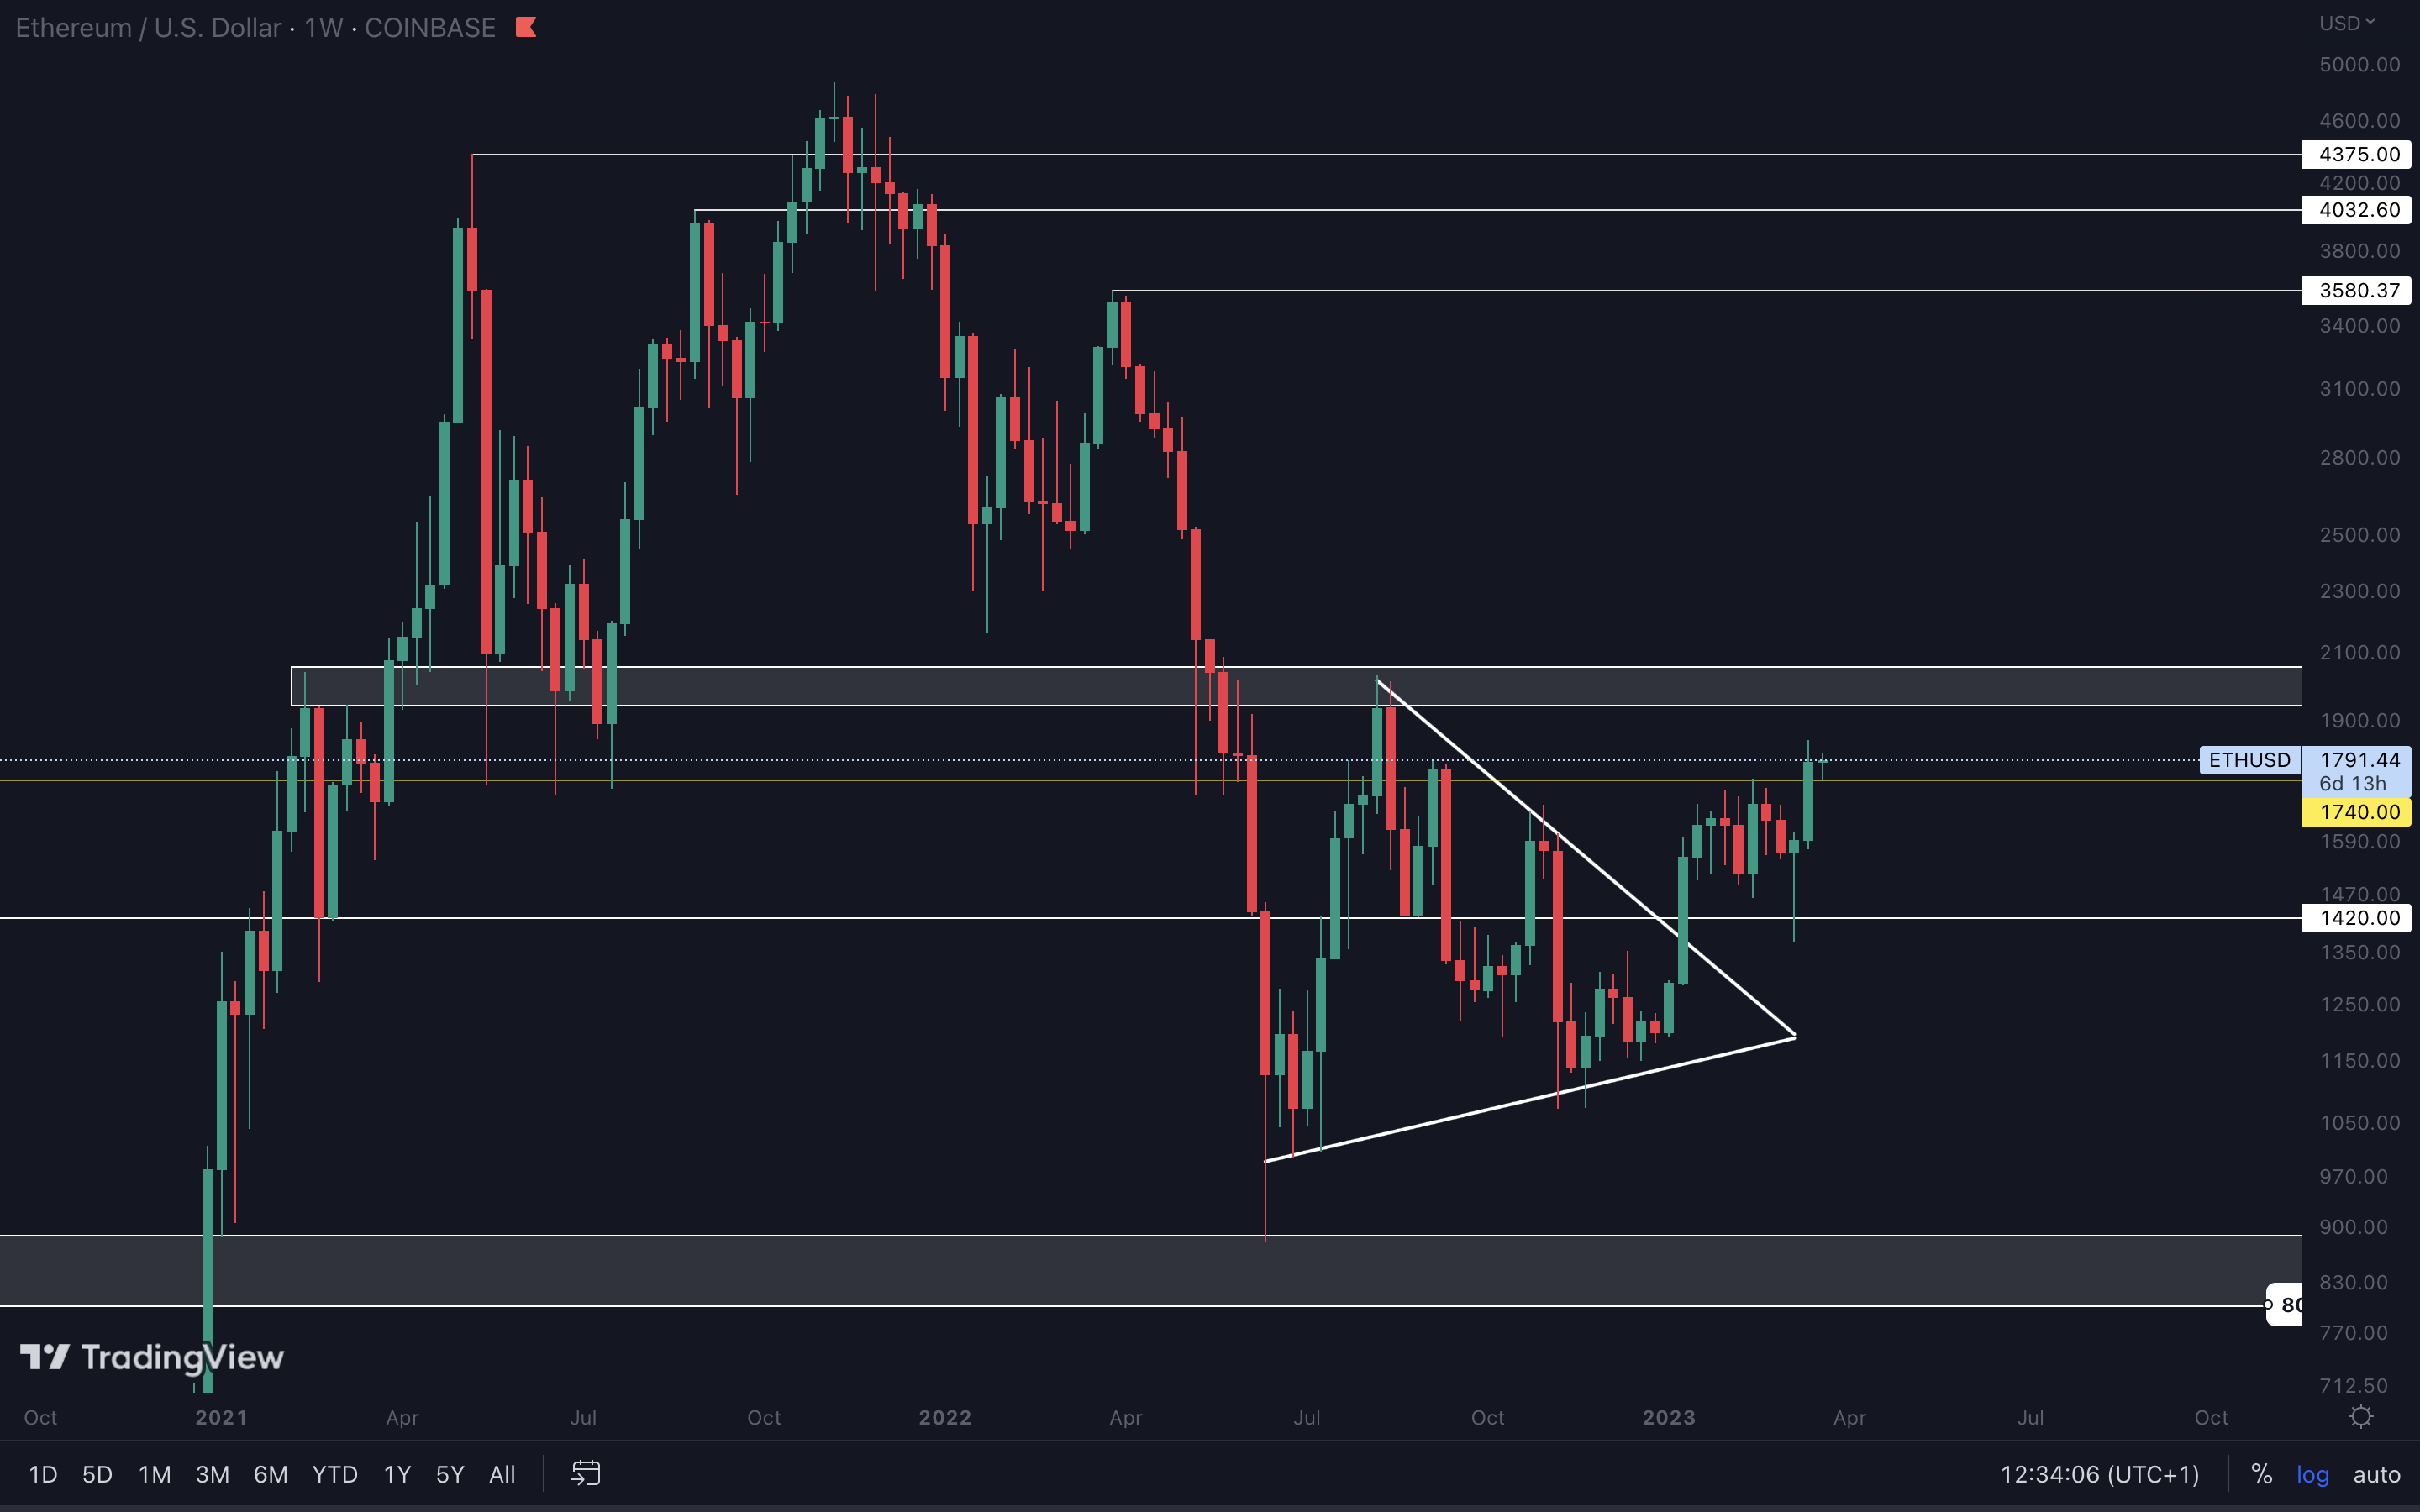
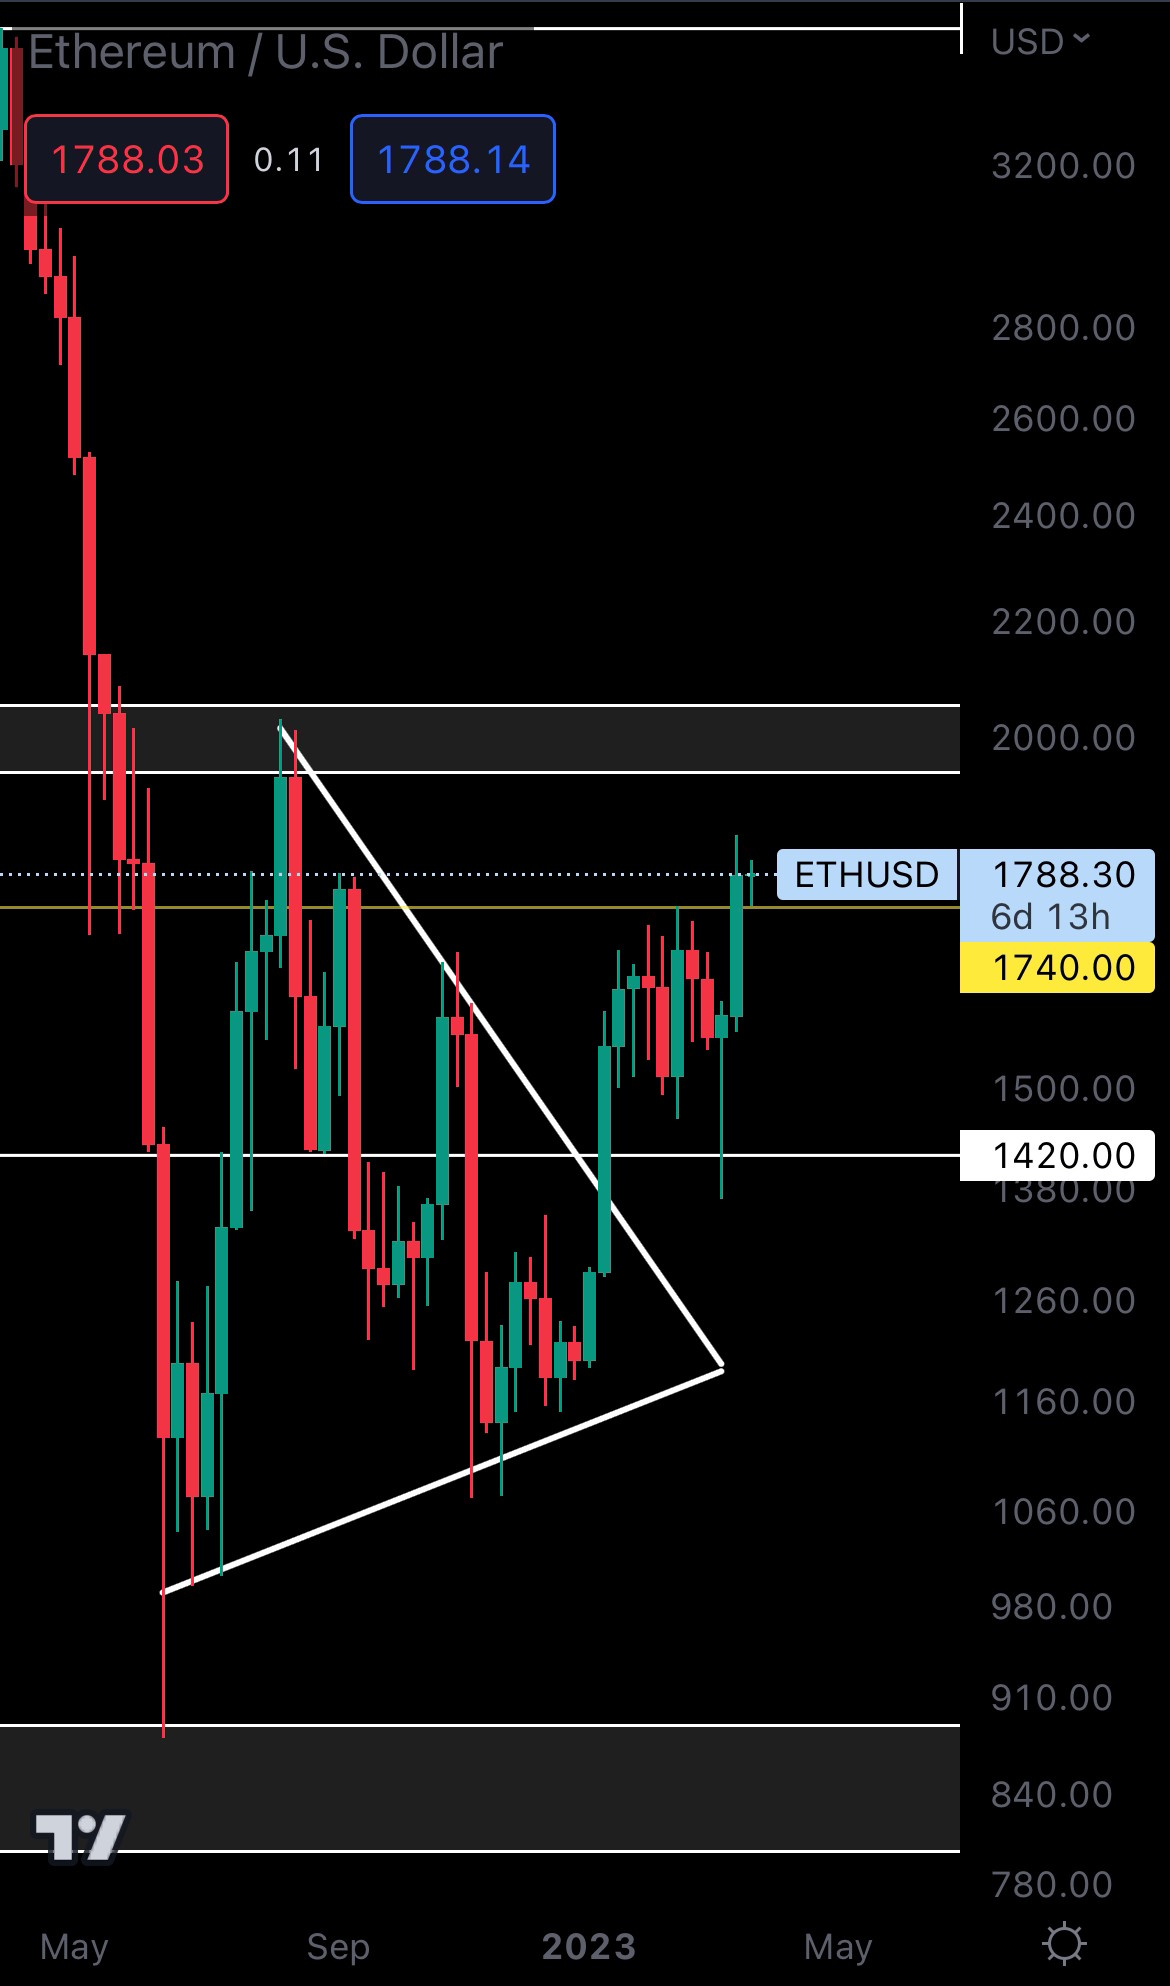
The most important thing on this chart right now is the fact that Ether closed a weekly candle above $1740. This opens the door for $2000, the final target of the symmetrical triangle we’ve been tracking for the past few months. An invalidation of this scenario would occur if Ether closes a weekly candle under $1740.
DYDX | dYdX (Weekly)
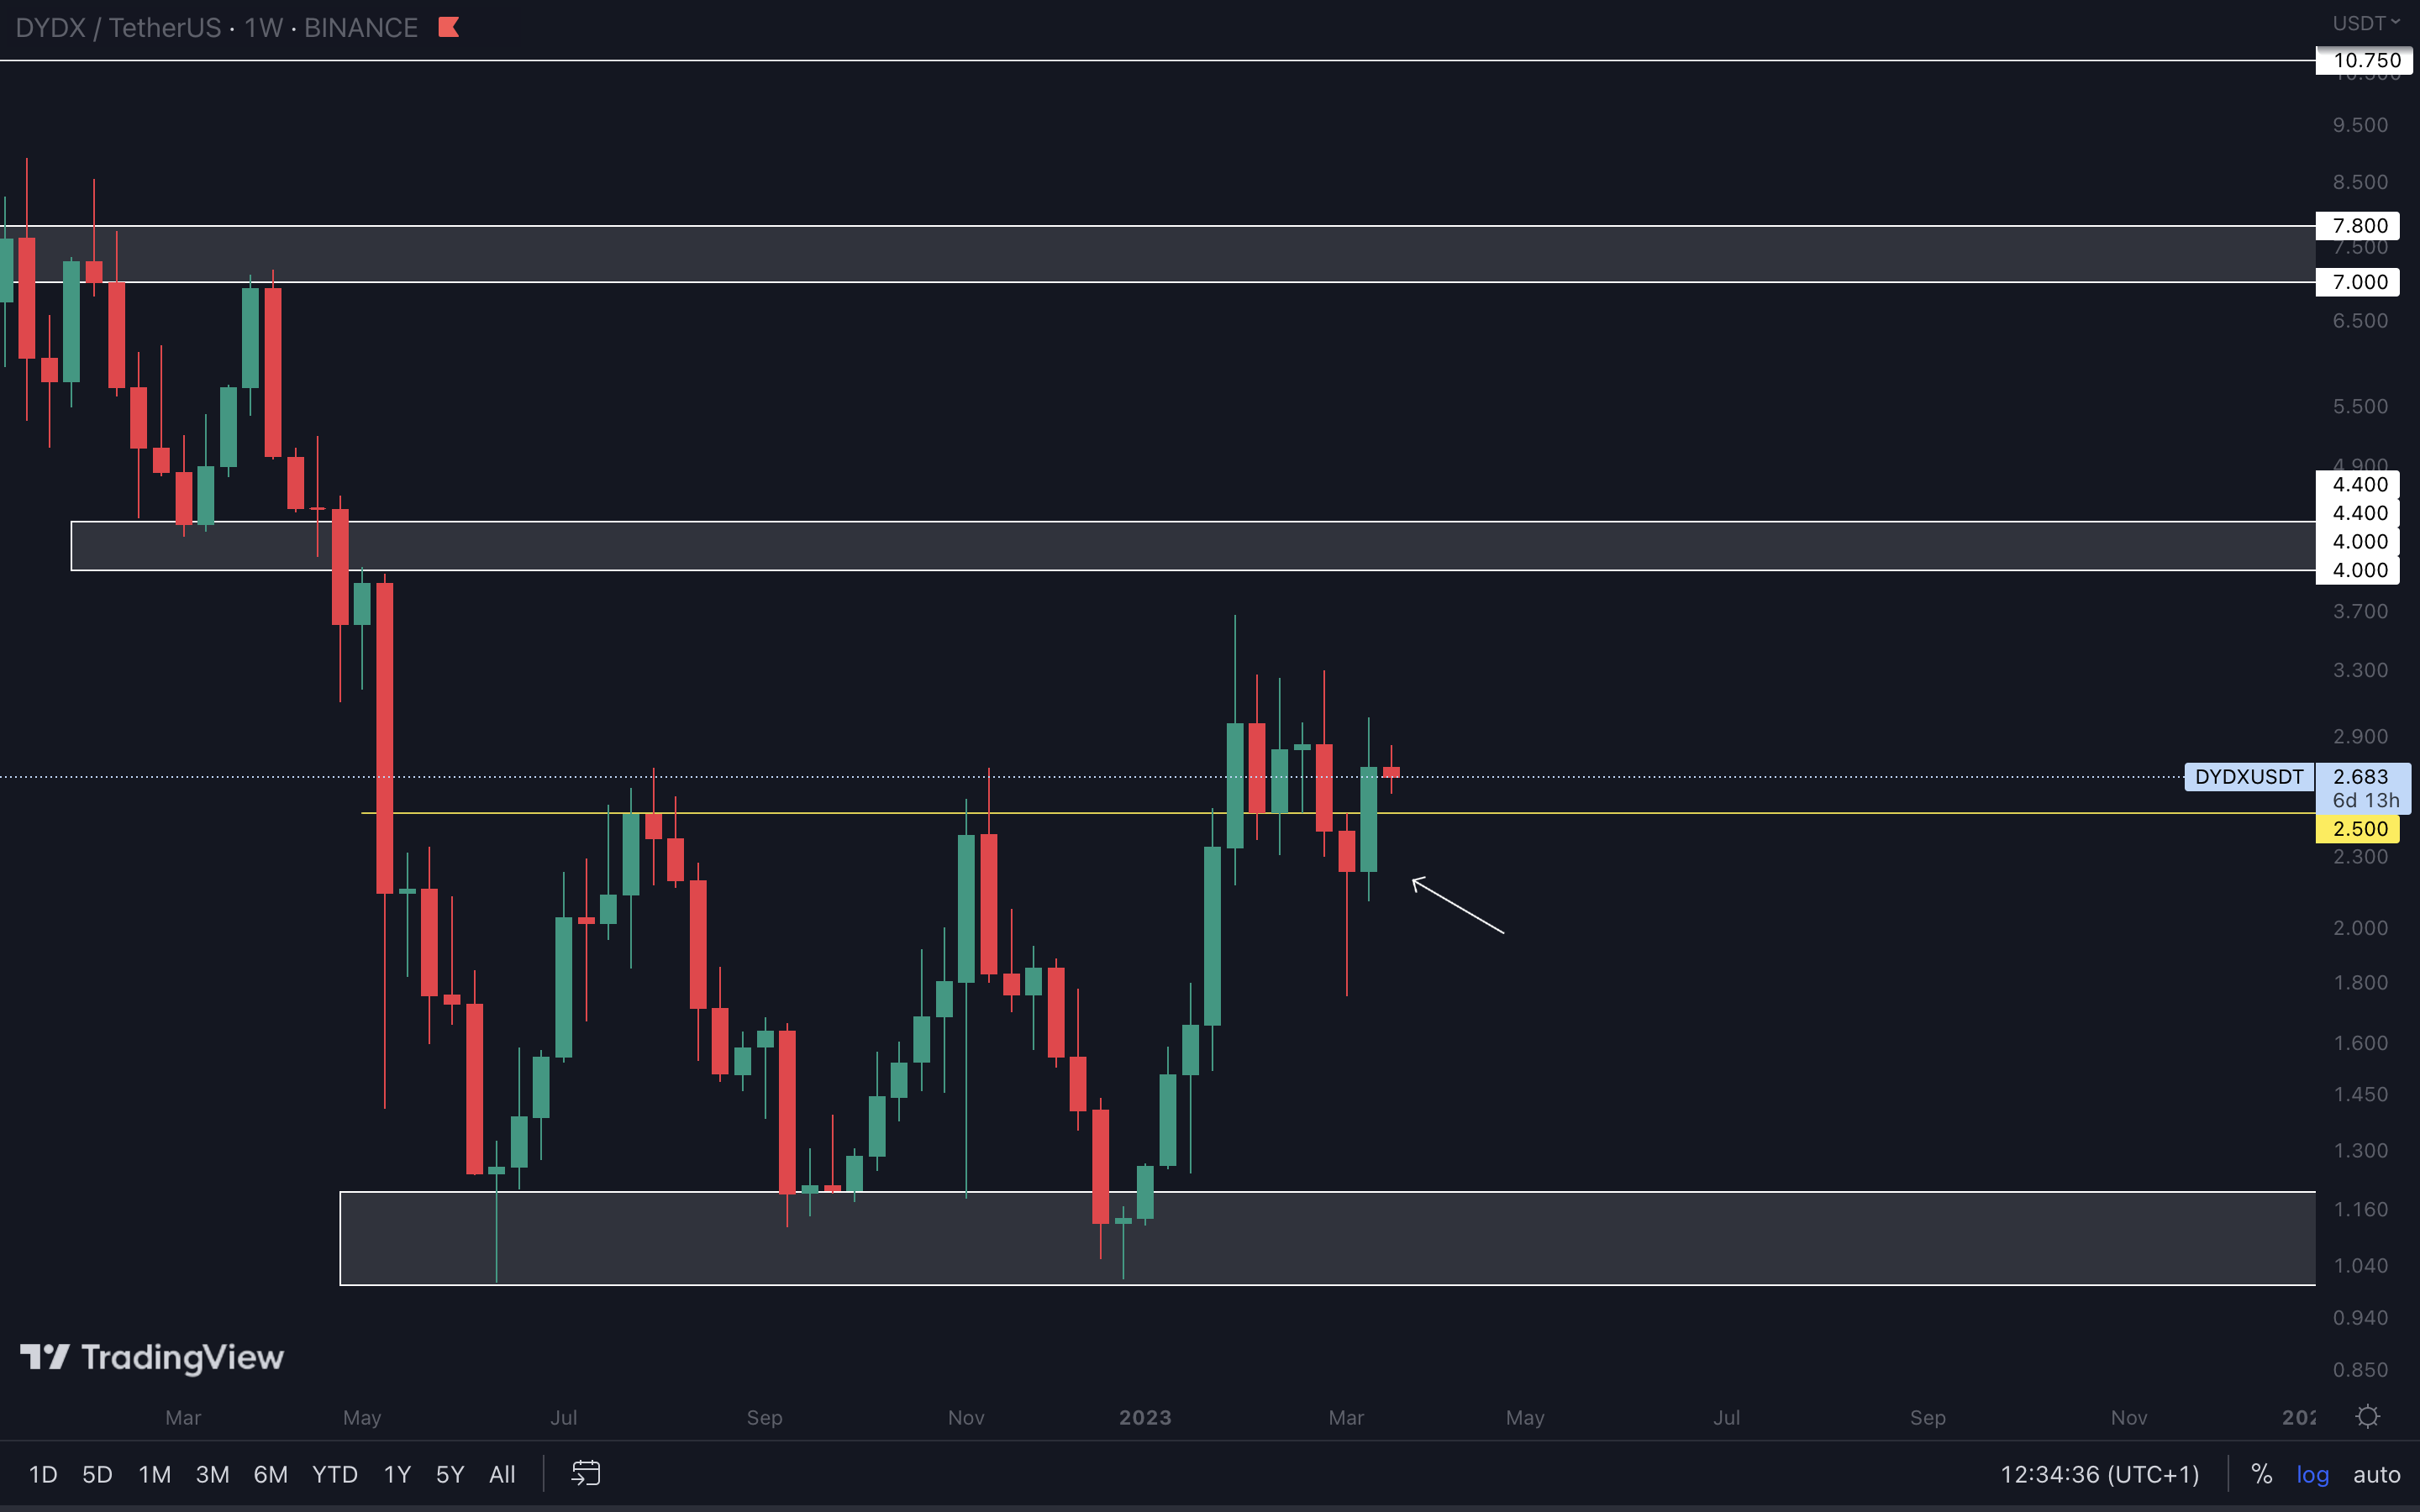
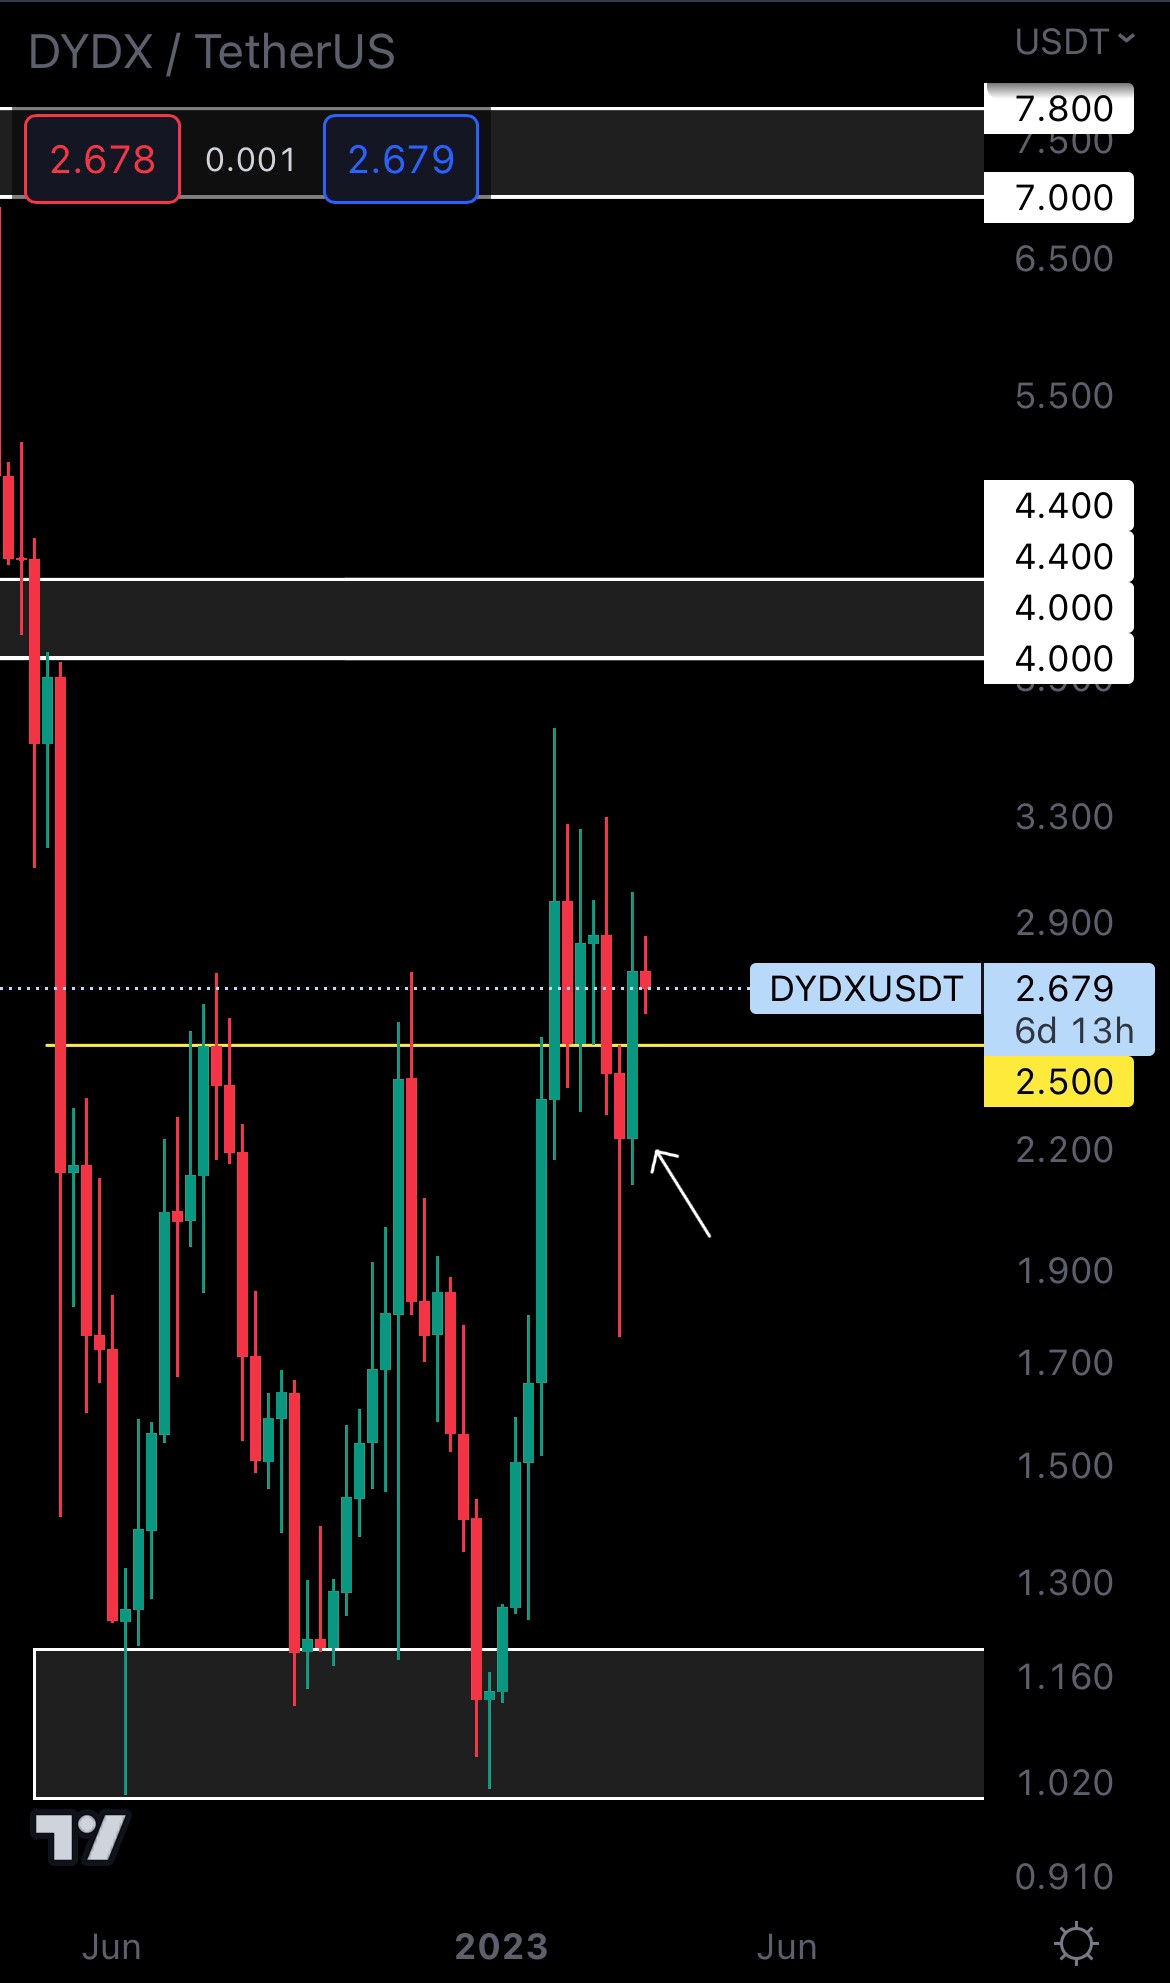
DYDX closed a bullish engulfing candle above resistance ($2.50), validating the triple bottom once again. As long as DYDX holds $2.50 as support, we’ll see it test $4 - $4.40 in the coming weeks.
LDO | Lido DAO (Weekly)
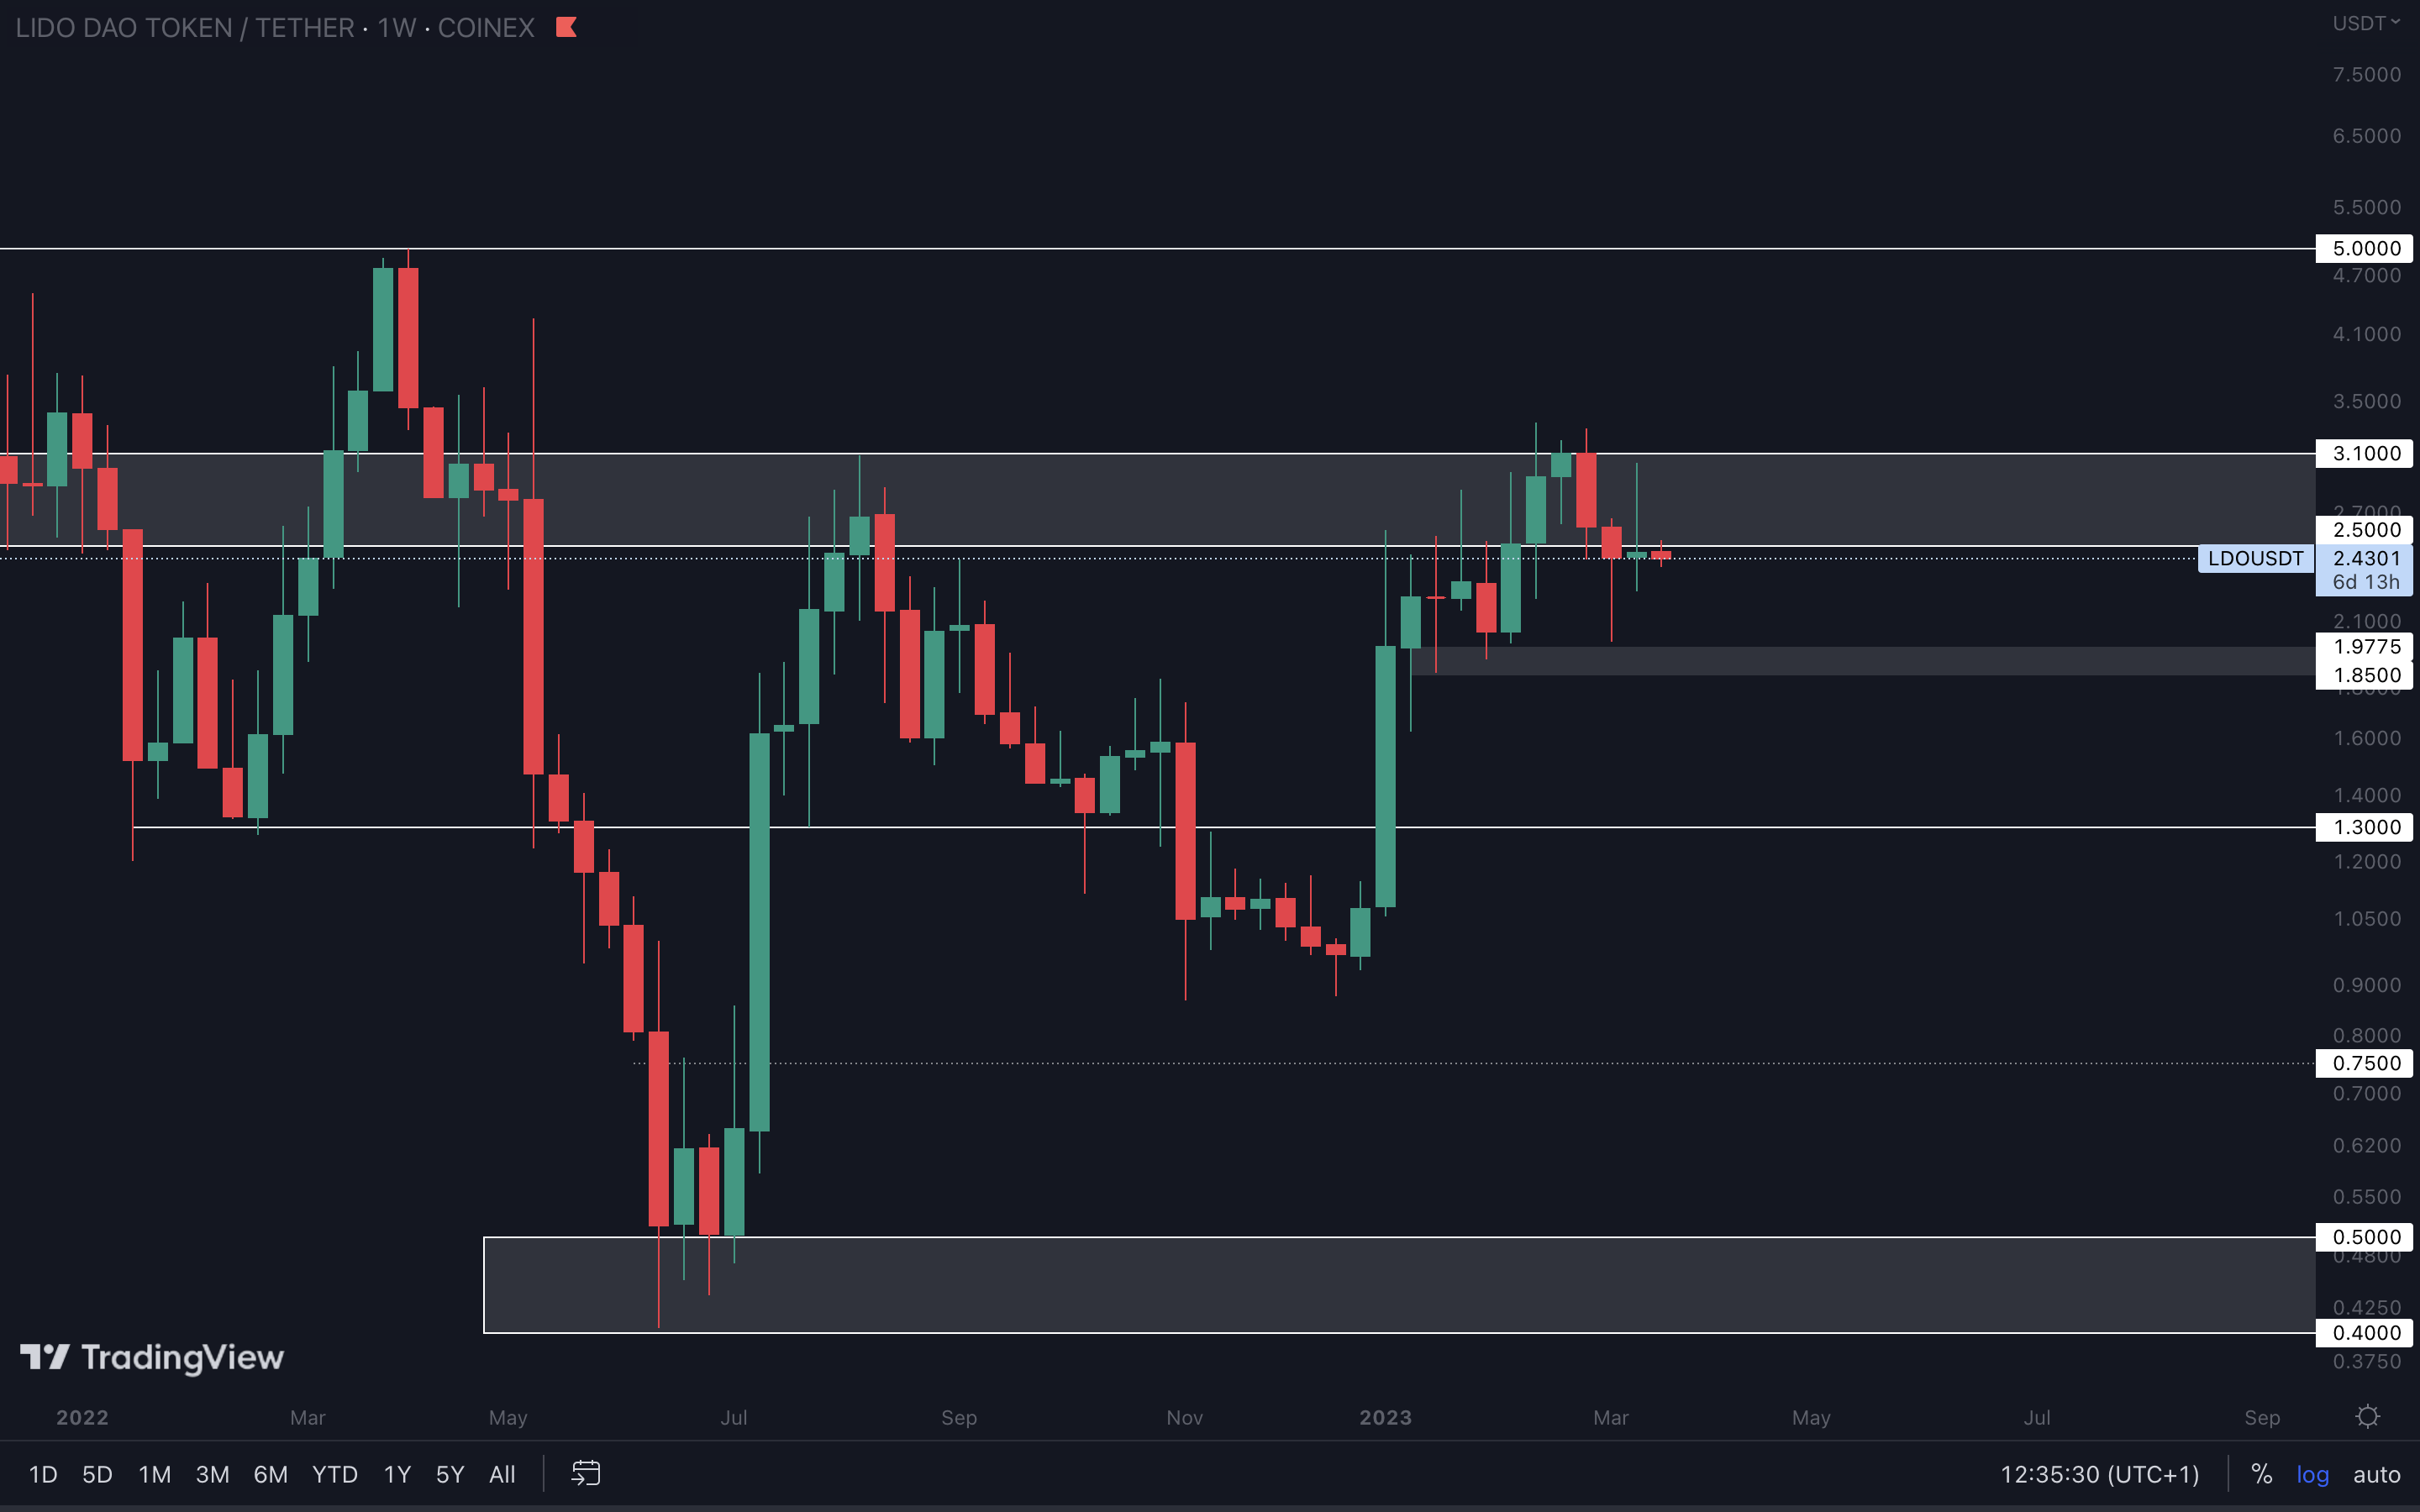
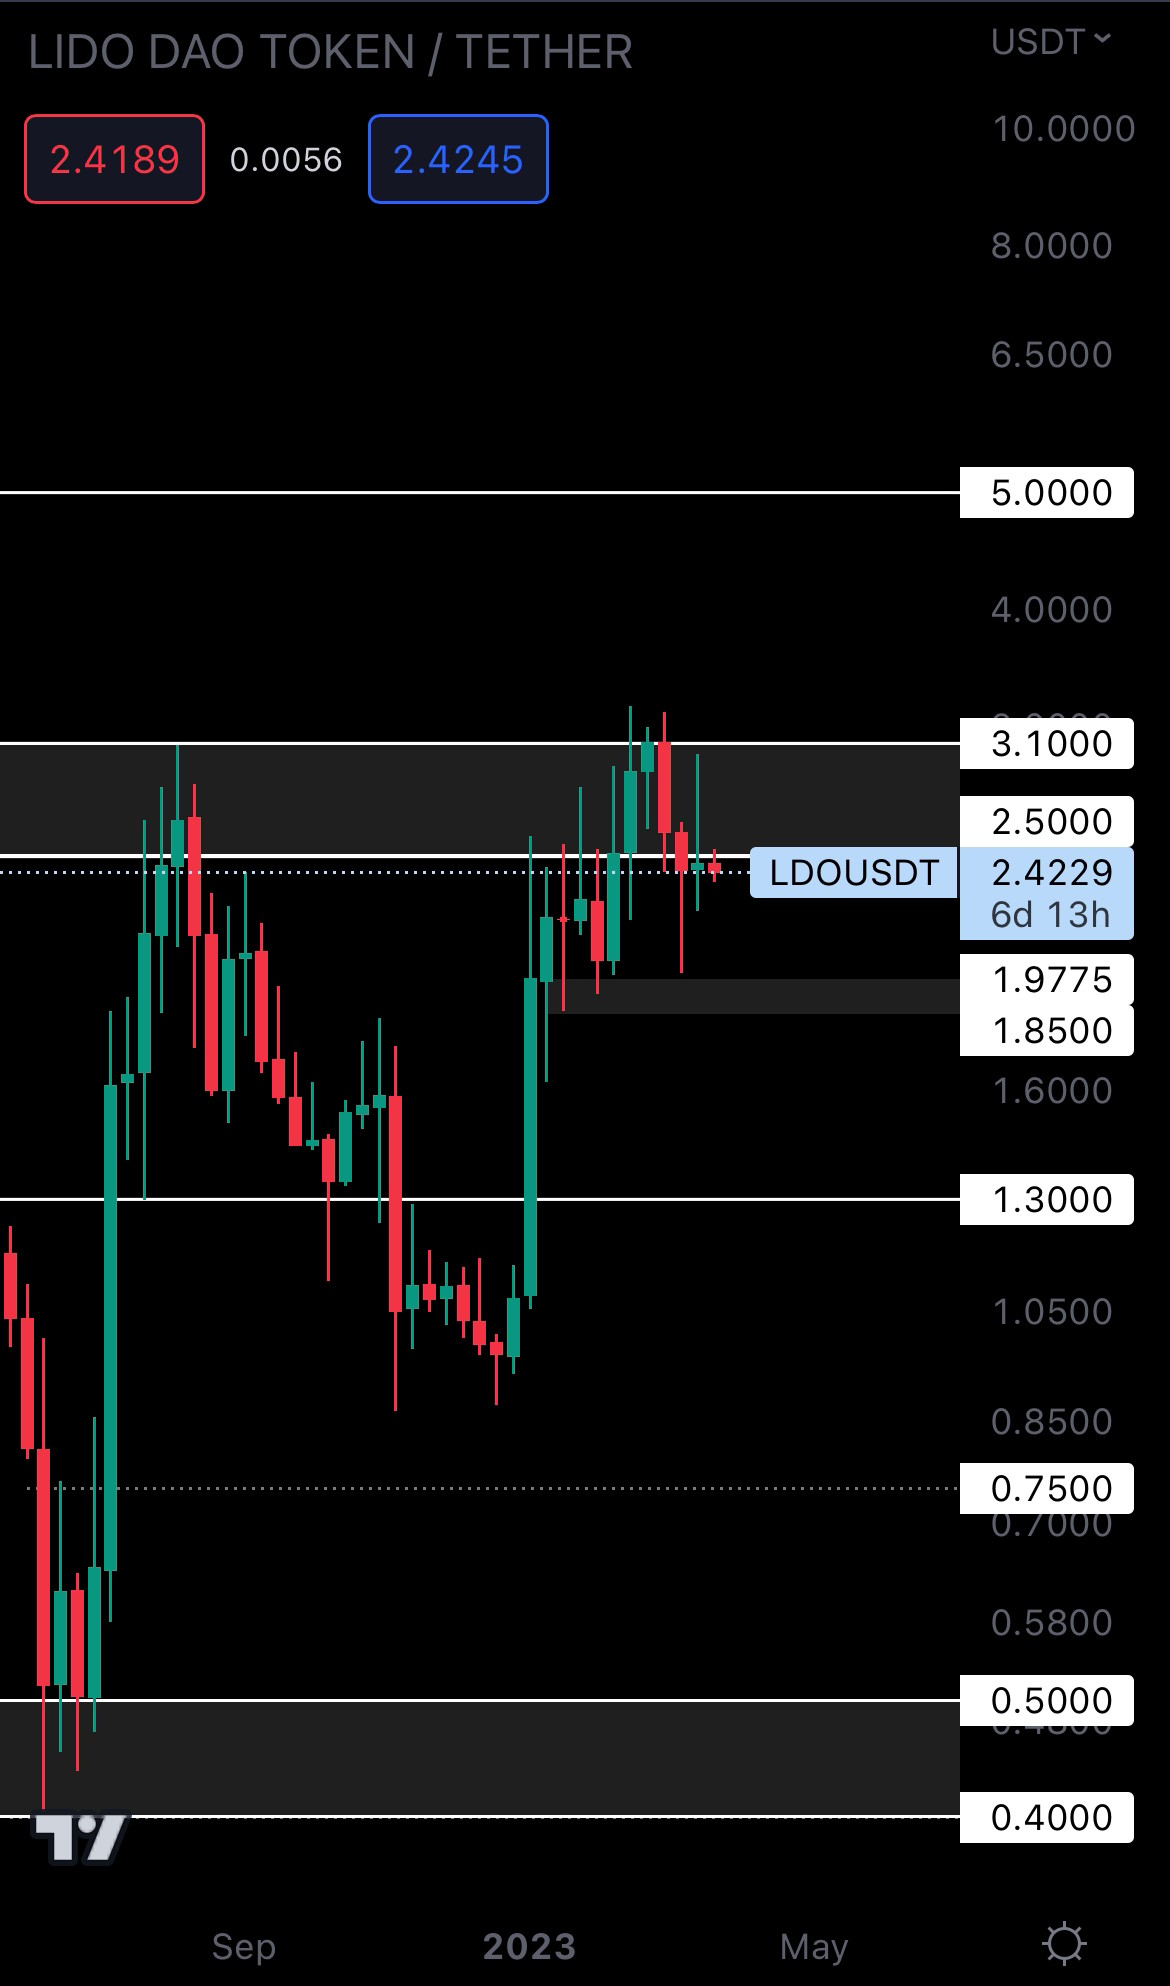
This is where it gets tricky.
LDO closed as a Doji candle last week, a strong signal of indecision. This is not in confluence with the market. LDO failing to close above resistance while the rest of the market is pumping indicates there’s some selling pressure keeping its price on standby. For upside to be confirmed, we’d want to see a weekly closure above $2.50.
HEGIC | Hegic (Weekly)
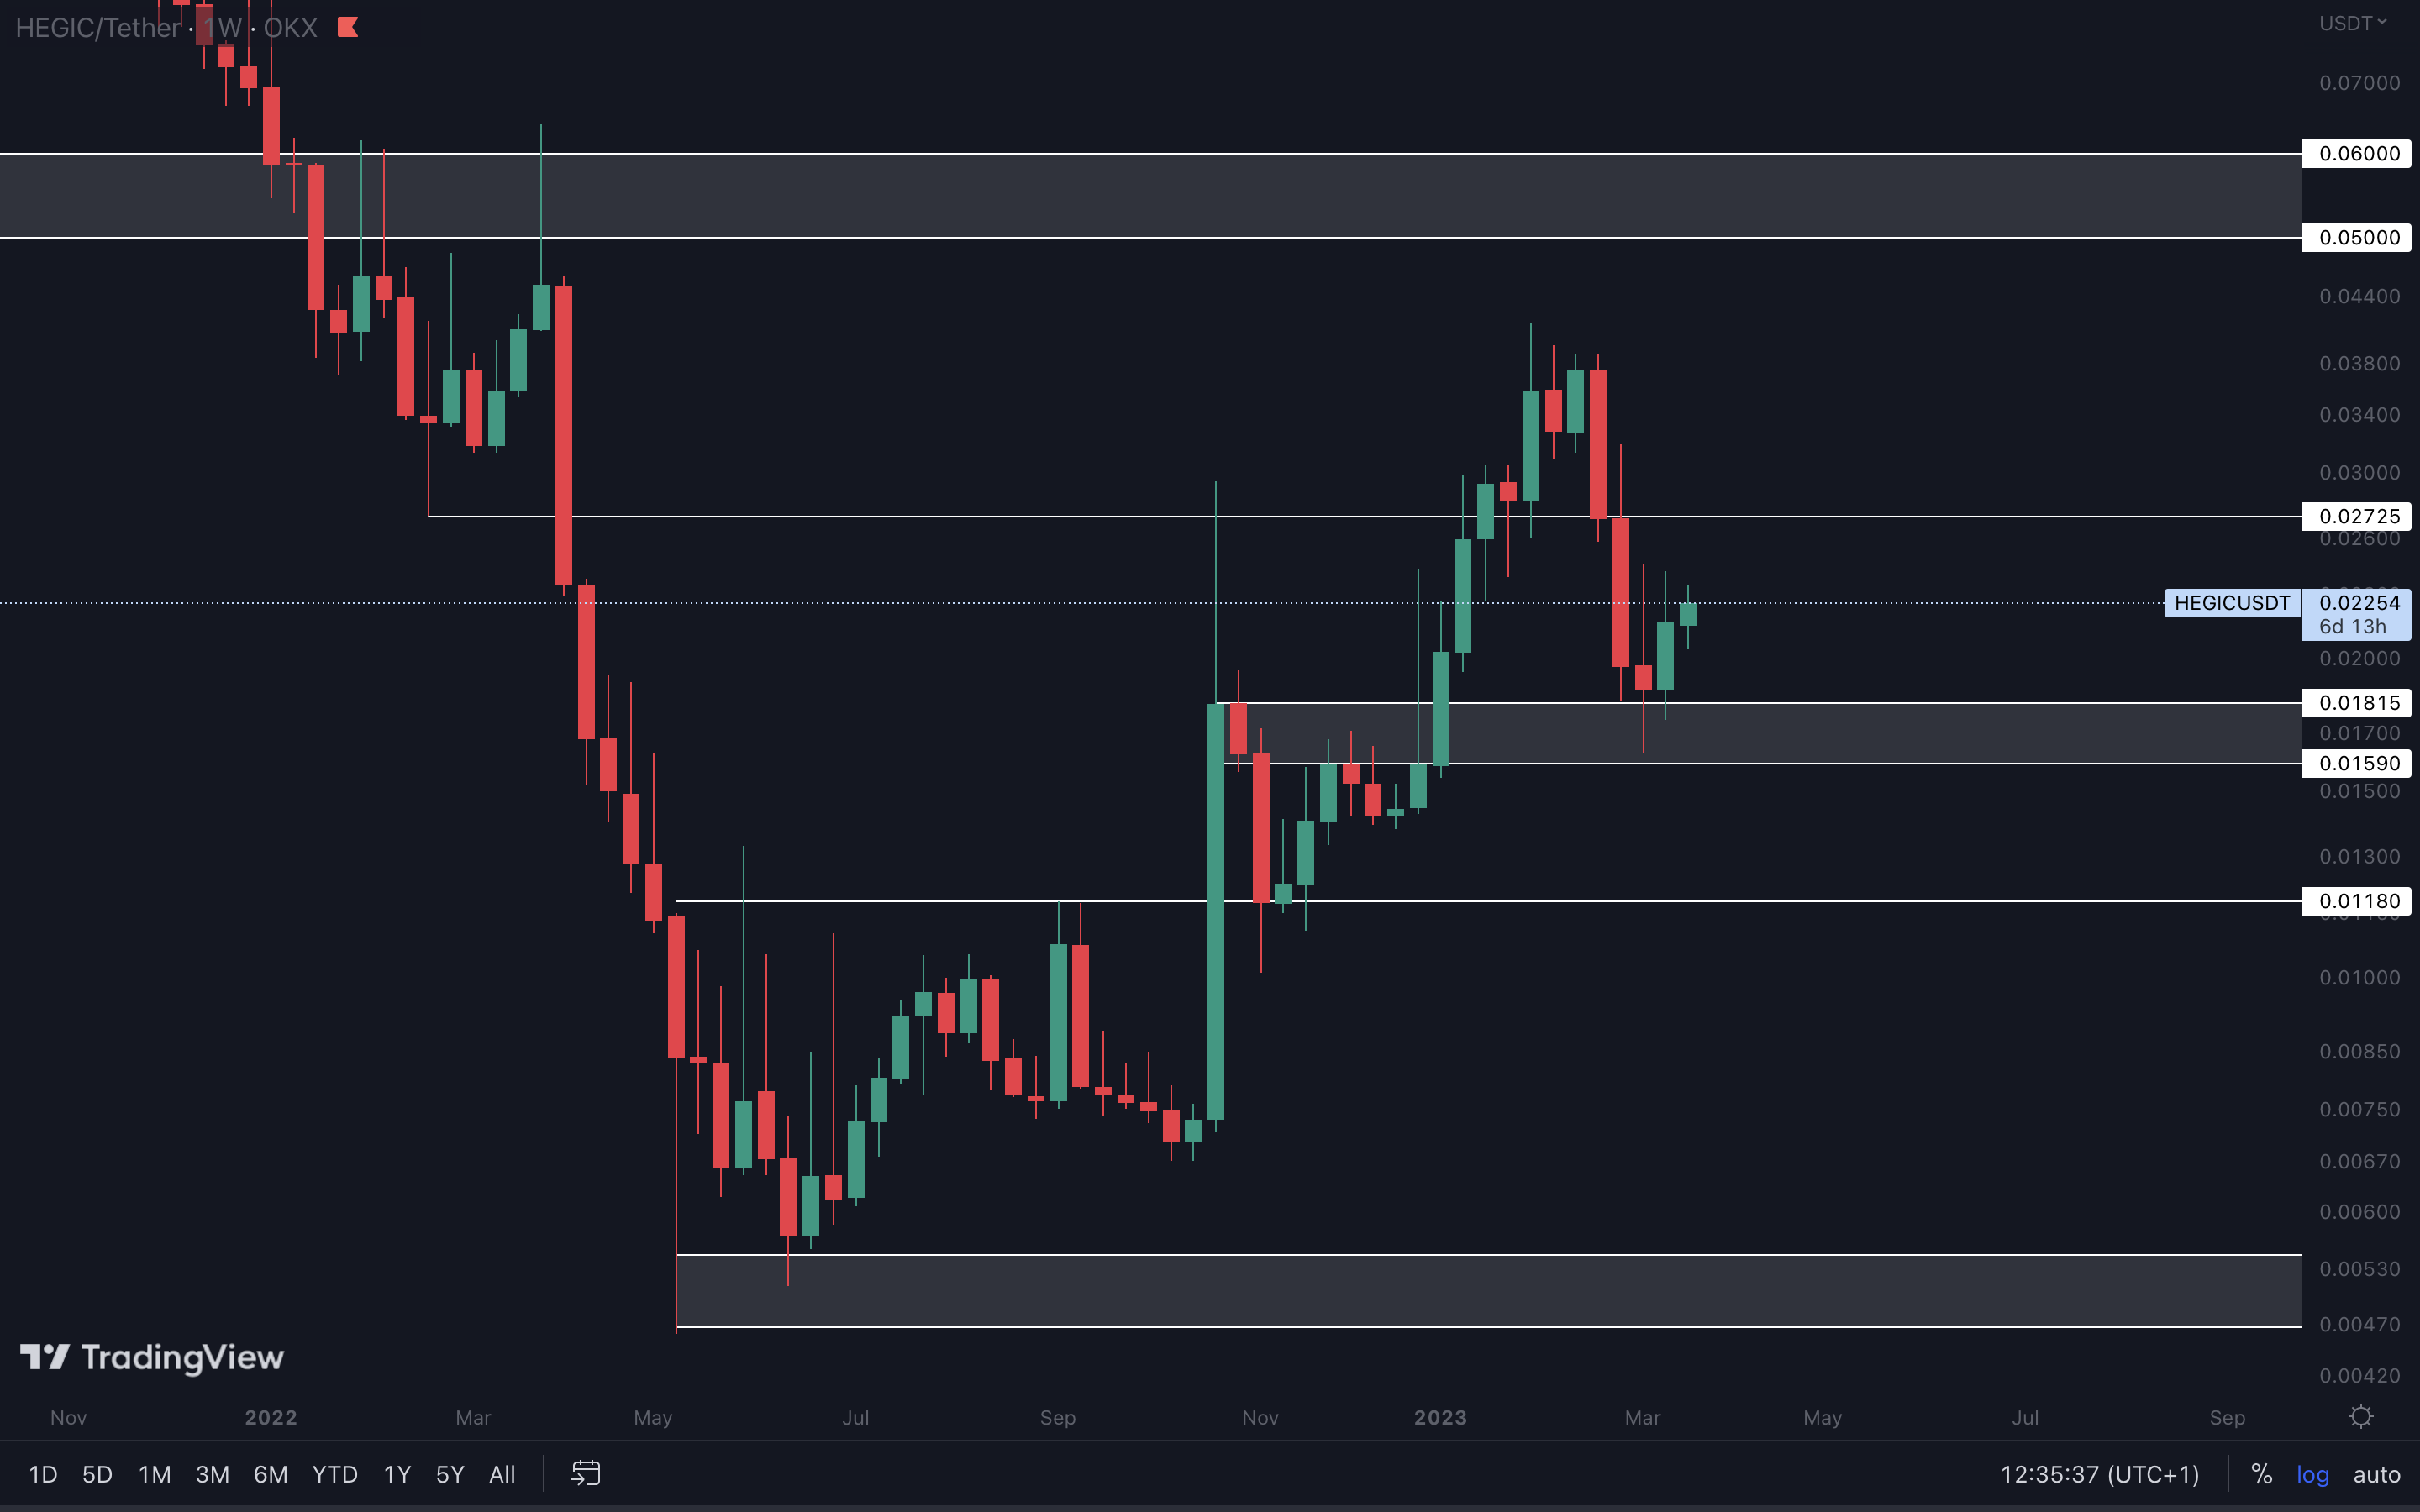
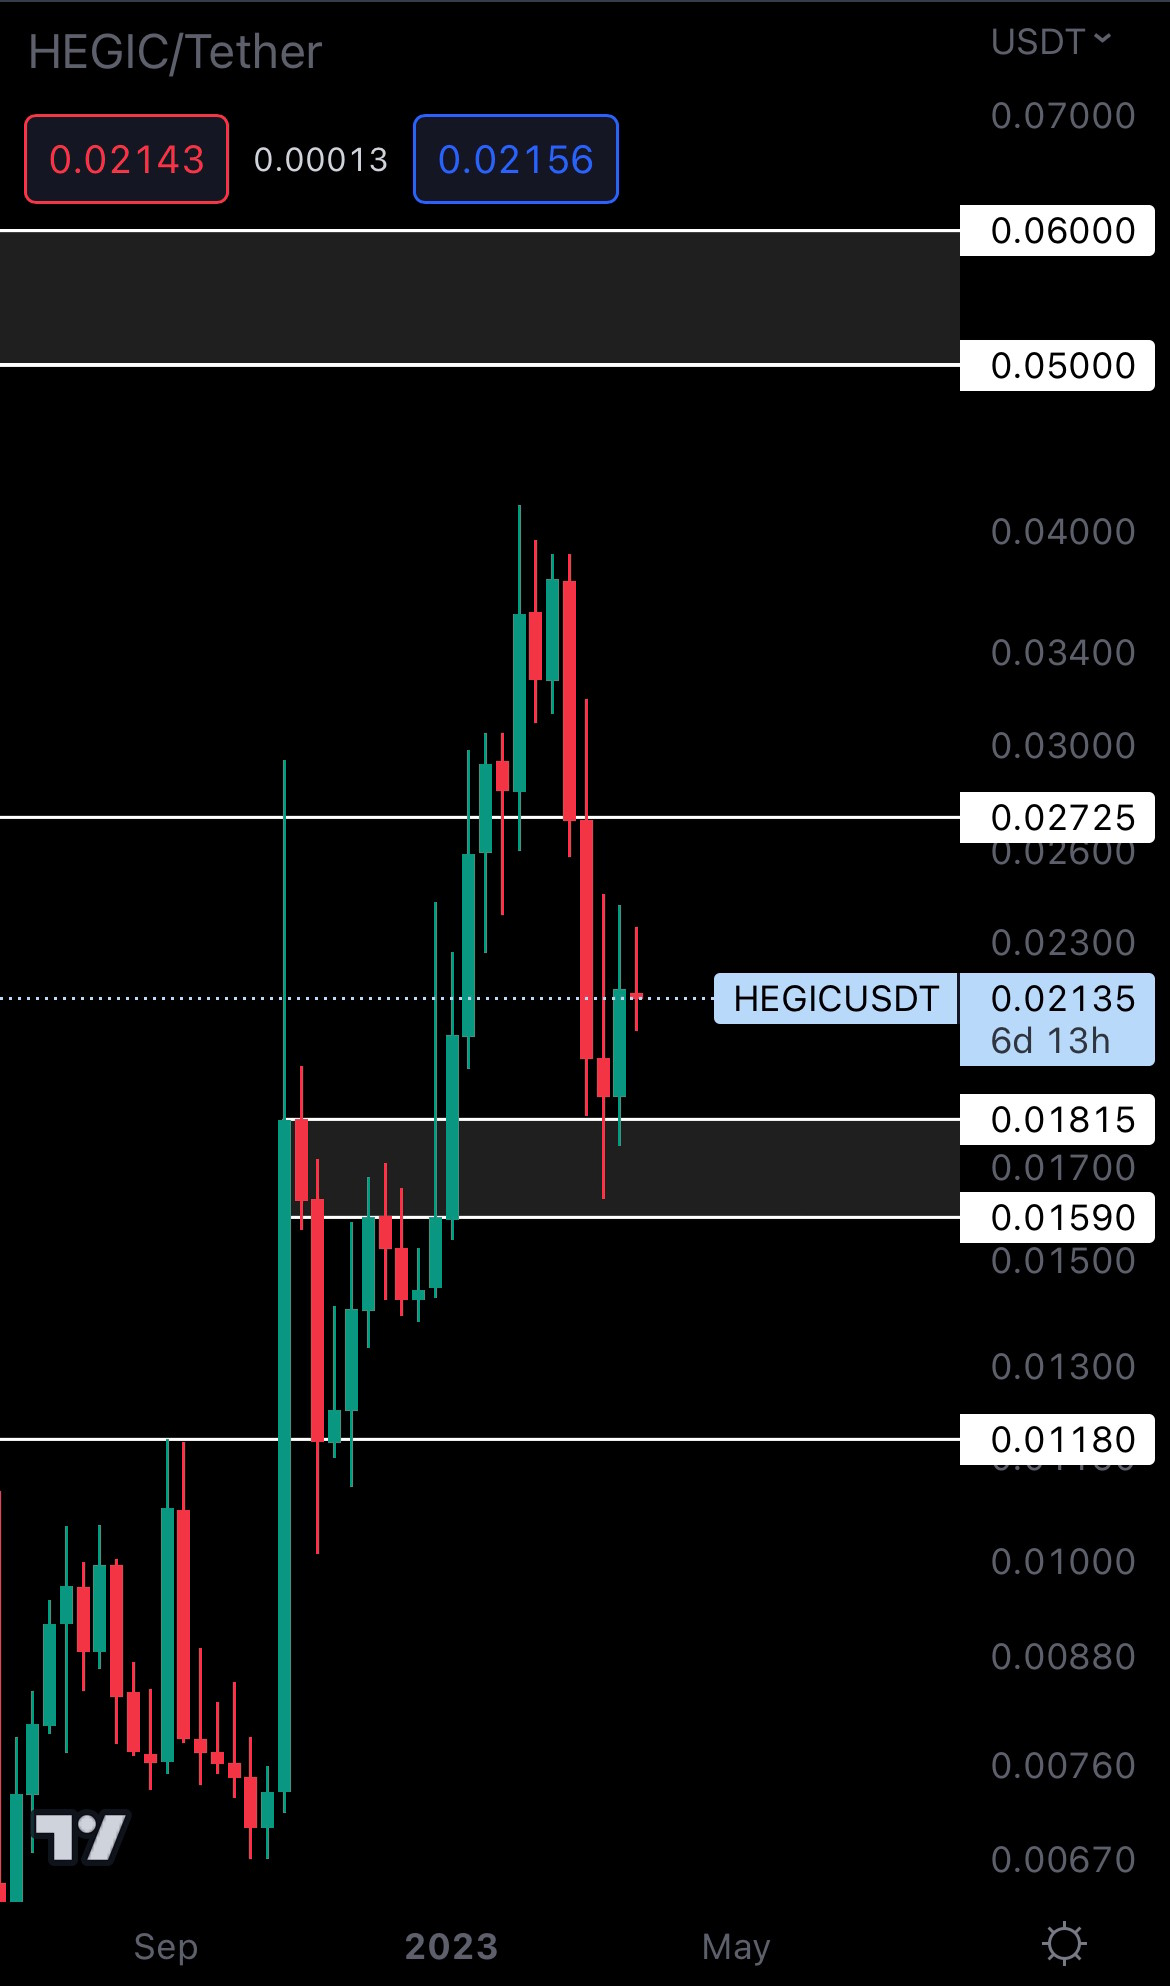
Because HEGIC bounced from support last week, a weekly higher low was marked in this area, keeping the market structure intact. From a technical standpoint, HEGIC is now on track for $0.02725 and will likely reach this level if BTC reaches to $30,000 and above.
PENDLE | Pendle (Weekly)
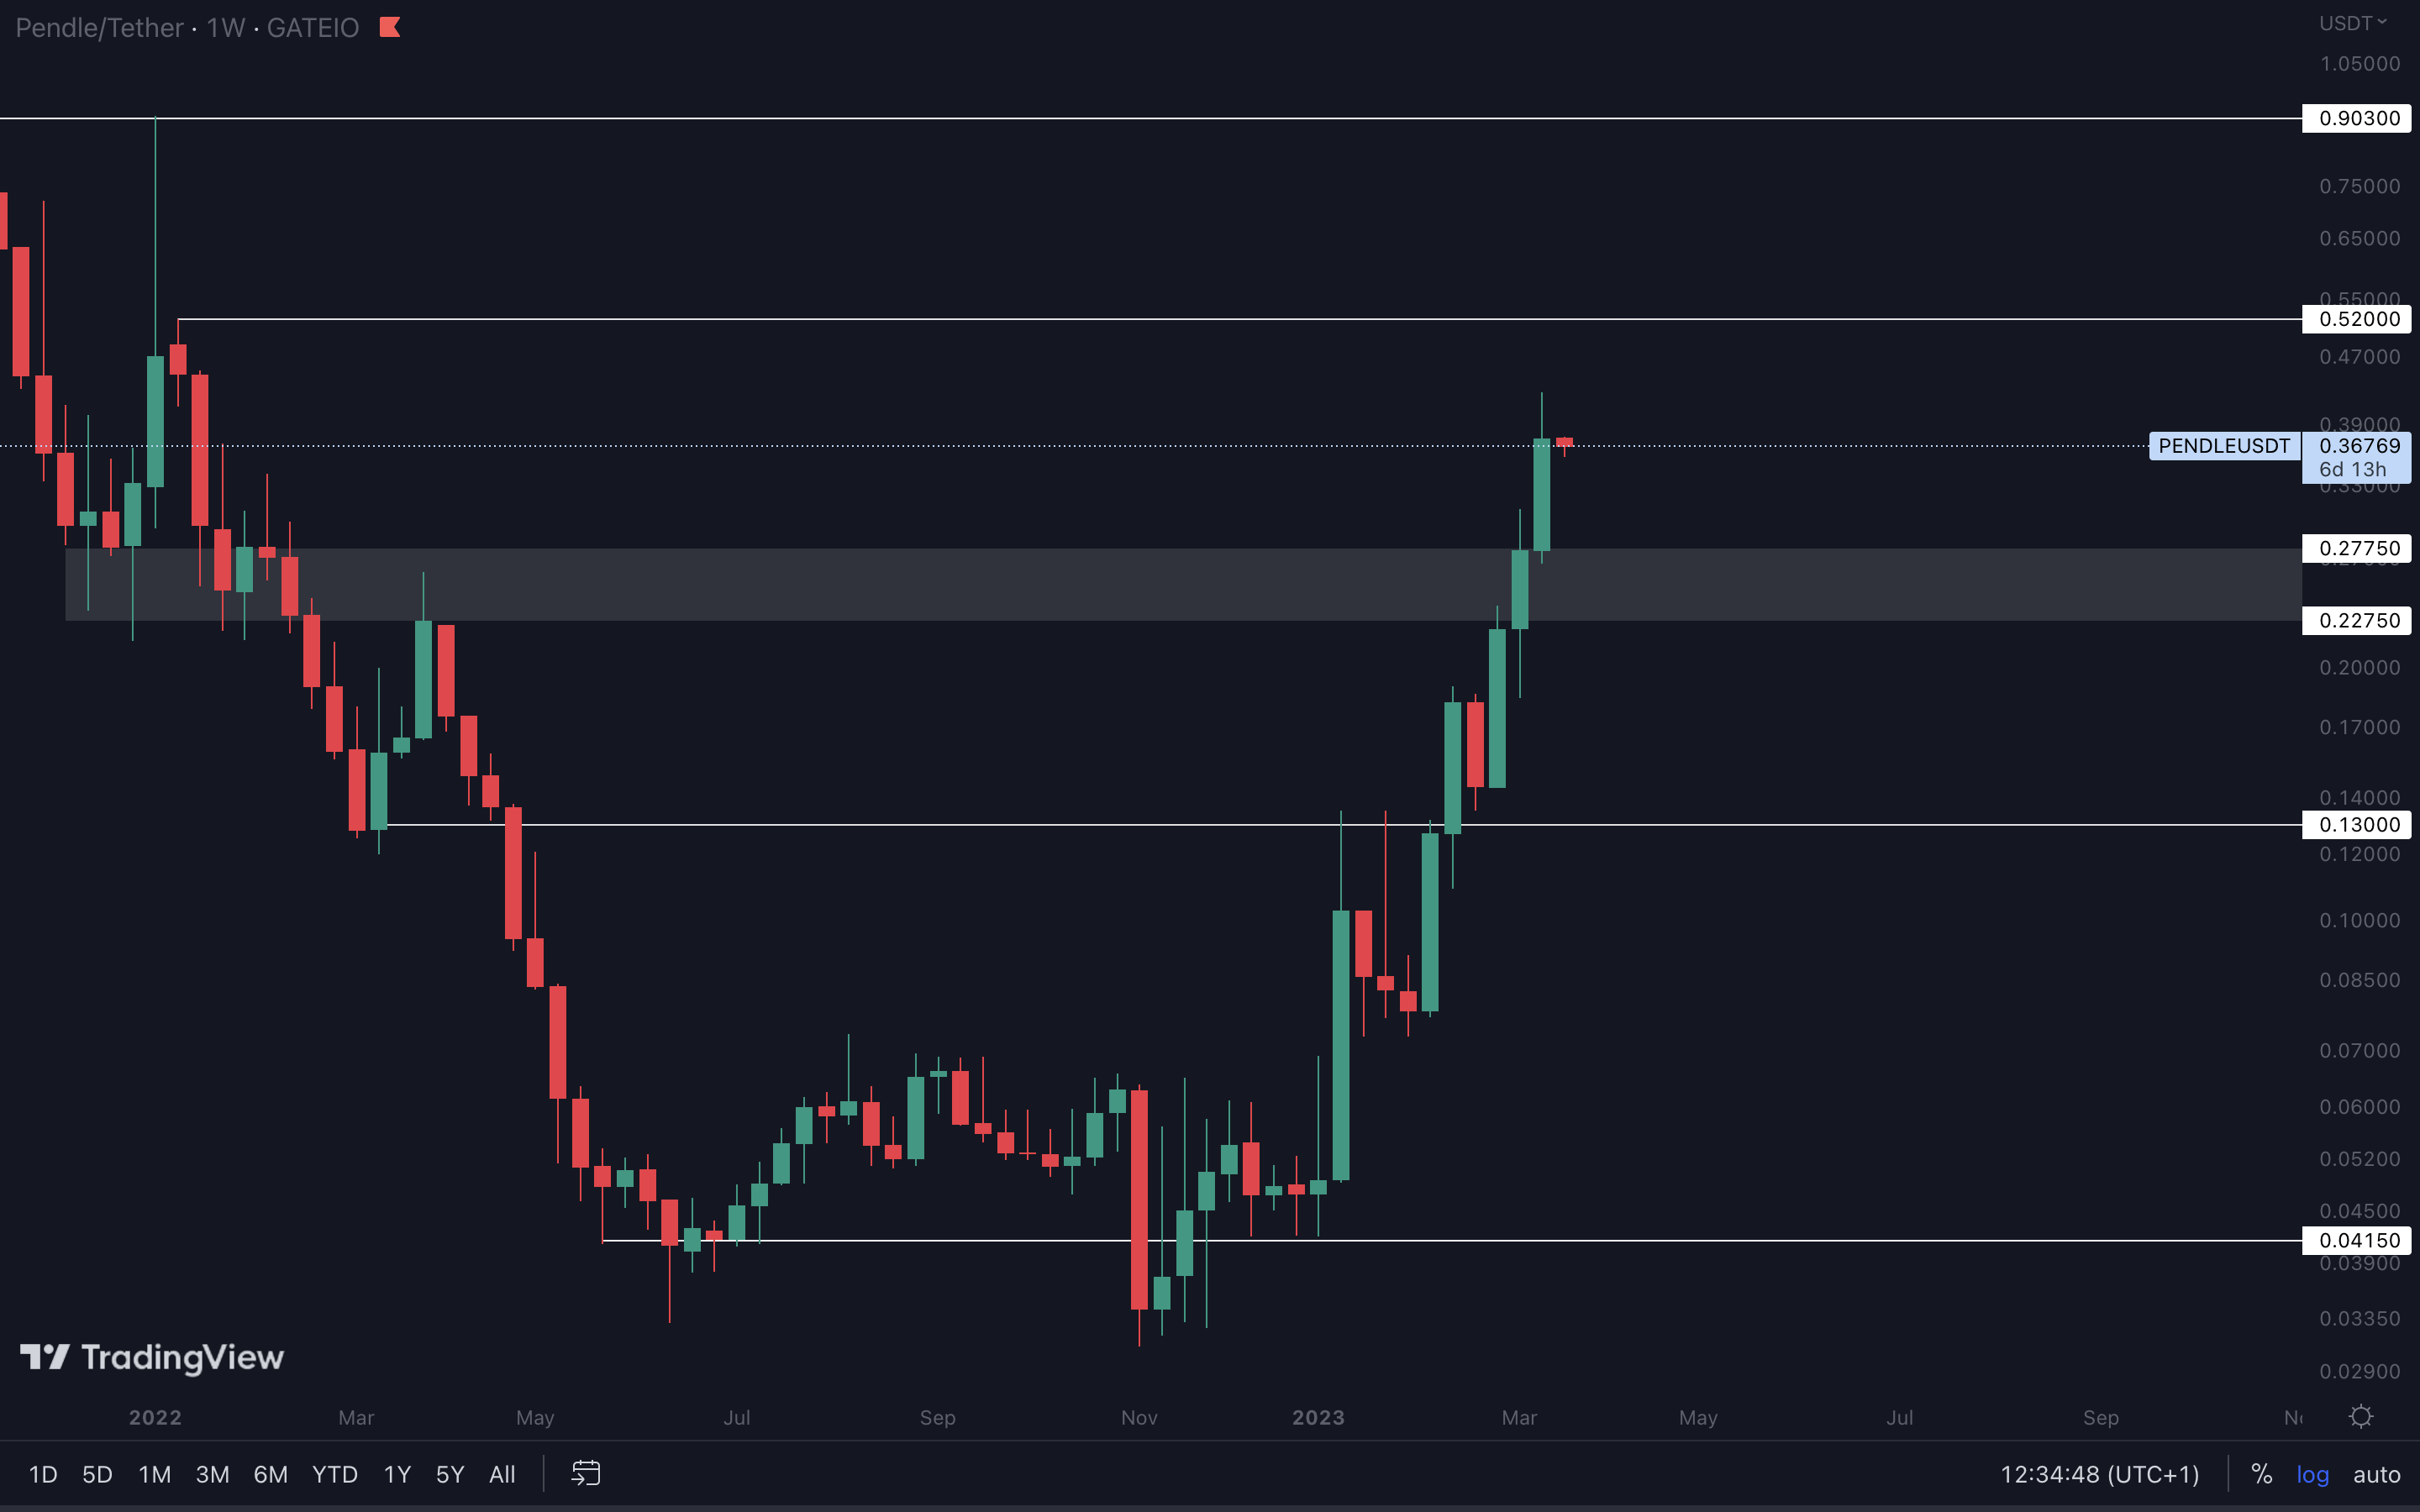

PENDLE is on a killing spree, and its victims are those who are selling right now. It flipped another area of resistance ($0.027750 - $0.022750), openingthe door for $0.52. We expect this level to be reached in March. If it is, we recommend securing profits from your short-term positions.
Cryptonary's Watchlist
DOT | Polkadot (Weekly)
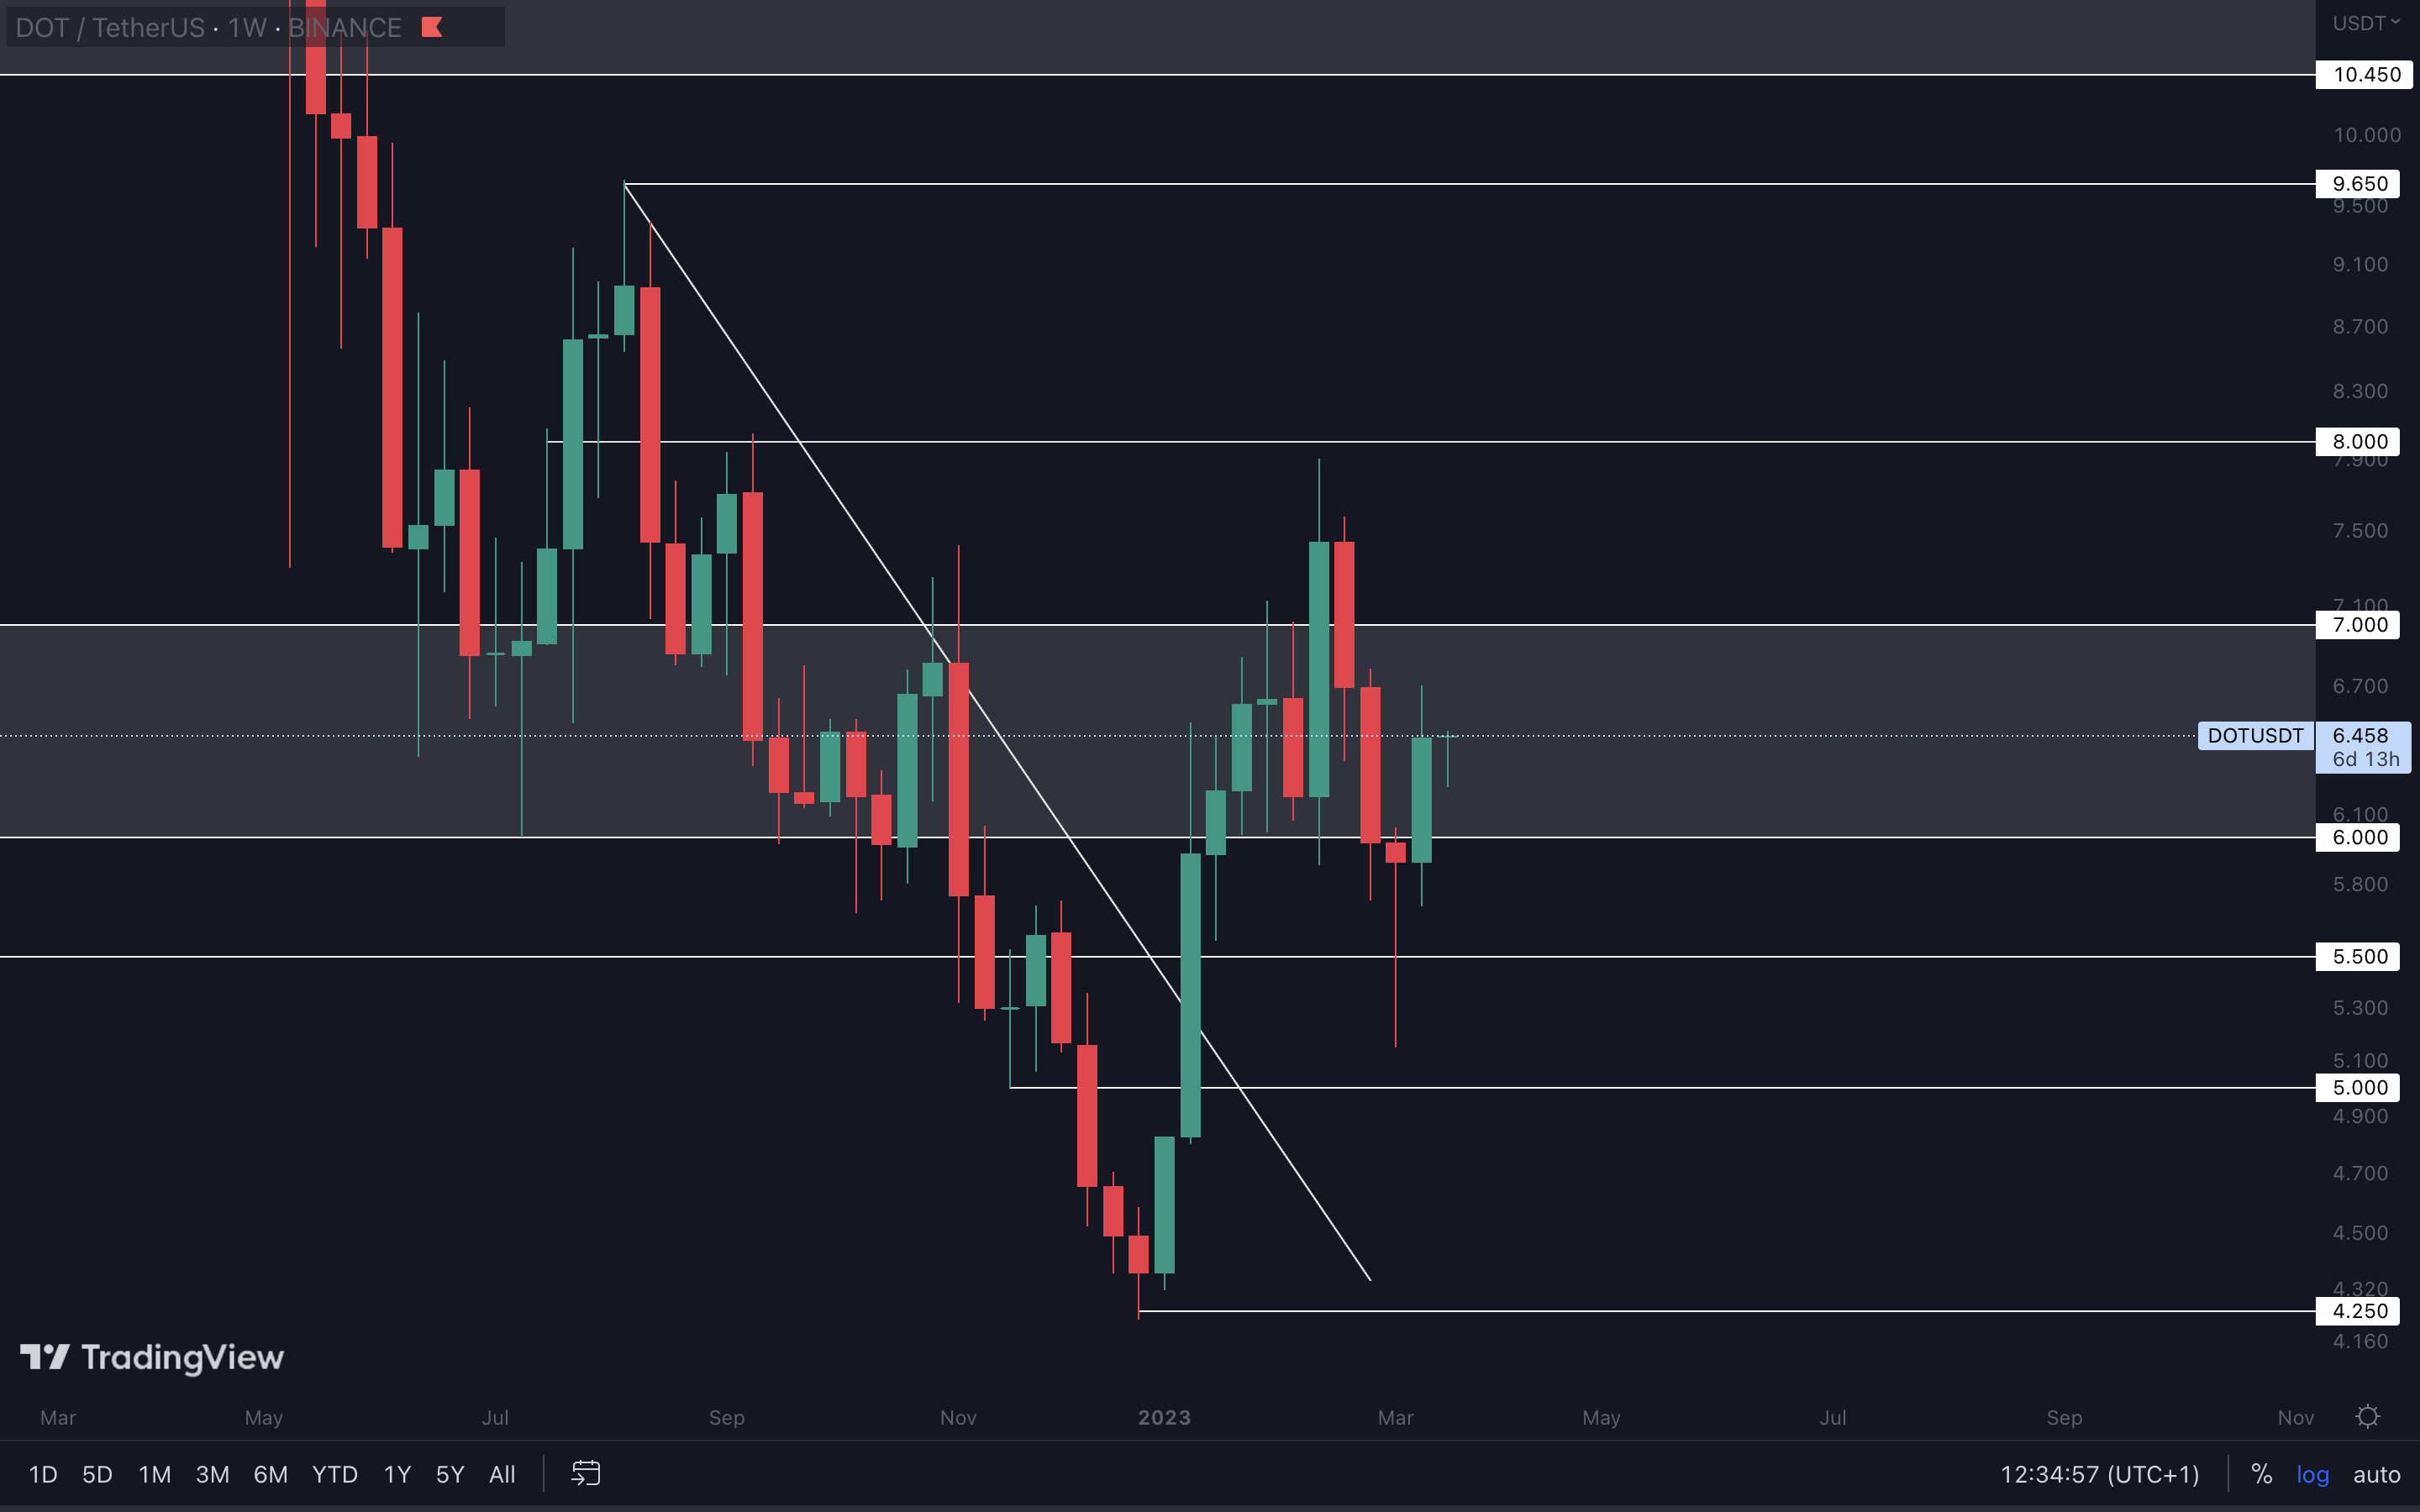
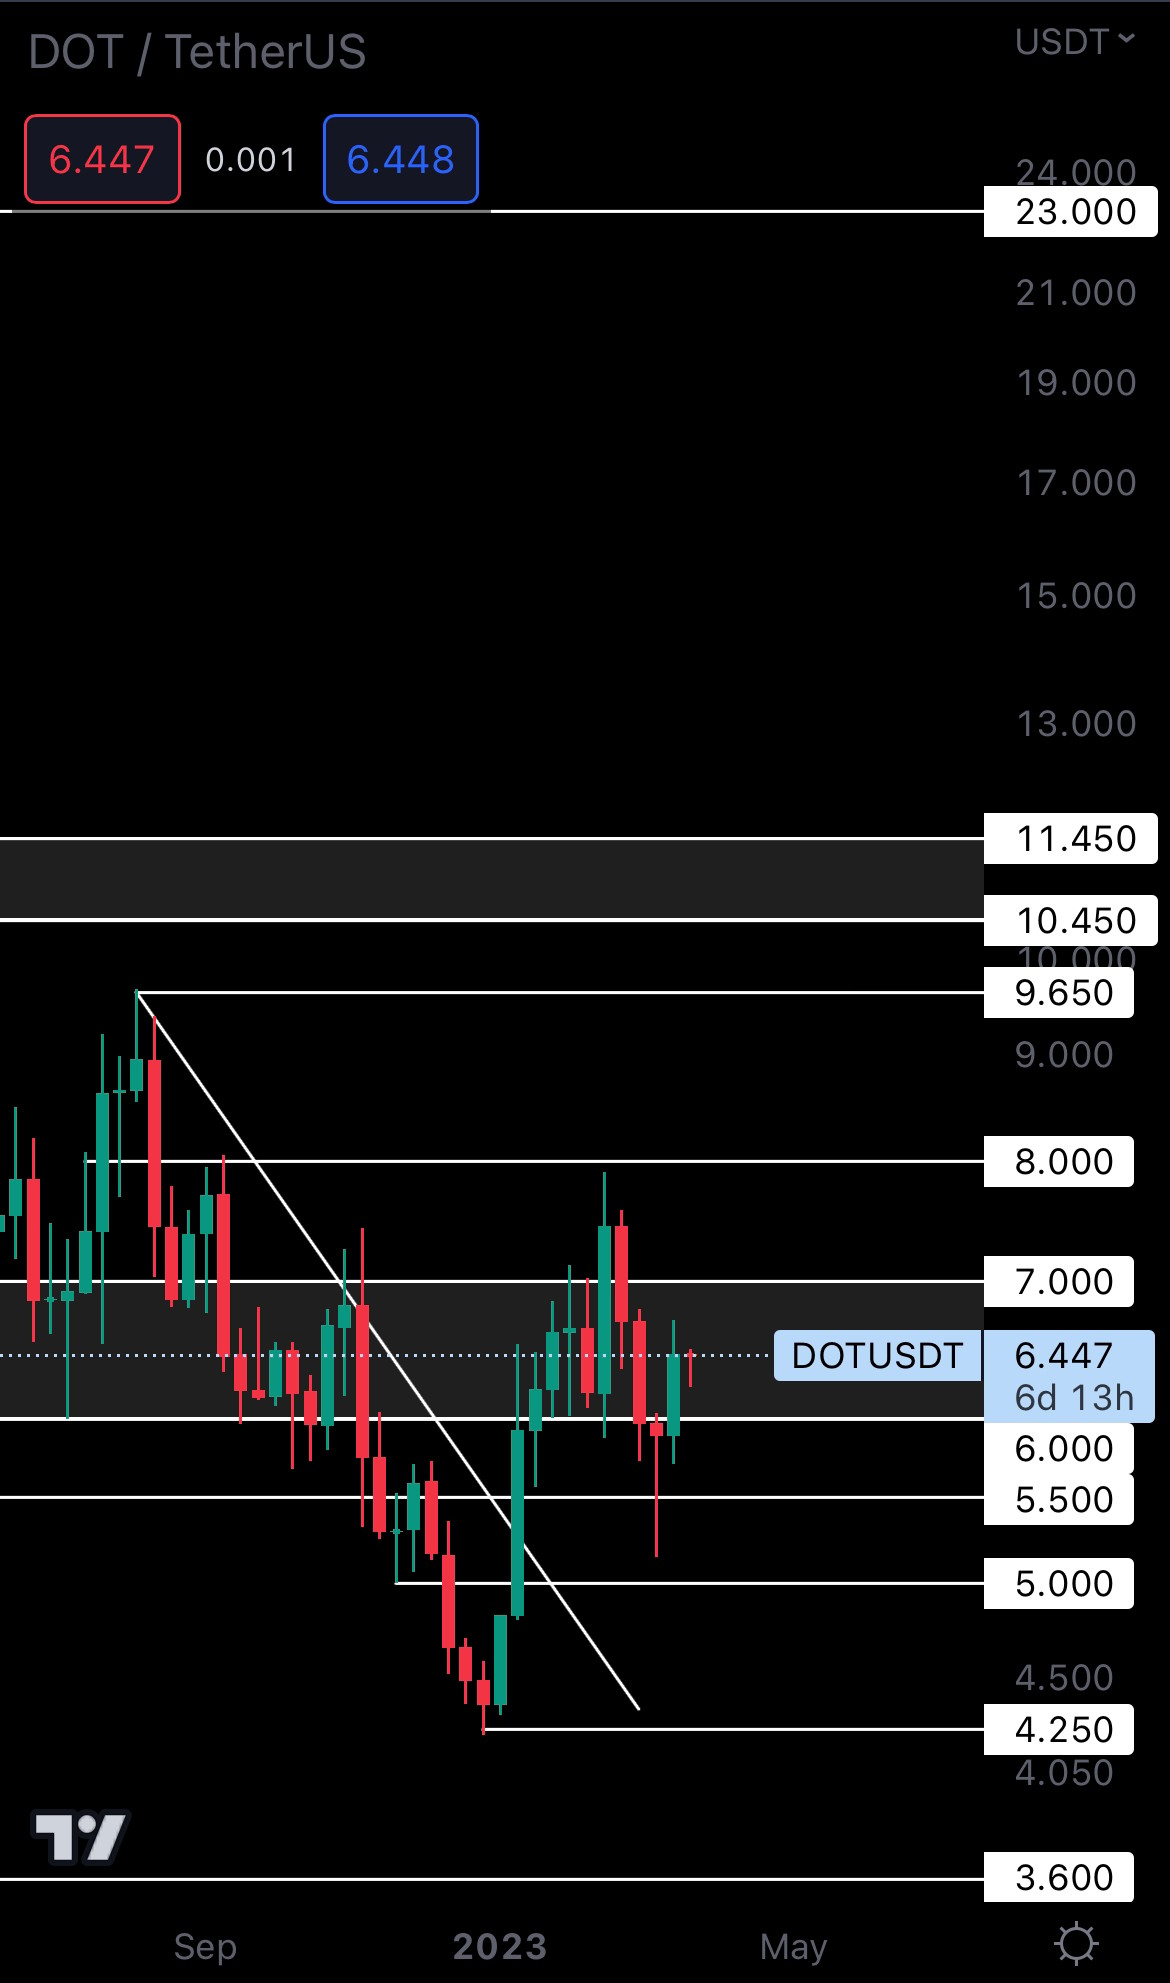
DOT reclaimed $6 as support, putting it on track for $7. Expect ranging between $6 and $7 until either one is broken. A weekly closure above $7 would result in DOT testing $8 shortly after.
RUNE | THORChain (Weekly)
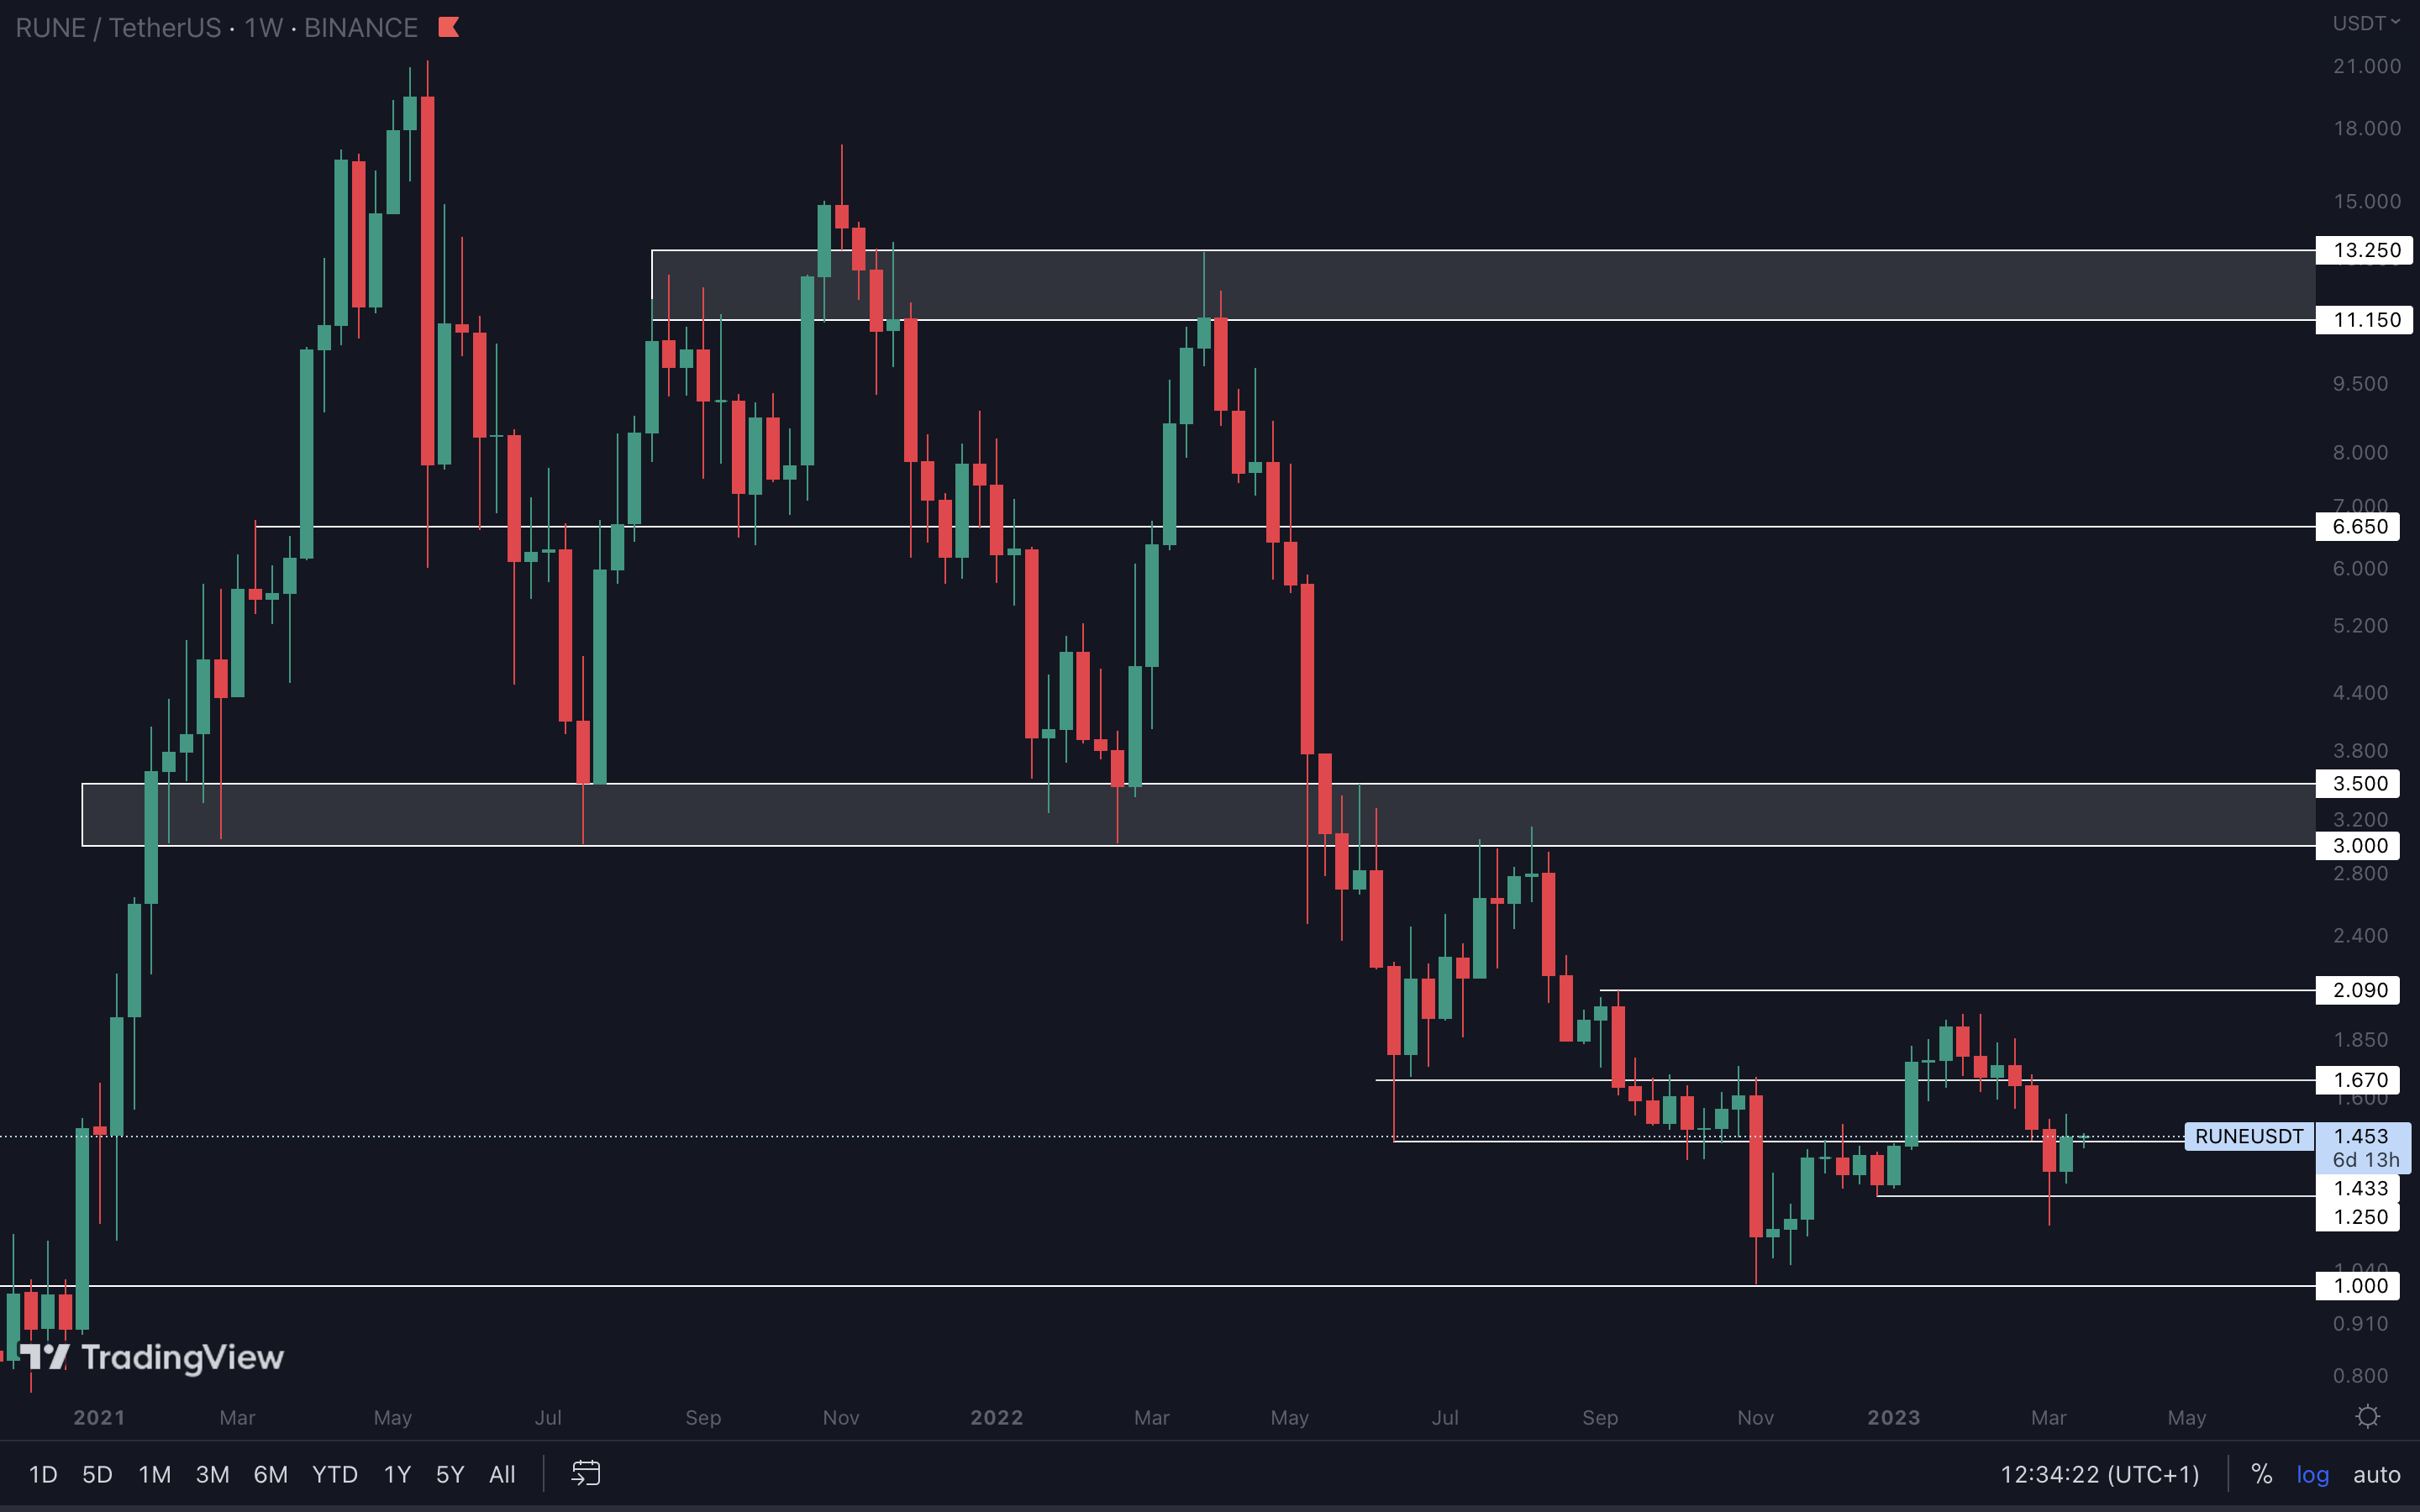
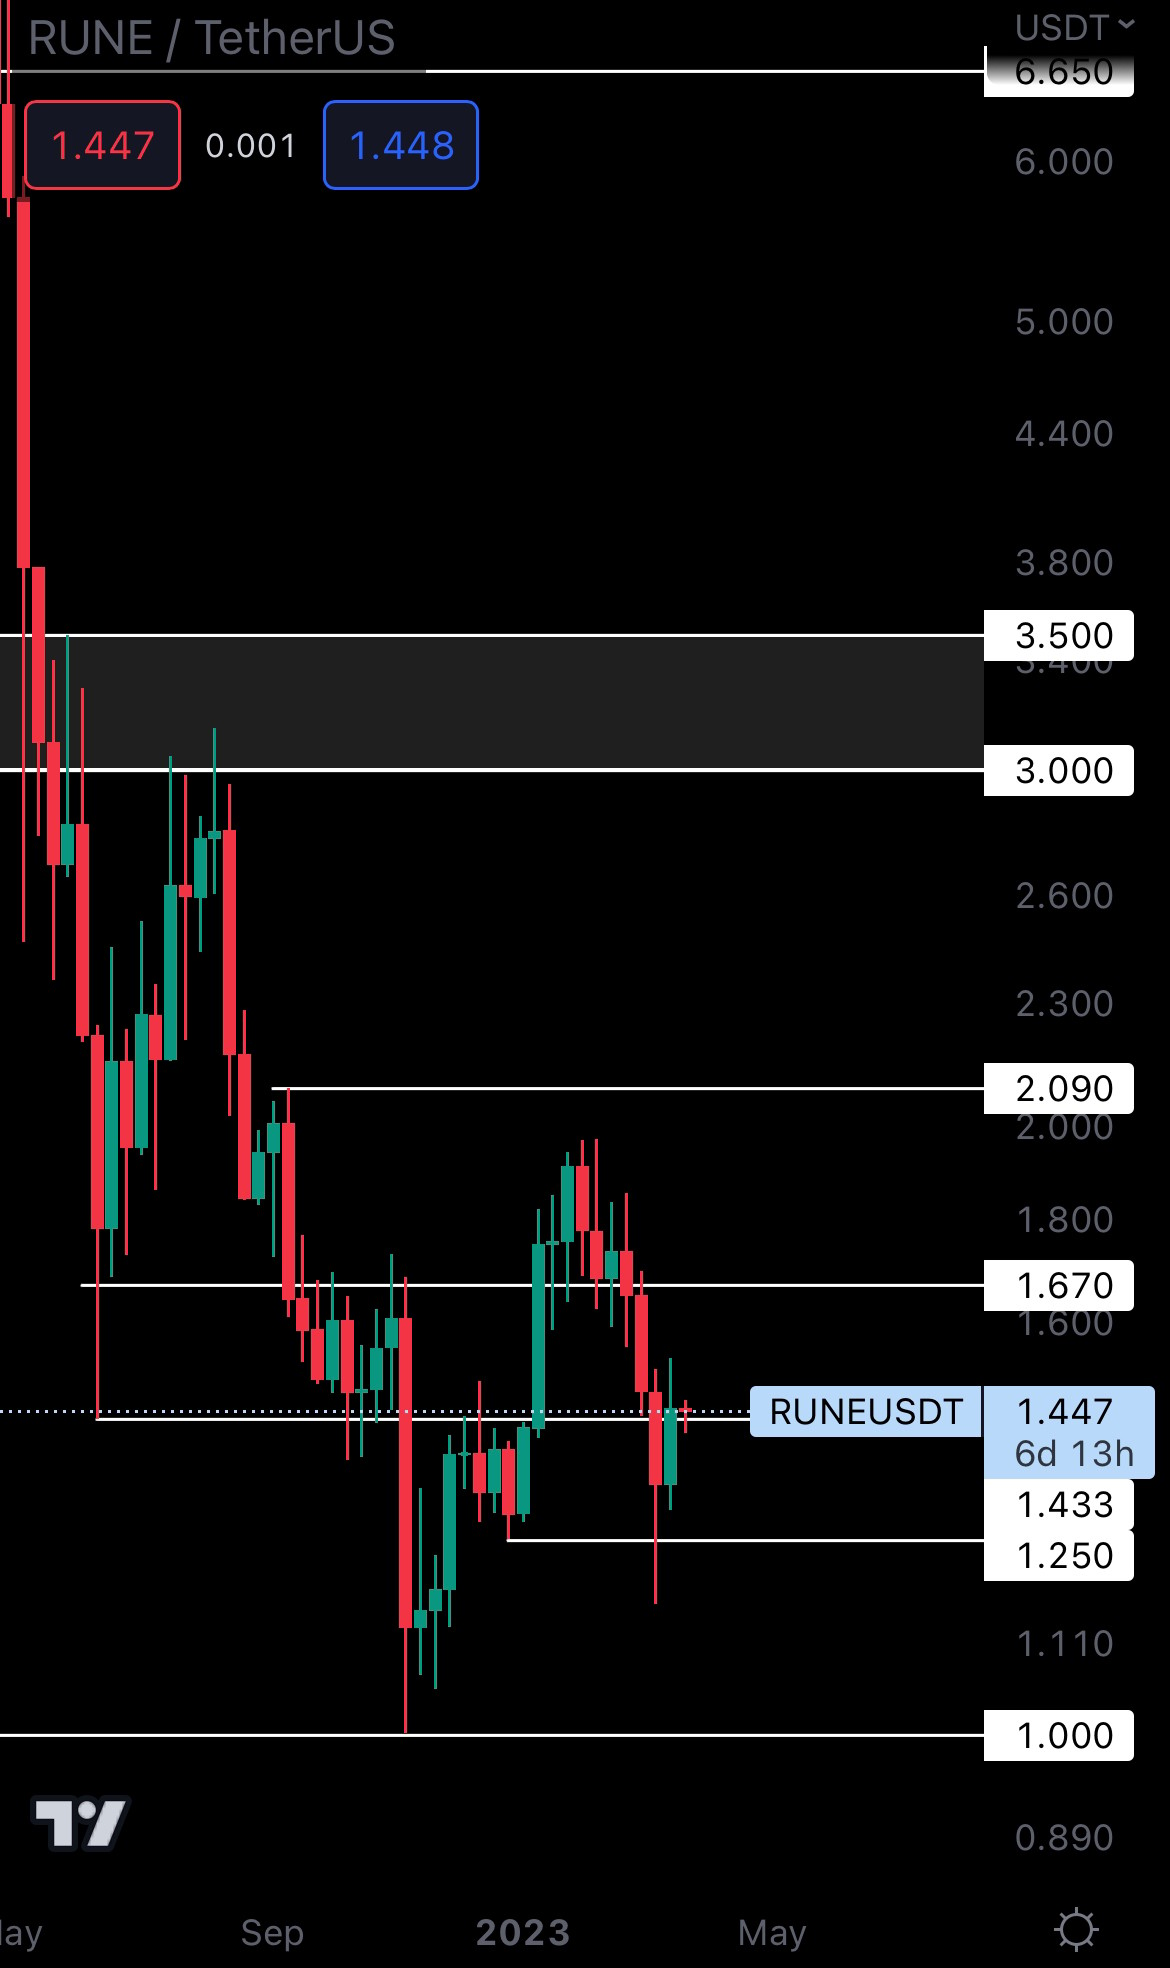
RUNE closed above resistance ($1.43) last week, potentially marking another weekly low that could push its price higher. After all, market structure is the backbone of price action. From a technical standpoint, holding $1.43 as support keeps the door open for $1.67.
SOL | Solana (Weekly)
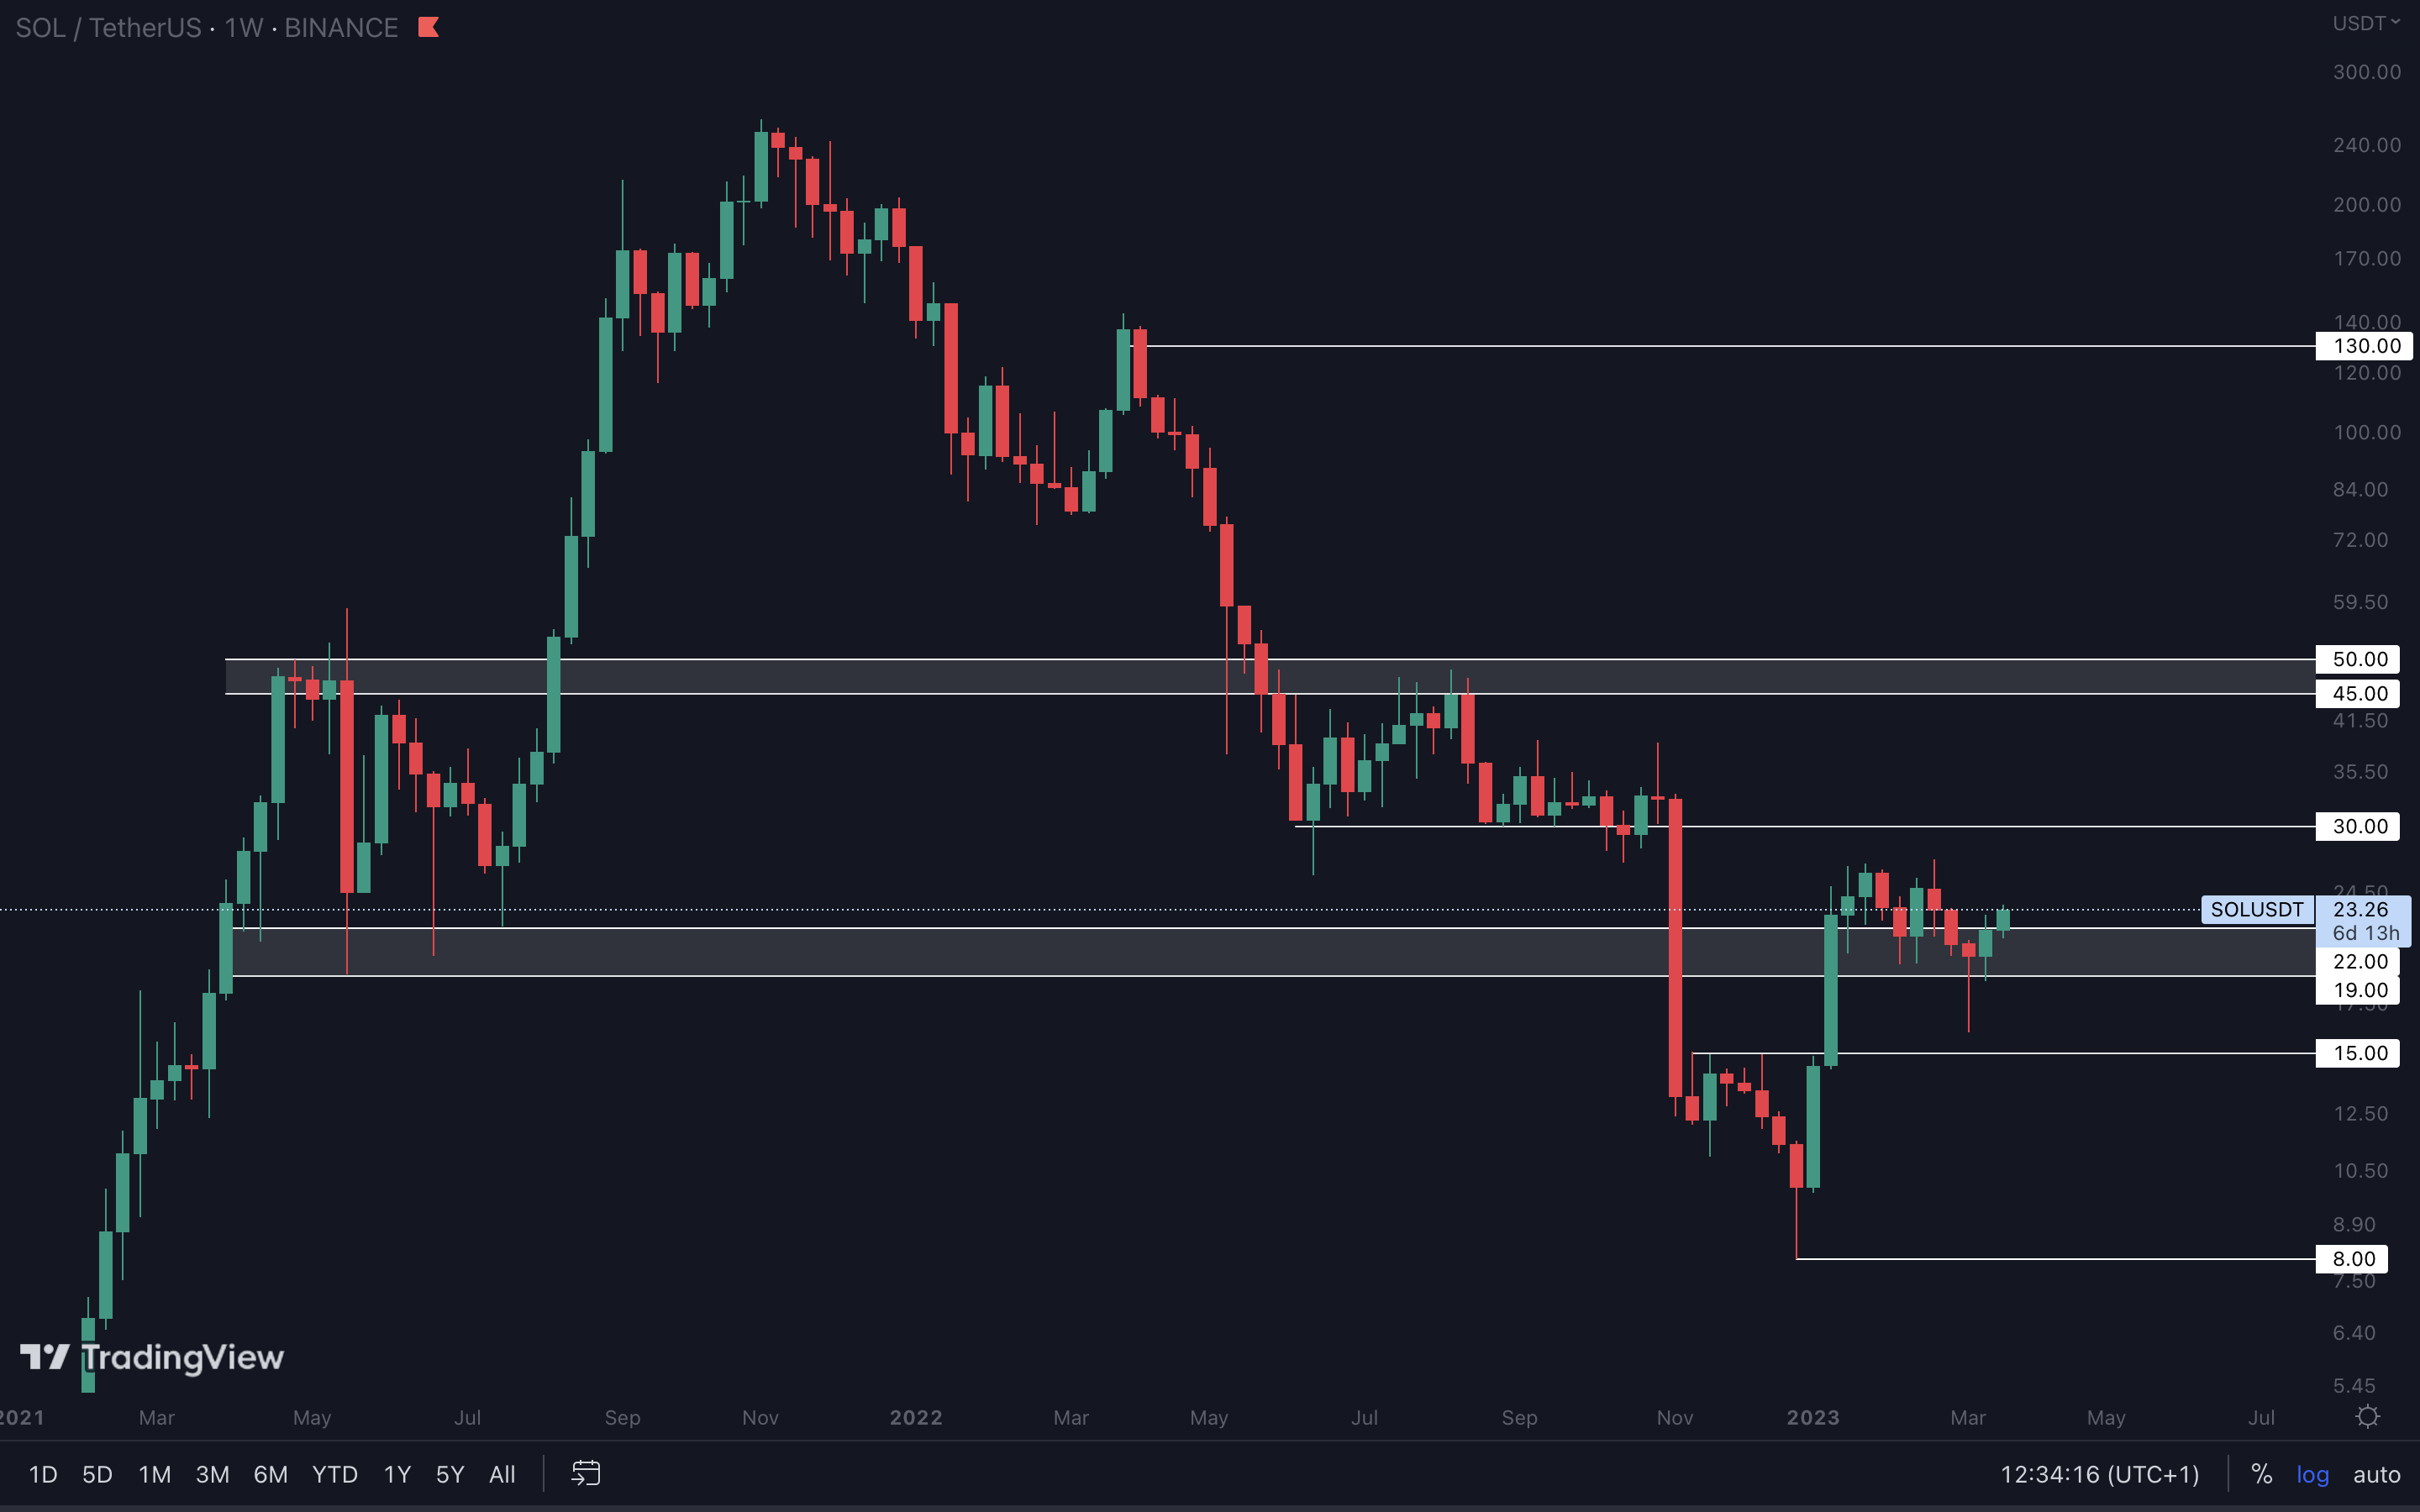
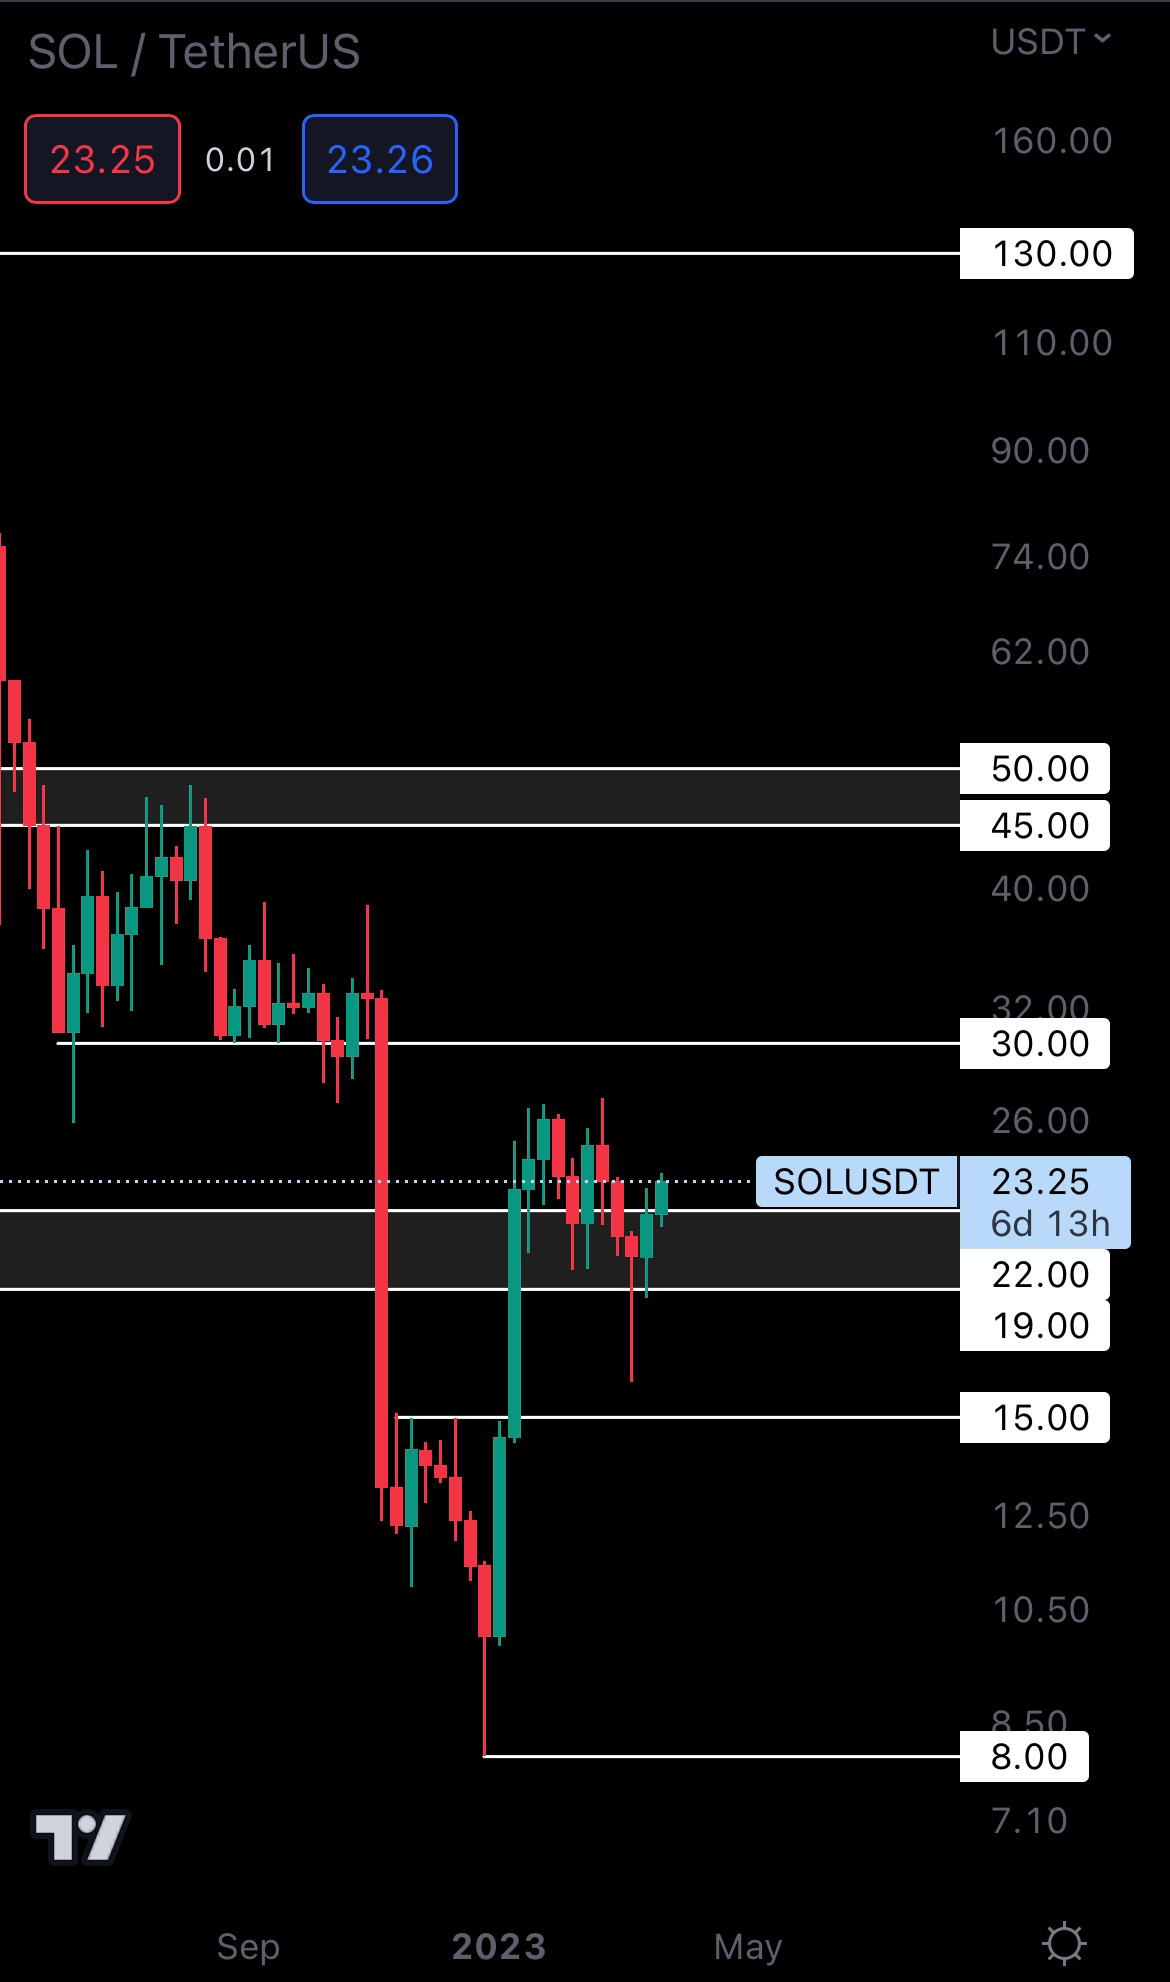
Despite the fact that SOL failed to close last week above $22 (top of the gray box), upside is still on the cards here given Bitcoin’s price action.. We believe SOL will head to $30 in the coming weeks, but a weekly closure above $22 would confirm this.
SNX | Synthetix (Weekly)
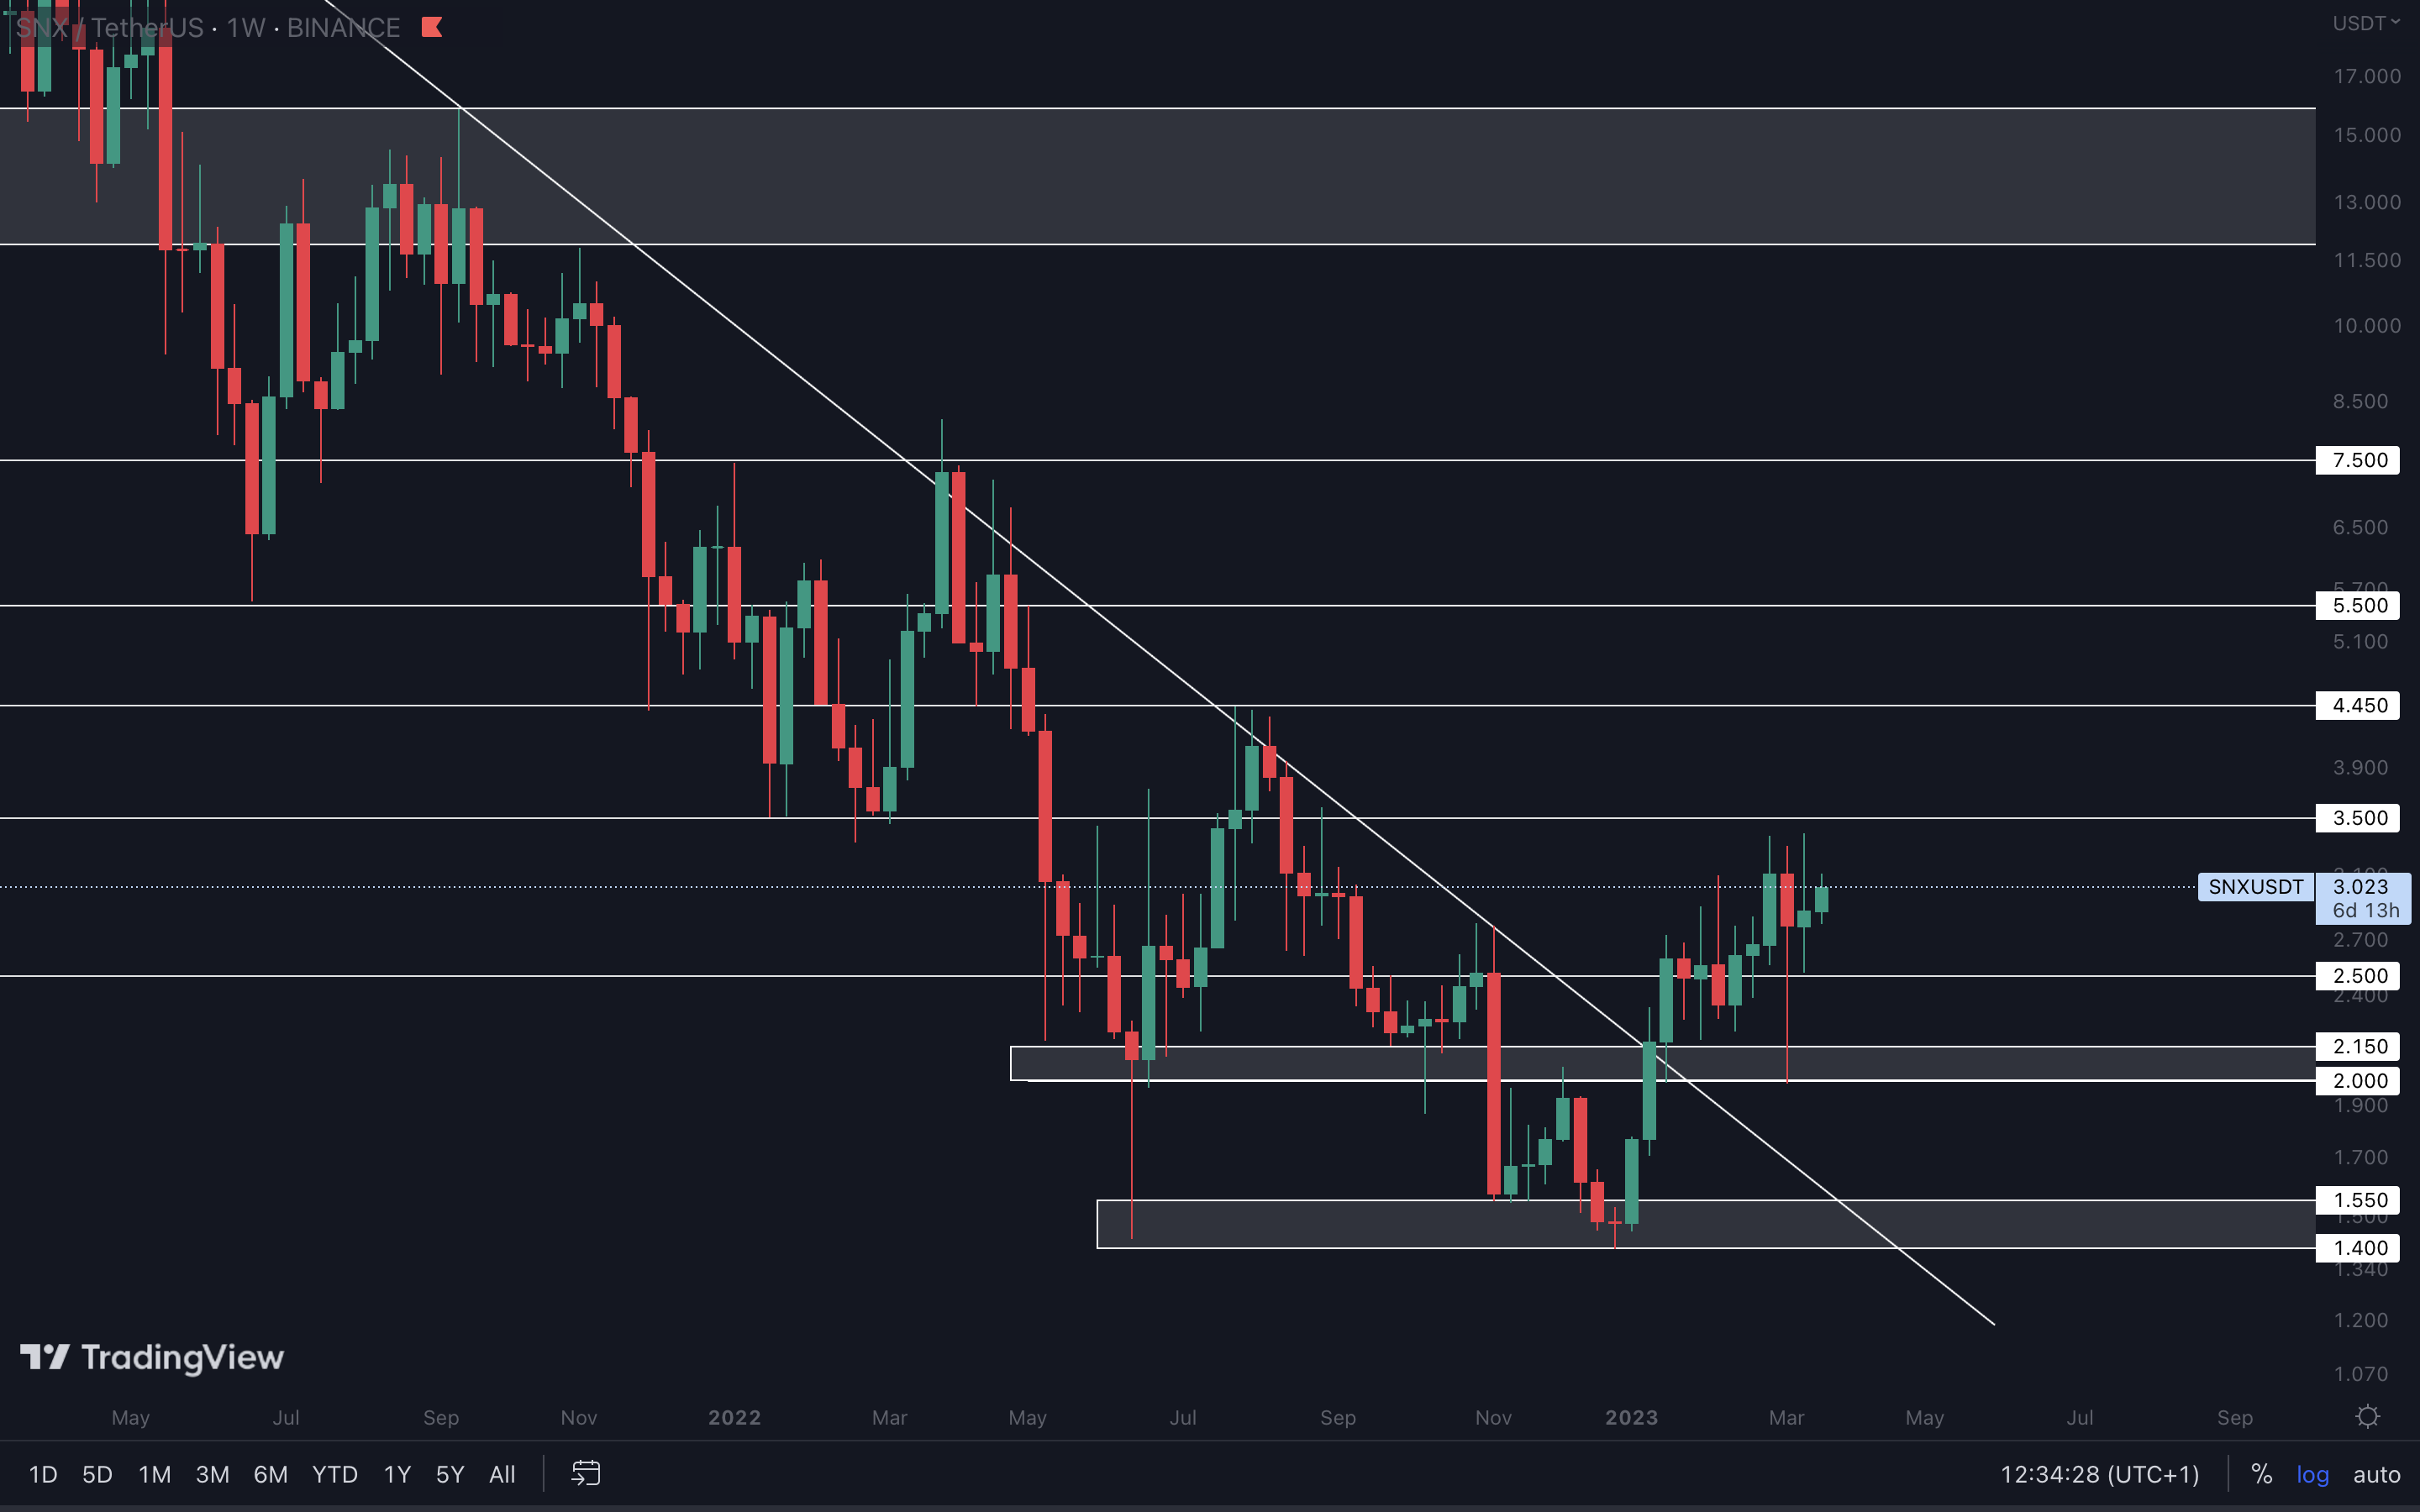
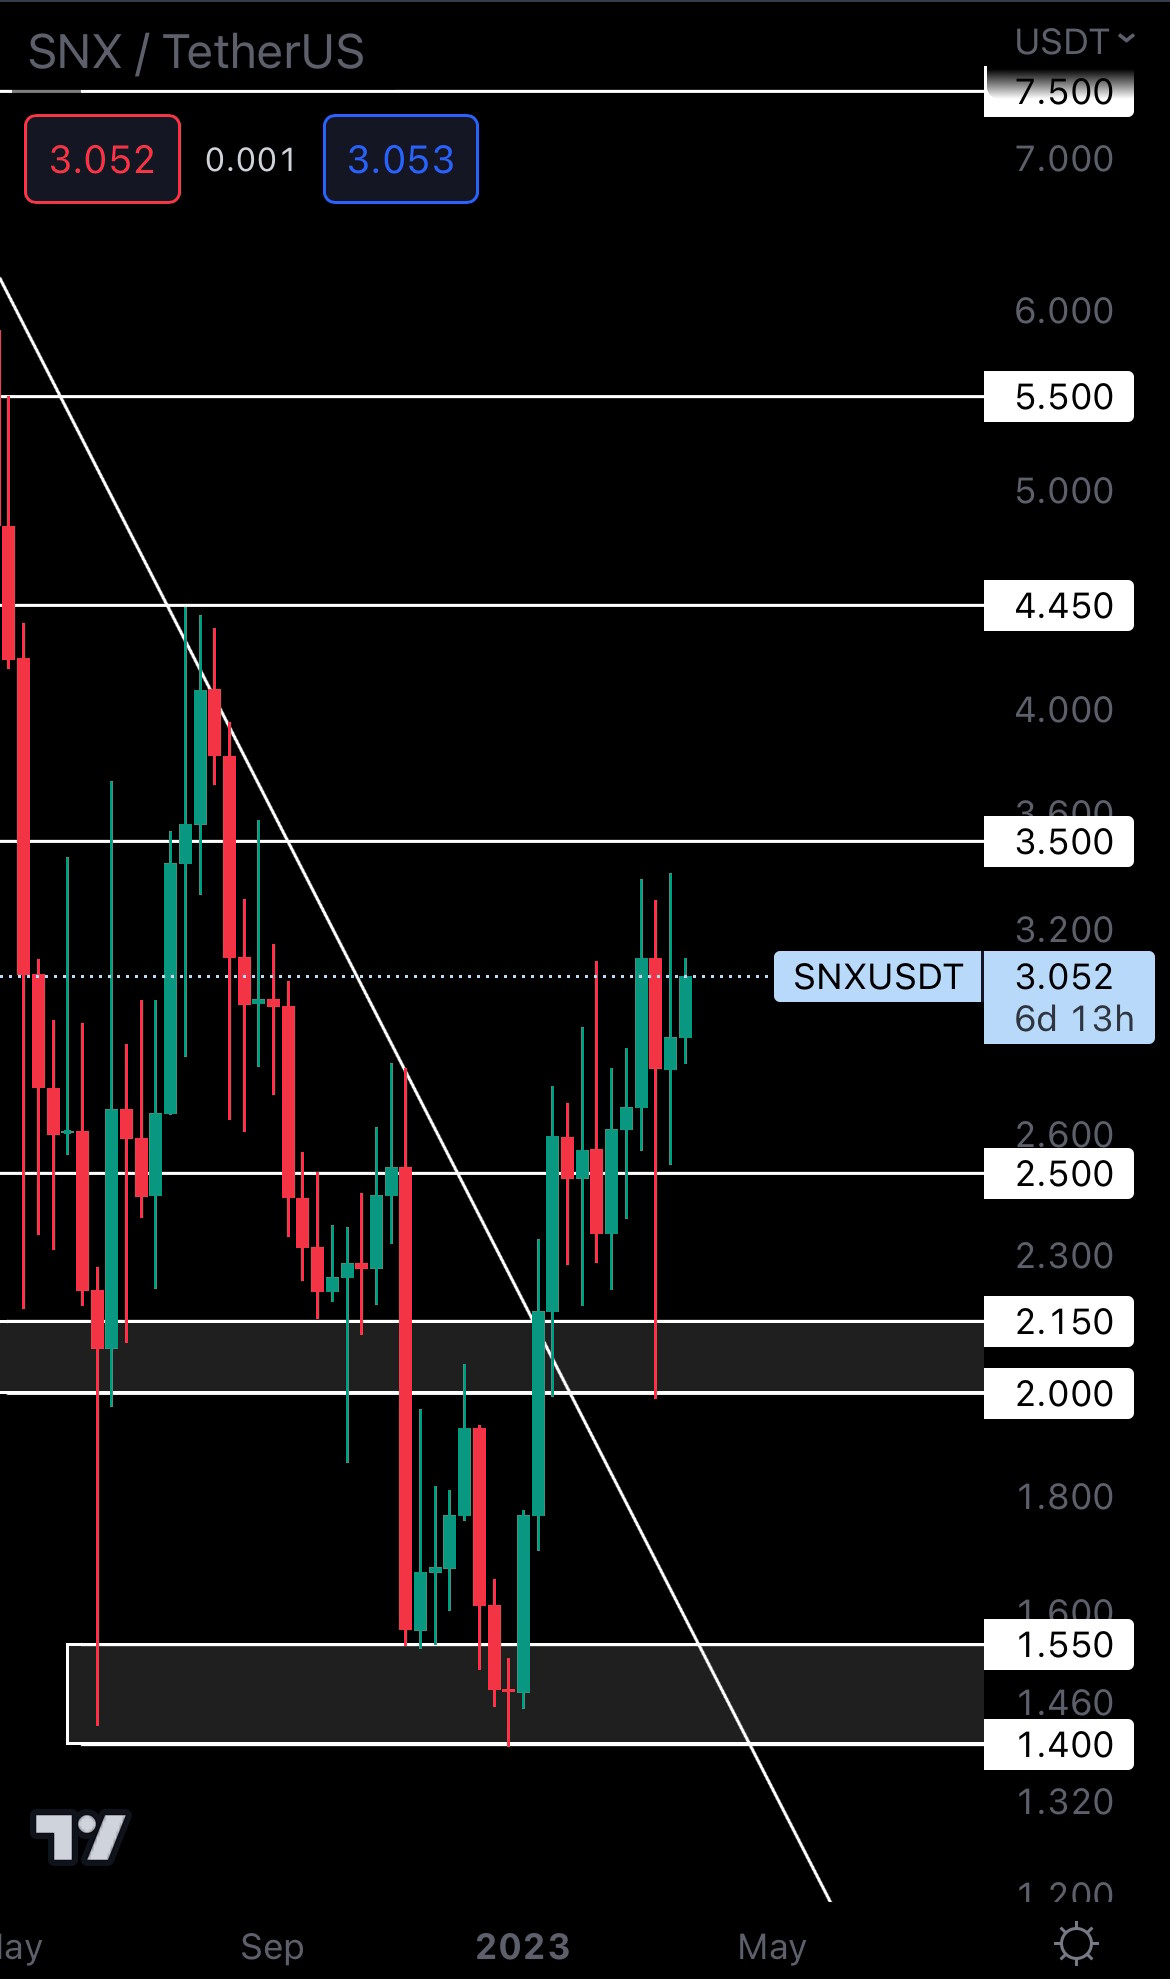 SNX has been quite volatile recently - long wicks, and short and long bodies. This type of price action isn’t something you’d want to trade without experience. Keep that in mind before deciding to jump in on SNX in the short-term.
From a technical standpoint, SNX remains on track for $3.50 and only a weekly loss of $2.50 would invalidate this scenario.
MINA | Mina Protocol (Weekly)
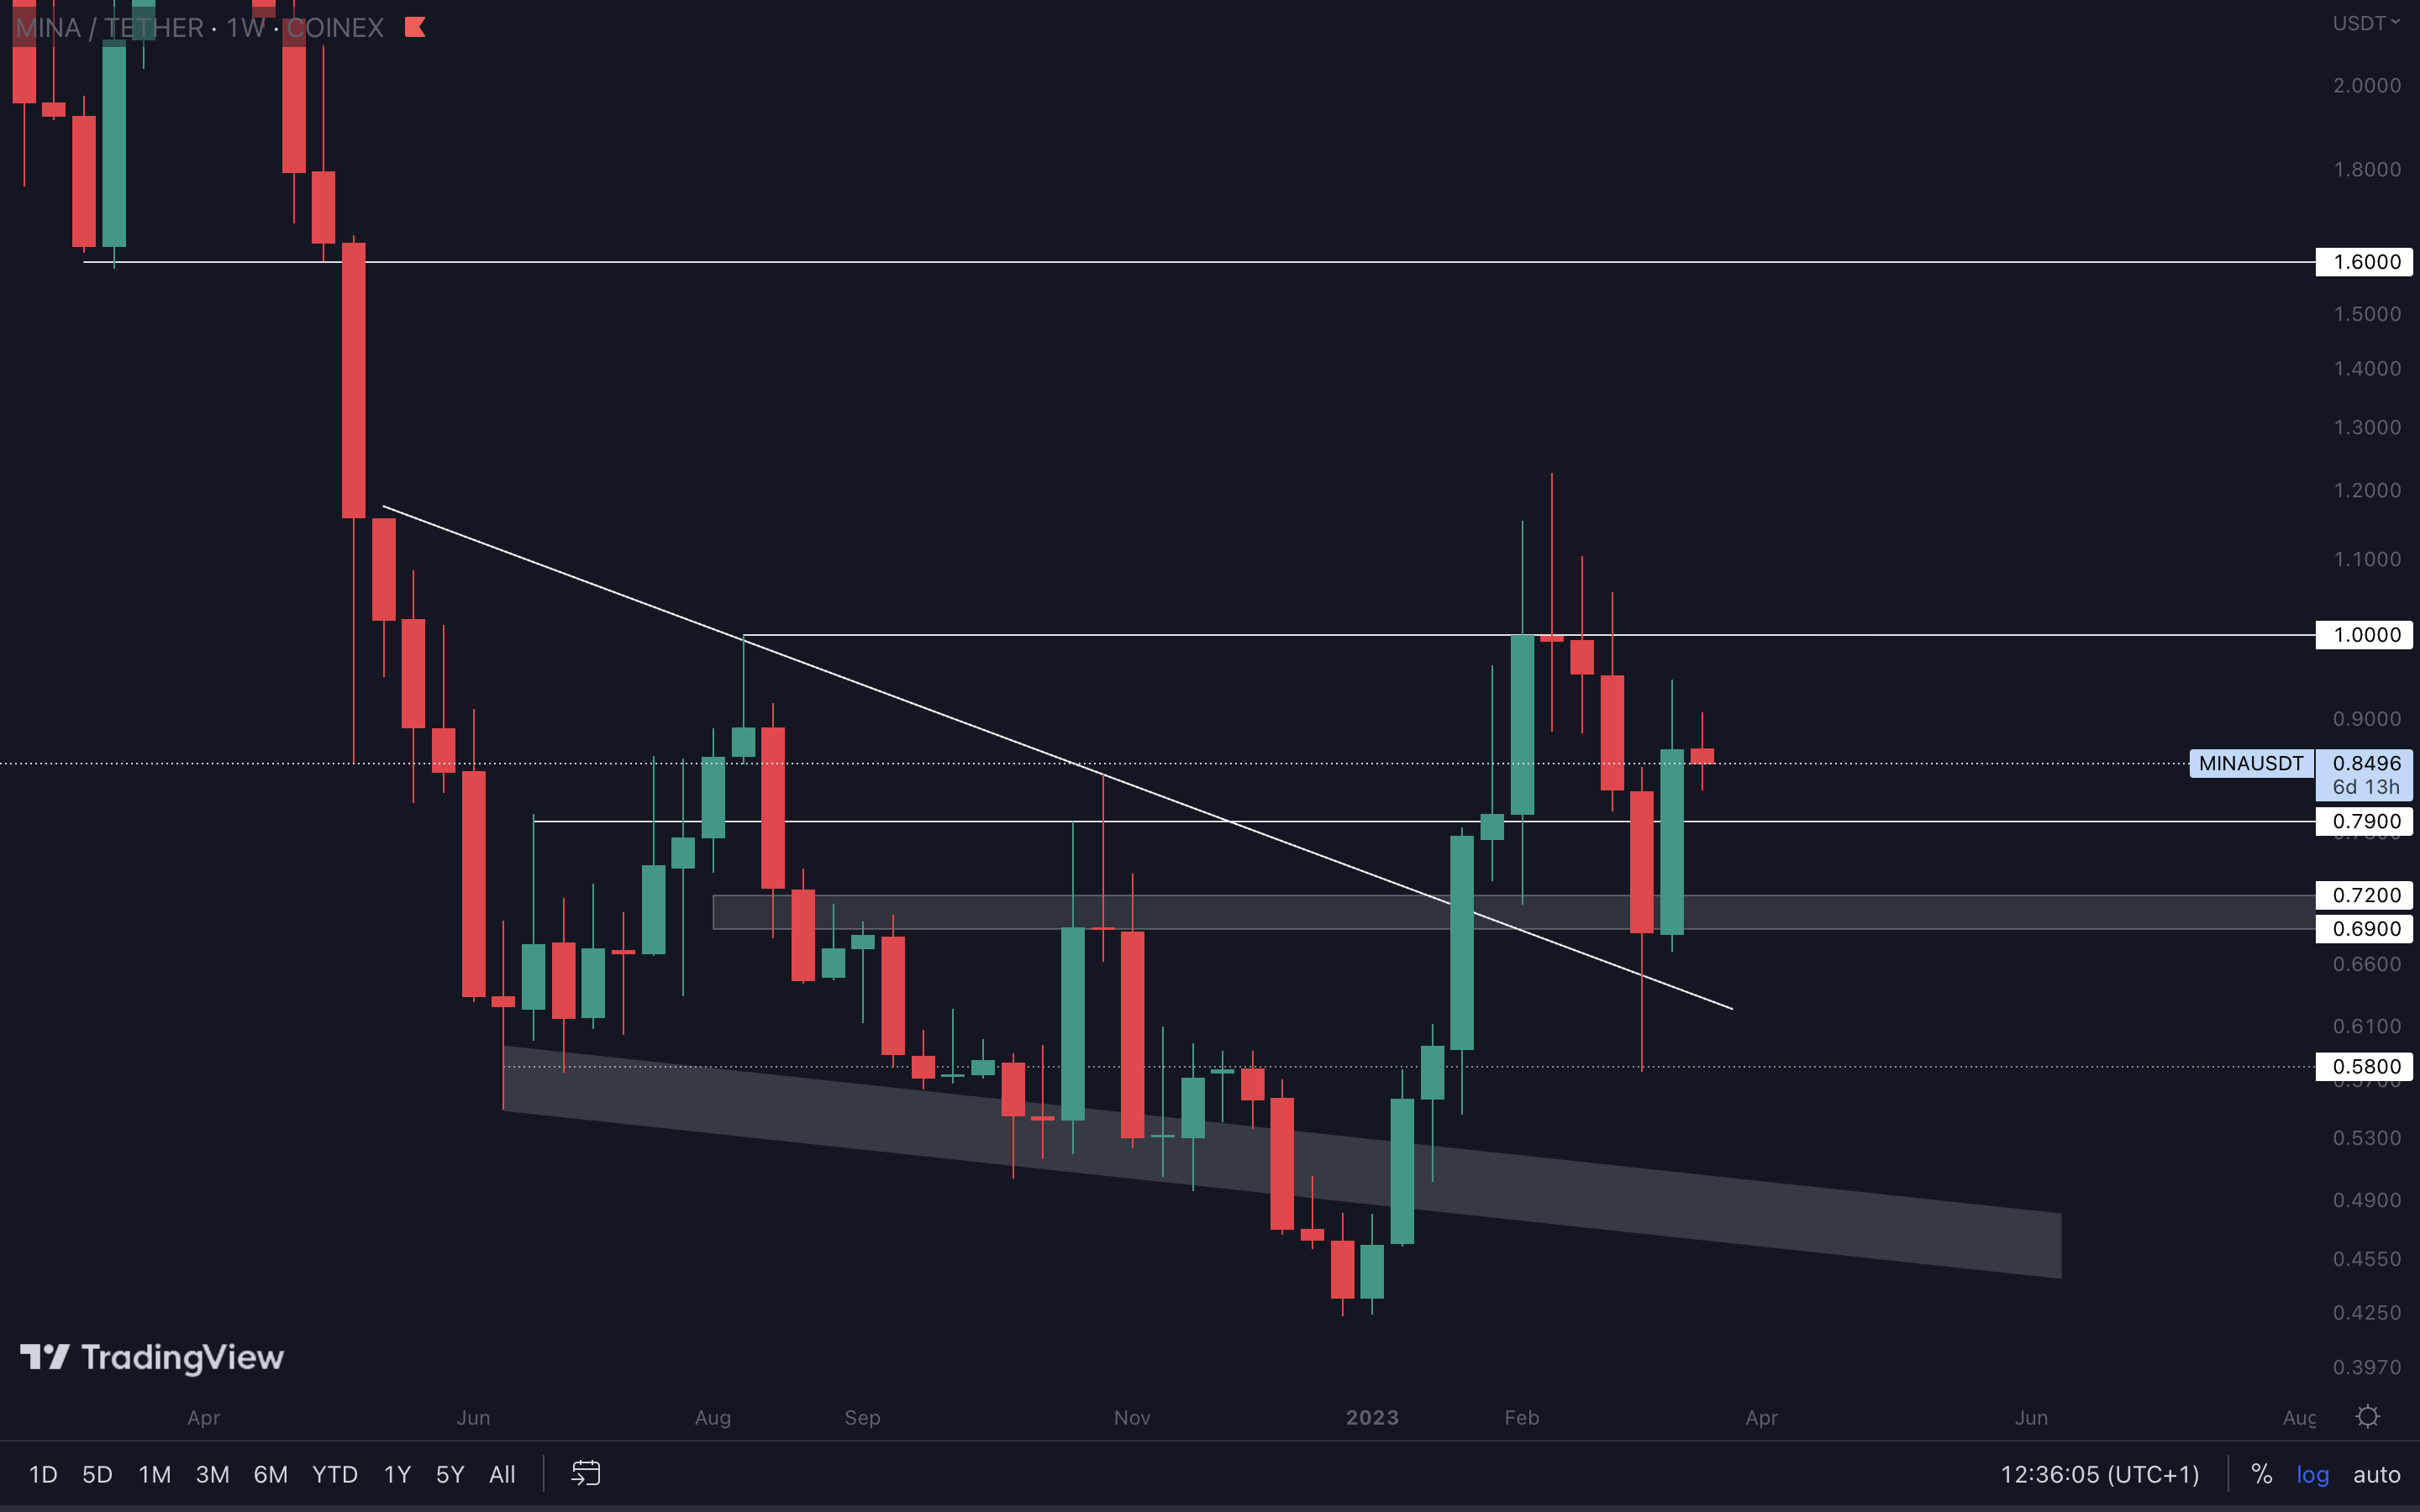
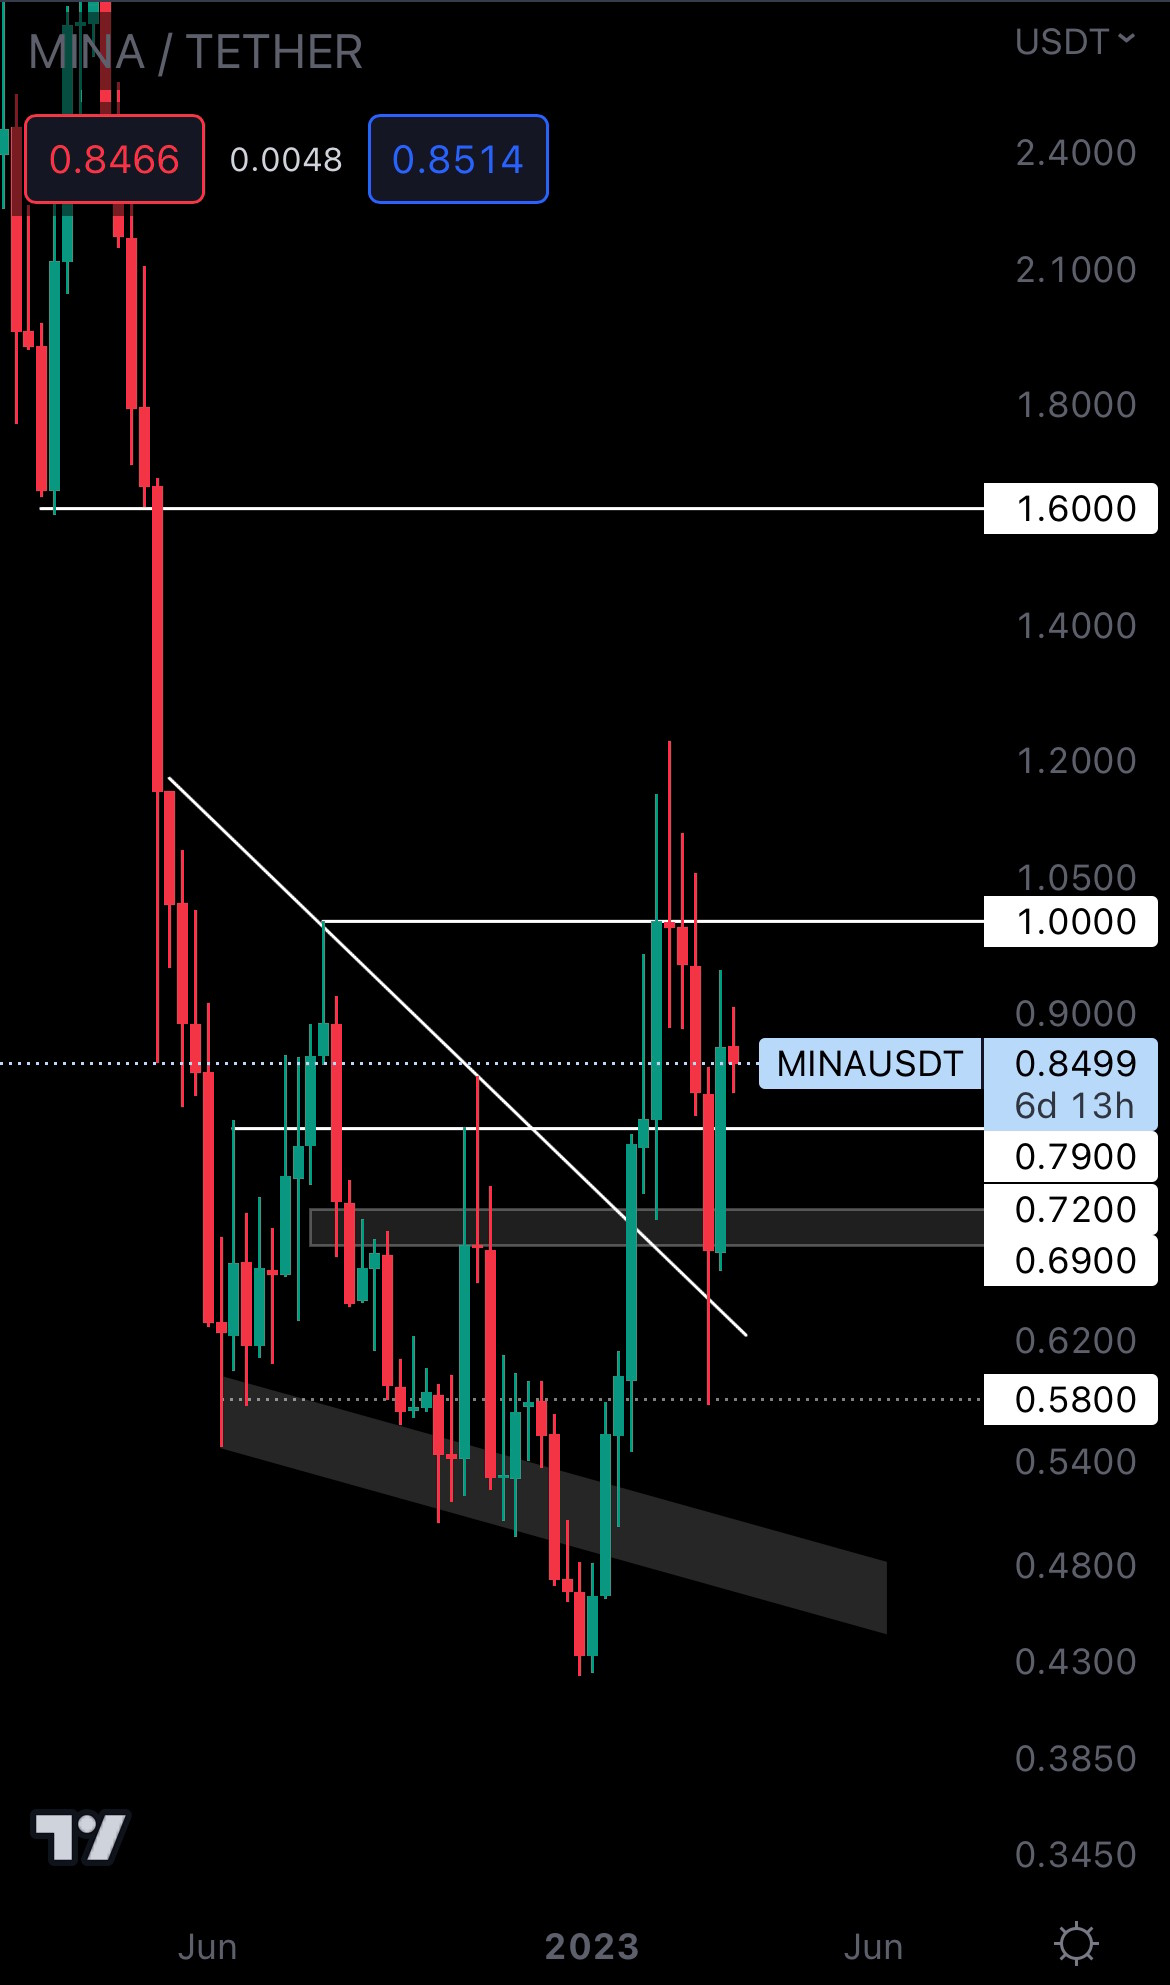
MINA closed as a bullish engulfing above resistance ($0.79) last week, which puts $1 on track. An invalidation of this scenario would occur if MINA closes a weekly candle under $0.79. However, this is unlikely given the current market performance and expectations.
ASTR | Astar Network (Weekly)

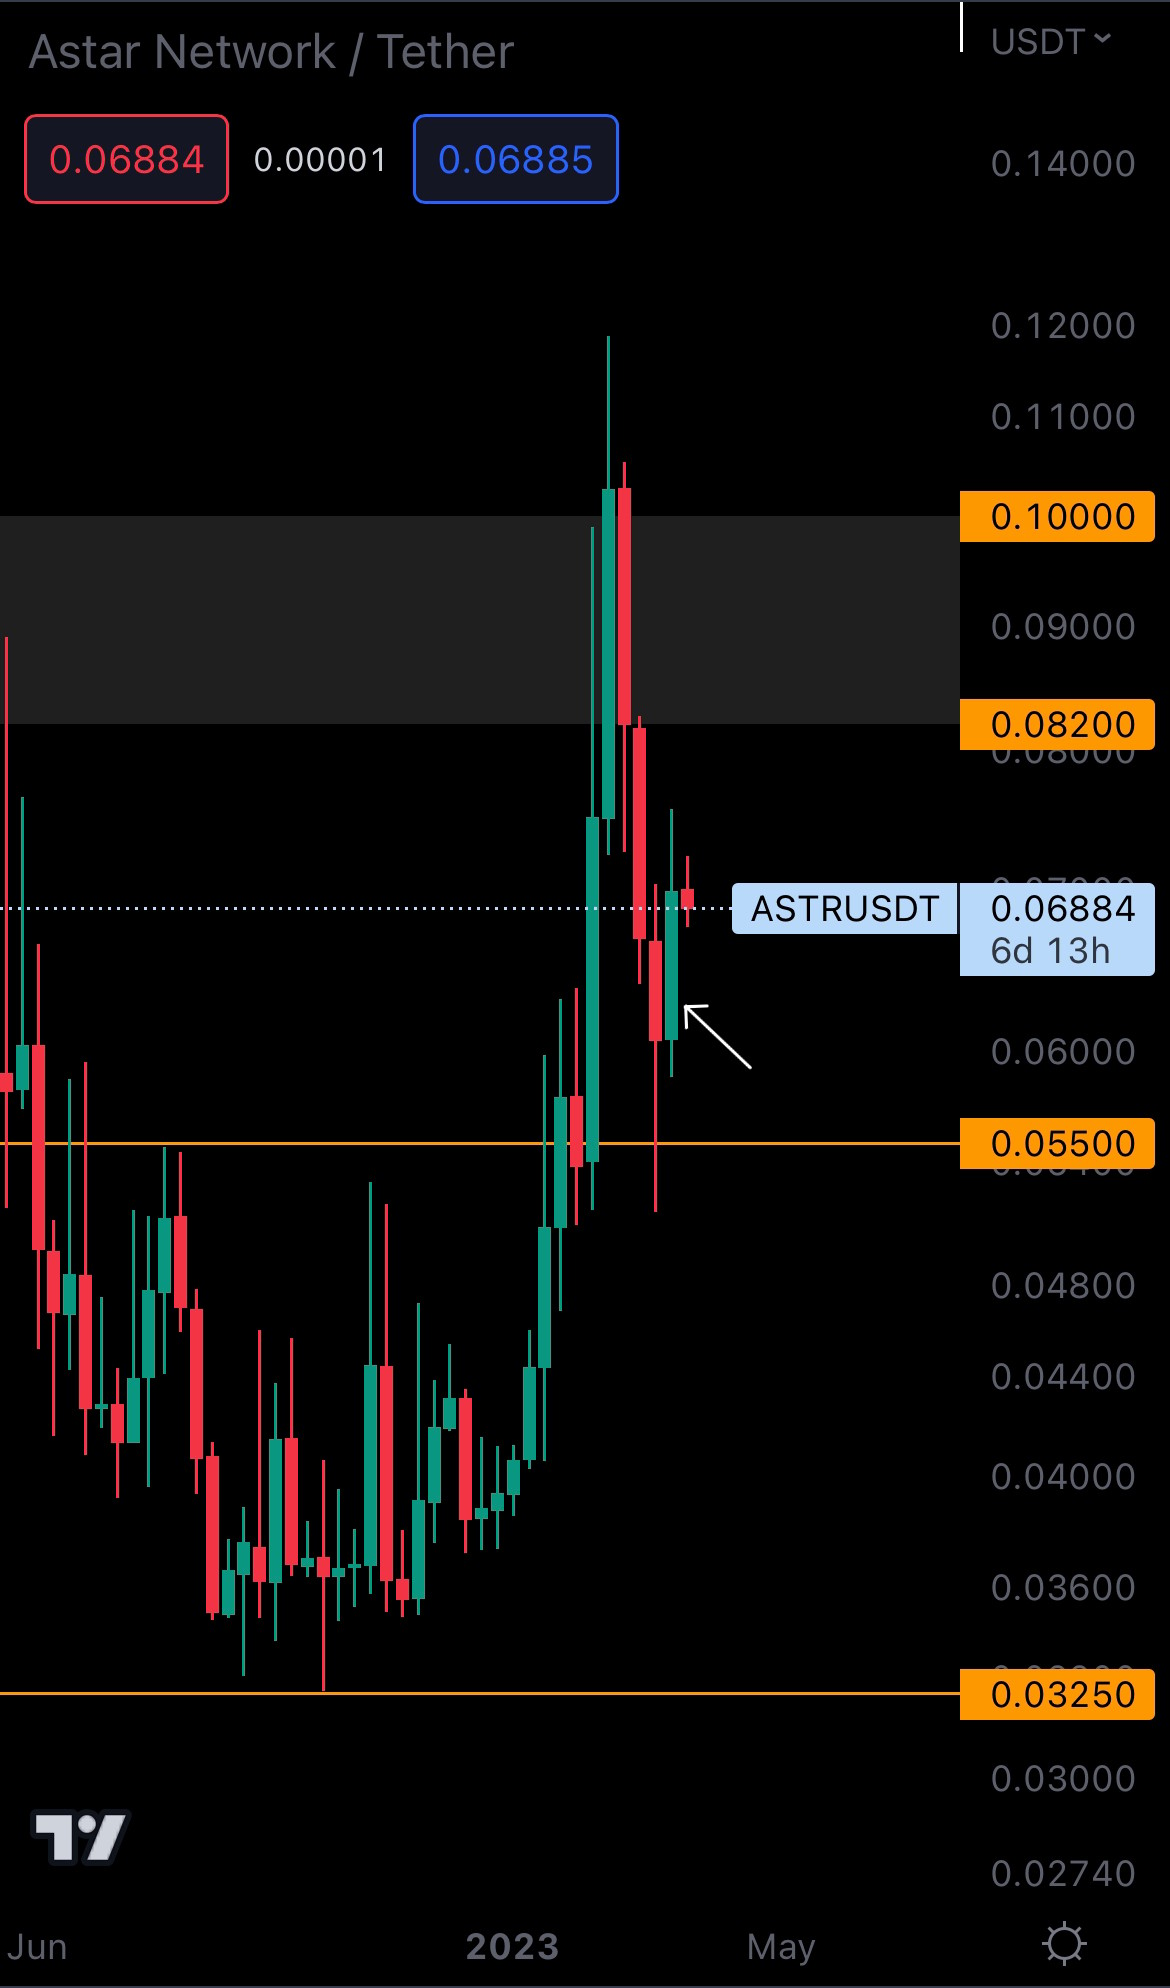
Because of last week’s increase, ASTR marked a weekly higher low at $0.0550, keeping the market structure intact. ASTR closed as a bullish engulfing candle last week, so buyers are in control. This means $0.082 will likely be tested in the coming weeks. This is in confluence with Bitcoin’s price action, so the odds are high.
THOR | THORSwap (Weekly)
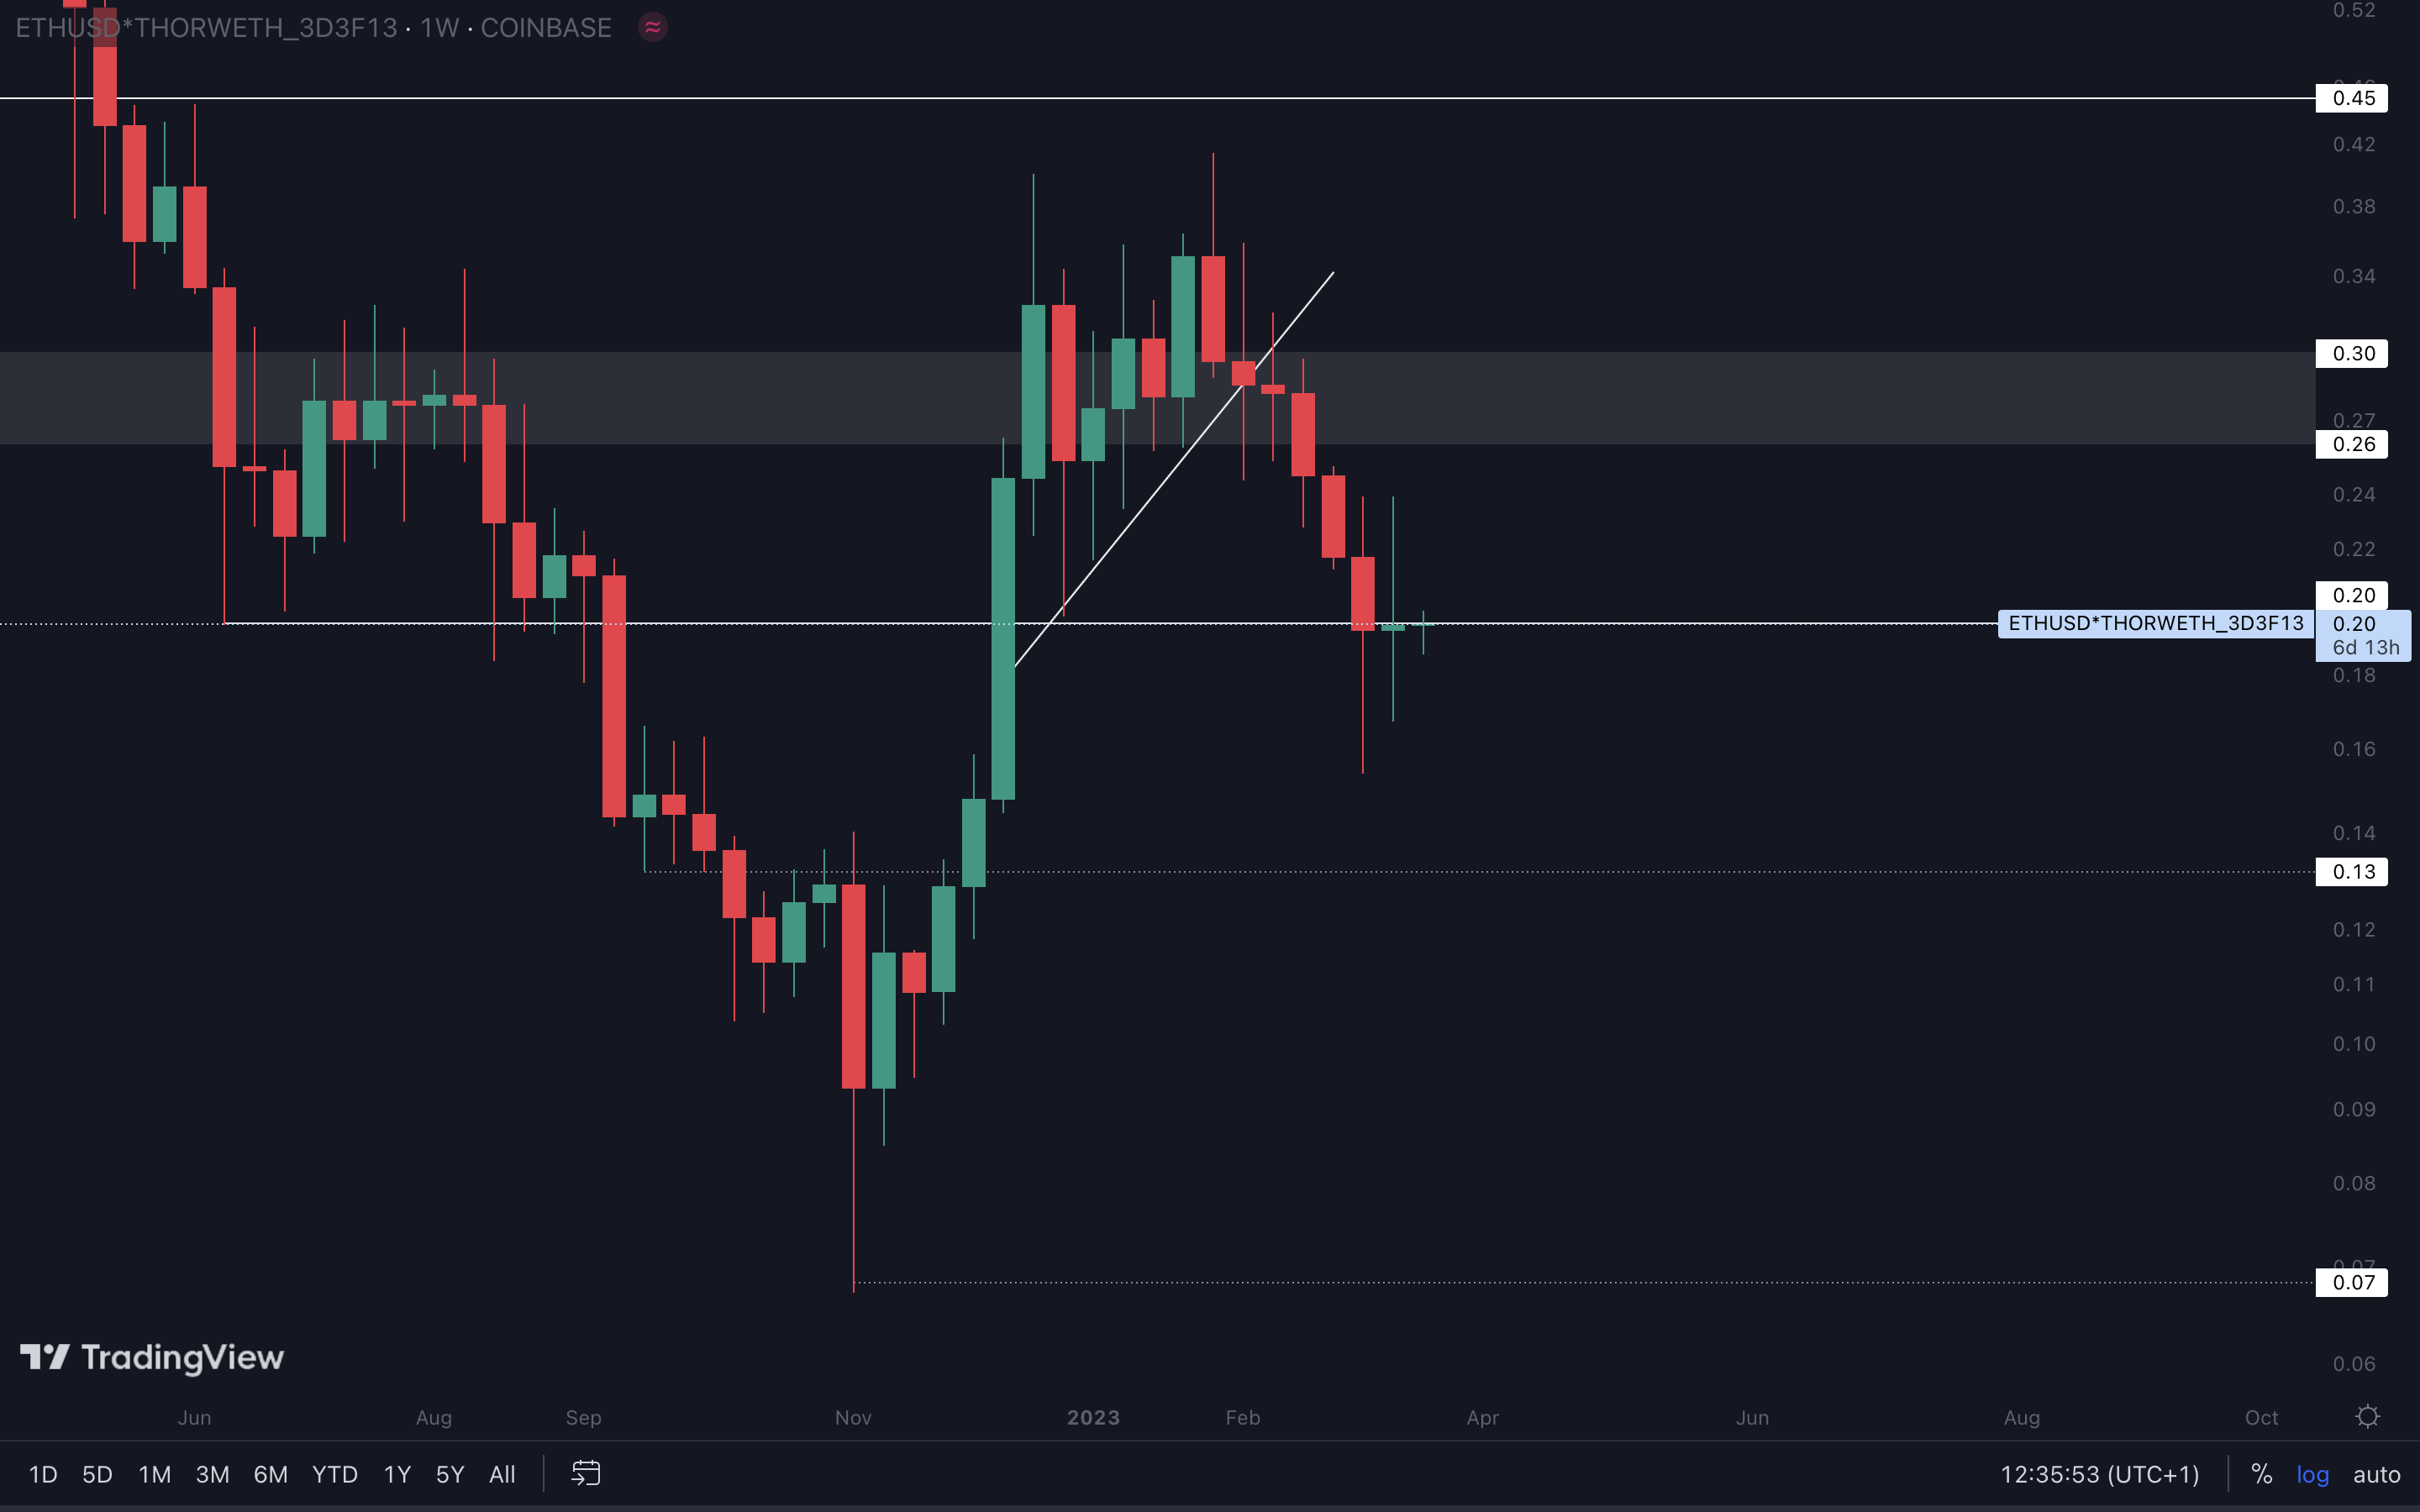
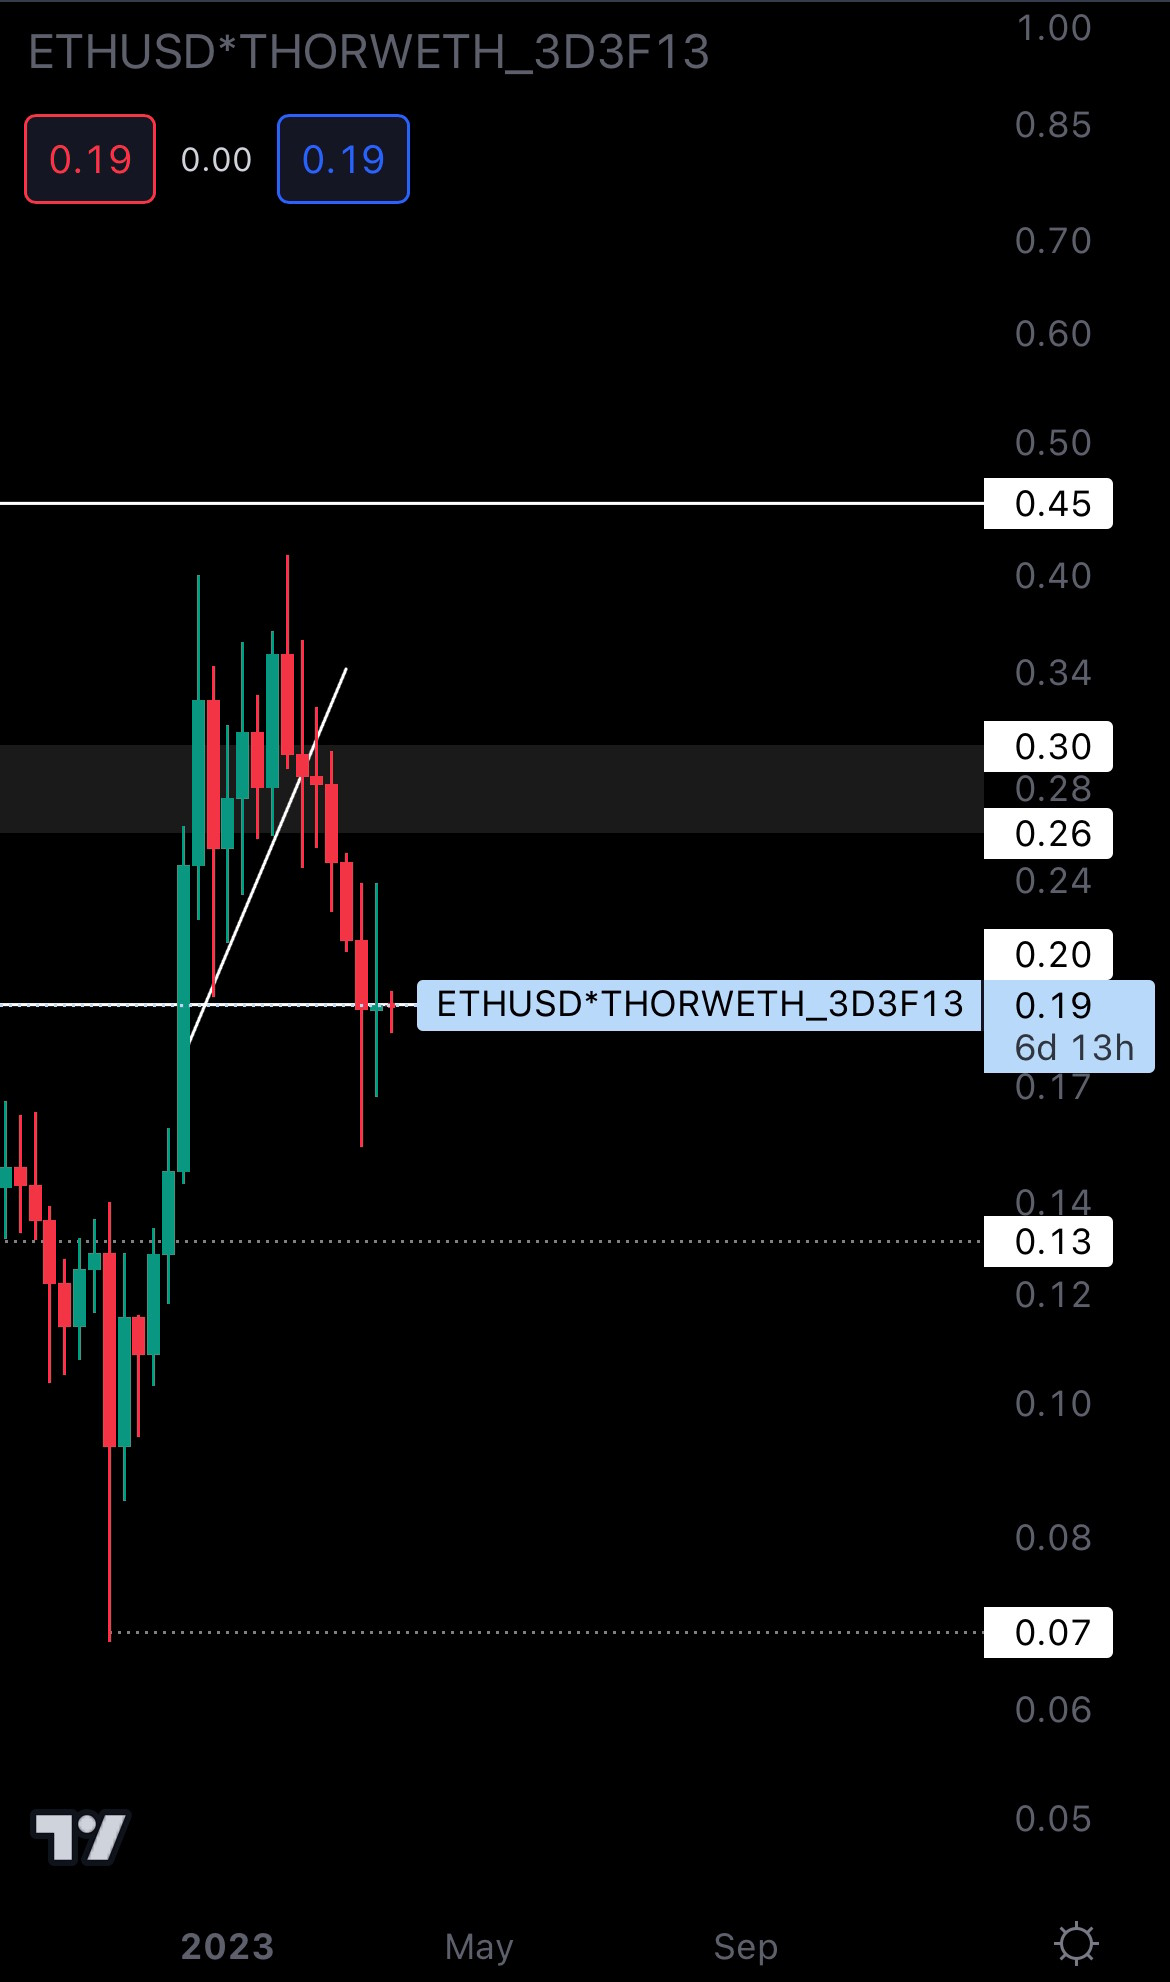
Not only did THOR close under resistance ($0.20) last week, but it also closed as a Doji, a strong signal of indecision. For that reason, we’d want to see THOR close a weekly candle above $0.20 to confirm further upside. Otherwise, a rejection (THOR going down from here) is possible.
OP | Optimism (Weekly)
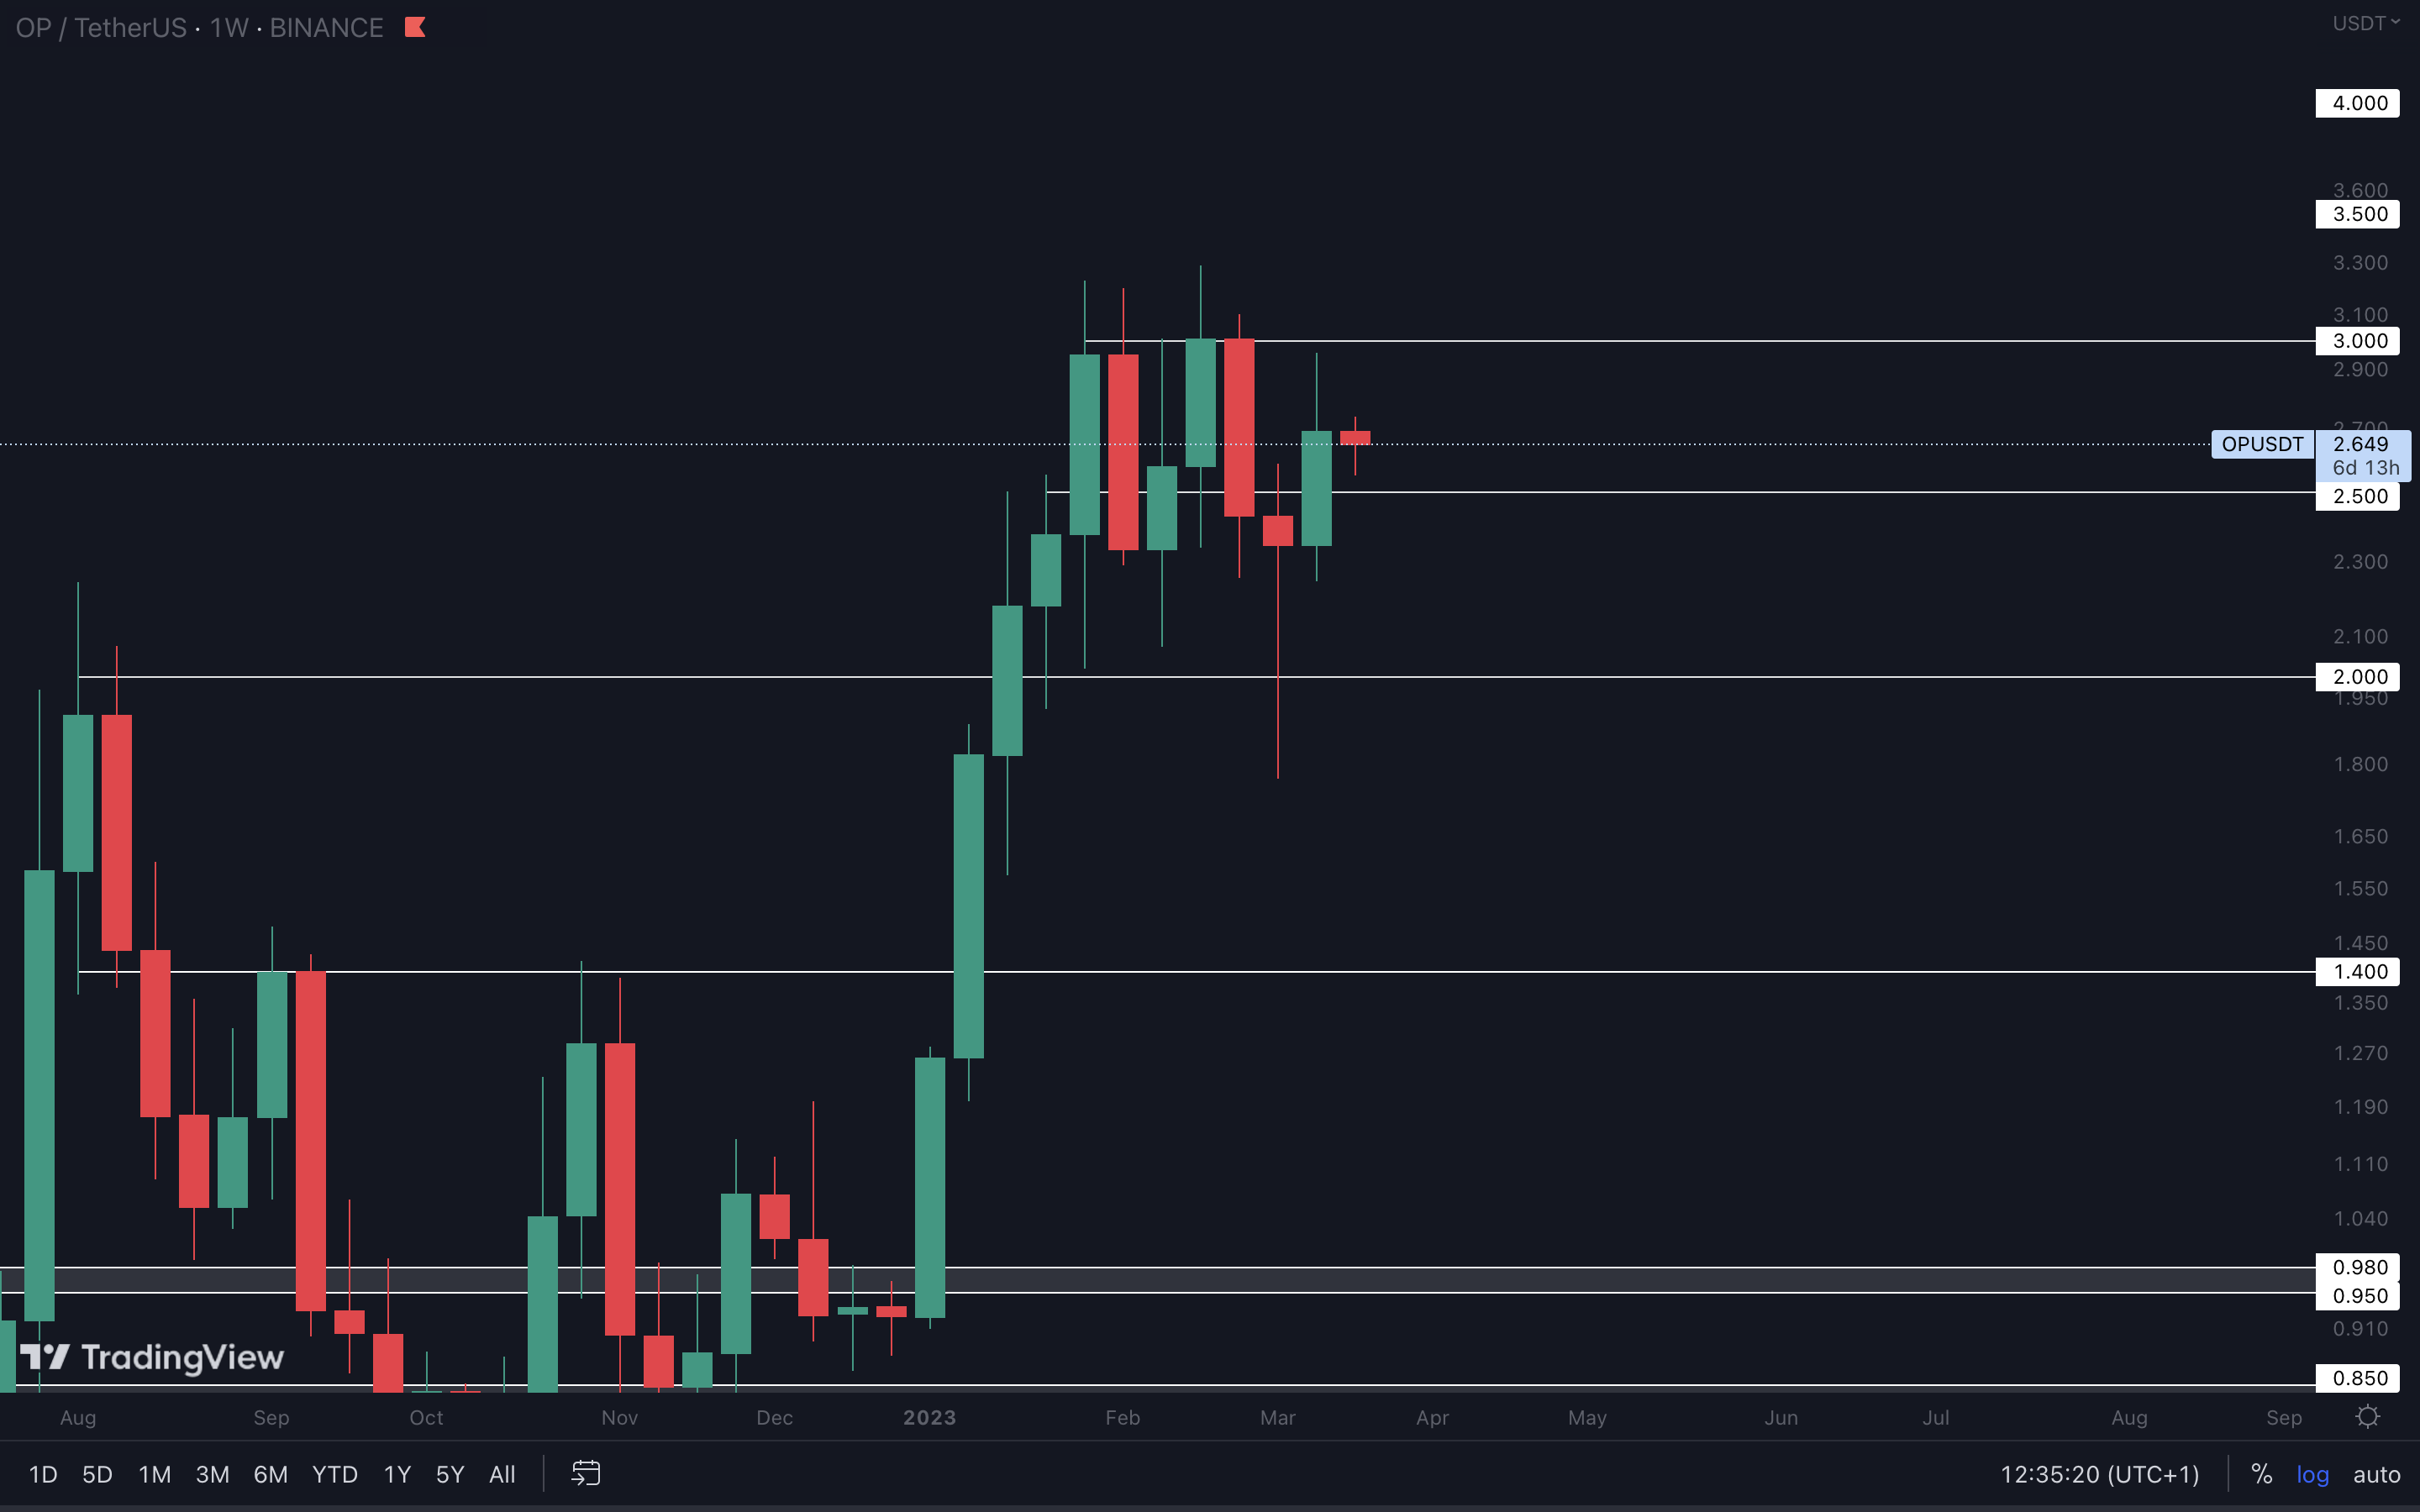
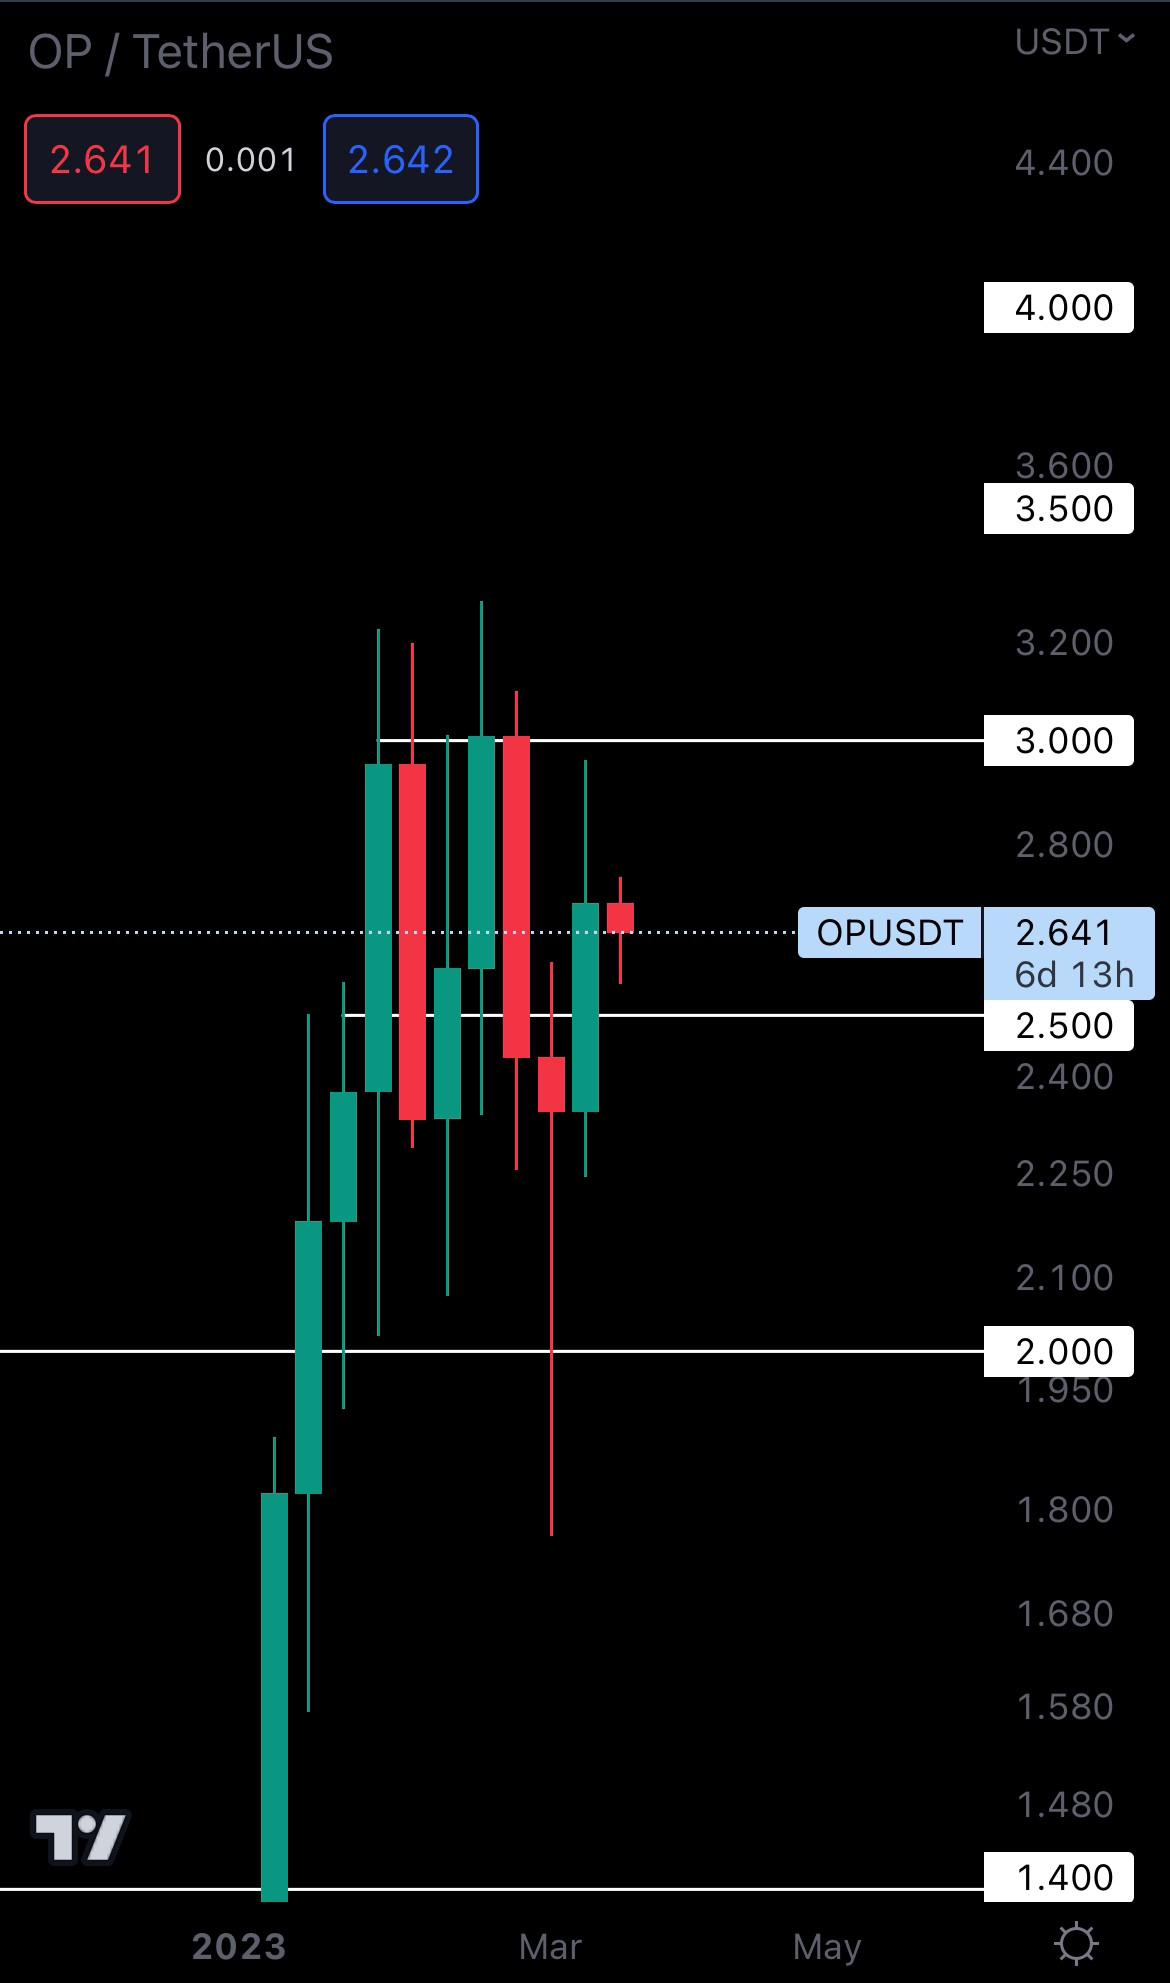
Thanks to last week’s market-wide performance, OP closed above $2.50, so this level is now support. In the coming weeks, we’ll see it test $3 and potentially even levels higher. A weekly closure above $3 would open the door for new psychological levels to be tested (such as $3.50, $4, $5, etc.). Keep in mind that OP is a highly volatile asset. While it can give you solid returns quickly, it can just as easily make you lose money.
Cryptonary’s take
Greediness, a crypto investor’s #1 enemy. It’s the main reason why people lose money. With the Total Market Cap and Bitcoin approaching resistance, securing some profits is ideal. While the market looks bullish, too much buying in a short period of timetime always leads to a drop. This is known as “price exhaustion”.Action points:
- We recommend preparing to take profits. The Total Market Cap and Bitcoin are approaching resistance, and although we believe higher prices can follow, nothing is guaranteed in financial markets.
- Don’t get greedy!
- If you’re inexperienced, stay away from trading!
Recommended from Cryptonary


