Save 23% ($351) & Get a Free 1-1 Call with our Team ⏰ : 0d 2h 59m 43s

Why you should read this report
- BTC's open interest and funding rates hint at trader sentiment—find out what this could mean for price action.
- ETH's technical analysis reveals a critical range to watch - learn the key levels that could trigger a breakout.
- SOL's price is approaching a pivotal juncture - discover why the next move could be significant.
- WIF retested an important level - see our analysis on whether this resistance will hold or break.
- POPCAT narrowly avoided a bearish pattern - read about the crucial support and resistance zones ahead.
Disclaimer: This is not financial or investment advice. You are responsible for any capital-related decisions you make, and only you are accountable for the results.
BTC
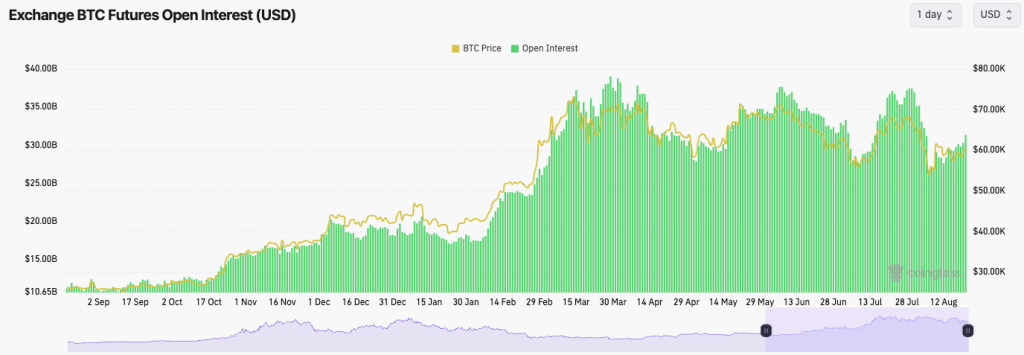
From a mechanics perspective, Bitcoin's Funding Rate has continued to move back and forth between slightly positive and slightly negative over the past week. This shows indecision among traders.In the last 24 hours, Bitcoin's Open Interest has kicked up slightly but remains well below the highs, suggesting that traders are unwilling to pile leverage back on following the flush out from a fortnight ago.
BTC Open Interest:
Technical analysis
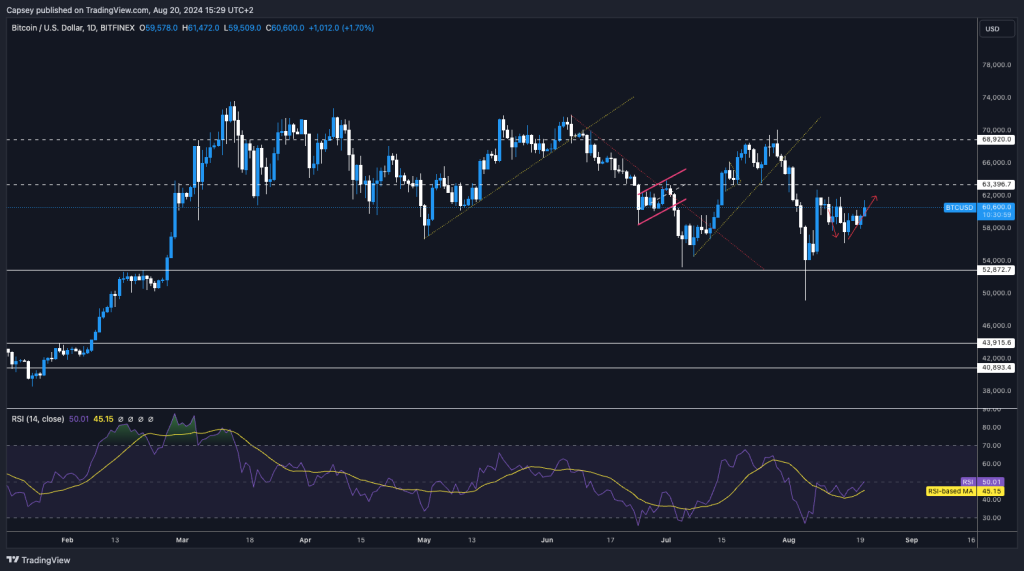
- Price has perfectly followed the arrowed direction we placed ten days ago.
- Price is currently still beneath the horizontal resistance of $63,400, which is a key level for price to reclaim for price to then see a bullish reversal.
- Price is well above the main horizontal support of $52,800, and it has also recently bounced off of the local support of $56,000.
- The RSI is in middle territory here, so that's not providing a headwind for the price to move in either direction.
Cryptonary's take
What could be described as boring price action, we could argue we called perfectly last week. Of course, we want to call for crazy price targets, but our job is to do our best to predict/estimate what's going to happen, and over the last week, we've done that.August is always a quieter month, with lighter volumes; therefore, big volatility bouts are possible. However, in the immediate term (between now and Powell speaking on Friday), we're expecting price to remain between $56k and $63k. We're not expecting any fireworks in the immediate term.
But over the medium term, we are becoming increasingly bullish. We see the last six months of range-bound price action as hugely positive for Bitcoin once it decides to break out, which we believe we will see in the coming months. Q4 2024, we're expecting fireworks, with 2025 to be even better. Patience for now and that's reflected in our conservative and more subdued price targets for the immediate term.
ETH
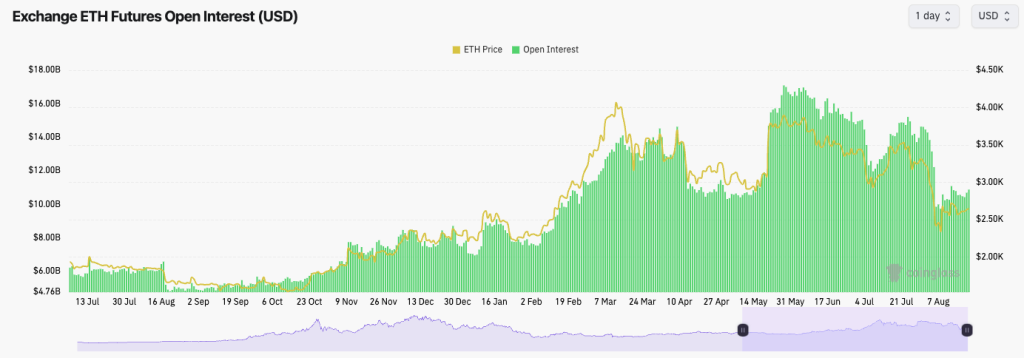
ETH's funding rate is similar to that of Bitcoin. It's ranged between slightly positive and negative for the last 10 days, indicating indecision amongst traders.ETH's Open Interest has also remained more subdued following the flush out, indicating that traders are not rushing back to leverage Long or Short ETH here. This is a really healthy resetting in leverage, which is usually positive for prices going higher in the following weeks and months.
ETH's Open Interest:
Technical analysis
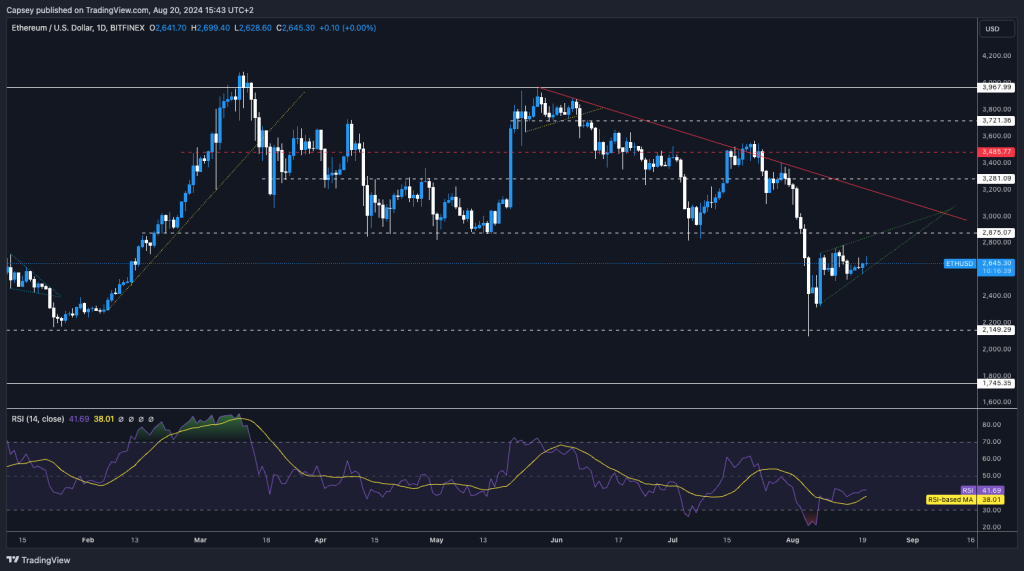
- Like Bitcoin, ETH remains in the lower range between the major horizontal support of $2,150 and the horizontal resistance of $2,875.
- Locally, ETH is range-bound between $2,400 and $2,750. These are the levels to watch for a more material breakout.
- ETH is in an ascending wedge, which tends to have a bias to break out to the downside; however, this isn't a clean wedge in terms of its formation.
- A breakdown from the wedge would likely send ETH to $2,400 to $2,500, which we would see as a buying zone for ETH.
- The RSI is at 42, so it is middle territory, but there is more upside to be had.
Cryptonary's take
We're expecting more range-bound price action in this tighter range over the coming week. Ultimately, we'd need to see ETH reclaim and clear comfortably back above $2,875 to get us excited. We're not expecting this to happen in the coming days, but as we move into September, we believe that level will be reclaimed. ETH can grind higher from there into Q4, where we expect ETH to test its all-time highs and likely break above them by year-end.SOL
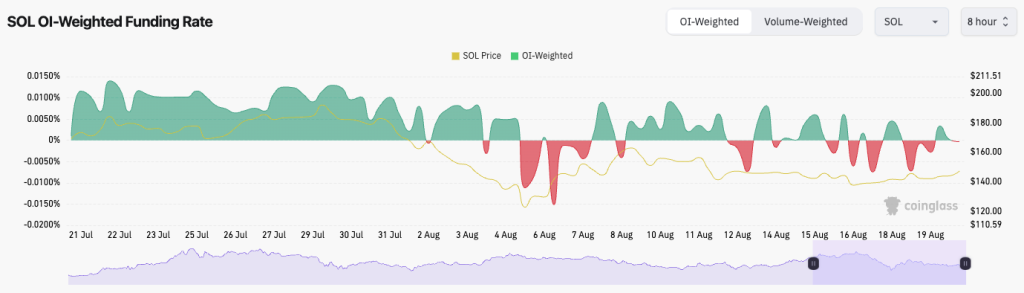
SOL's Funding Rate has been in negative territory more frequently over the last 10 days or so, indicating that traders are interested in going Short.SOL's Open Interest has also stayed somewhat subdued and hasn't increased substantially following the flush-out a fortnight ago.
That said, we wouldn't look to short SOL.
SOL's Funding Rate:
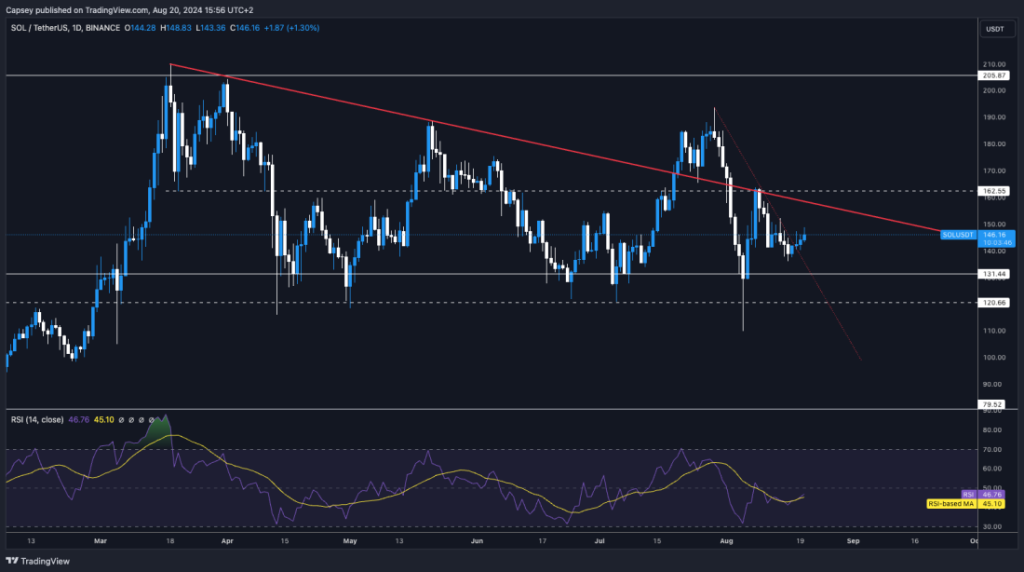
Technical analysis
- Following the bounce from the lows of around $115, SOL has managed to remain well above the horizontal support of $131, which is a positive.
- SOL is also attempting to break out of the local downtrend line, but price is struggling to see a follow-through.
- However, SOL currently remains below the main downtrend line and the horizontal resistance of $162. For SOL to see a major bullish reversal, price will need to break above these levels.
- On the downside, the support zone remains between $120 and $131, which hasn't been tested since the recovery a fortnight ago.
- If price were to retest the support zone of $120 to $131, we would be buyers of SOL in this area.
Cryptonary's take
Like BTC and ETH, SOL remains in a slightly tighter range in this slightly quieter time of the year. We expect volumes to return in September, and then more significant price moves can happen. But in the immediate term (pre-Powell speaking at Jackson Hole on Friday), we expect prices to remain tight and stay range-bound.In 12 months' time, I believe we will look back on this SOL range between $120 and $200, similarly to how ETH was range bound in the second half of 2020 between $300 and $420 before it did a 10x over the next 12 months.
WIF
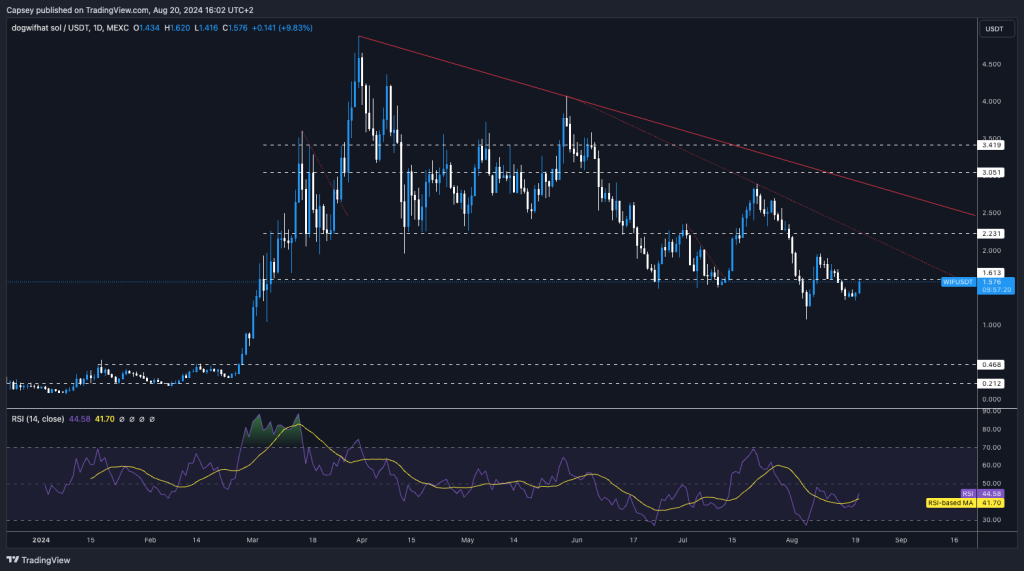
- We're pleasantly surprised to see WIF move back up to retest $1.60, having lost that level of support and fallen well below it.
- However, it's now likely that $1.60 acts as new resistance, so we wouldn't be too excited until $1.60 can be reclaimed and flipped into new support.
- If WIF were to pull back from here, we'd expect the $ 1.30's to be retested.
- To the upside, there seems to be a lot to do, especially considering the next major horizontal level (above $1.60) is $2.20, which would likely act as local resistance along with the local downtrend line.
- The RSI is in a clean middle territory, suggesting more upside.
Cryptonary's take
In the immediate term, it's hard to be super positive about WIF here until it can convincingly close above $1.60. Over the coming days, we expect it to be range-bound between $1.30 and $1.60. We will reassess after J Powell speaks on Friday. If we see a convincing break out of $1.60, we would consider that a very positive development.For an in-depth look at market performance, see our analysis on dogwifhat (WIF).
POPCAT
- We were close to seeing the Head and Shoulders pattern playing out, but fortunately, POP was able to bounce from the $0.40 horizontal support which we called for in last week's Market Direction.
- We're now assessing how convincing this bounce is.
- POP is now between two key levels: $0.55 as resistance and $0.40 as support.
- POP is attempting to break out of a local downtrend line, which could give price enough fuel to attempt $0.55 and potentially break above it.

Cryptonary's take
POPCAT is in a crucial zone between key support ($0.40) and resistance ($0.55). A reclaim above $0.55 would be a majorly positive development. However, we think it might reject $0.55 in the immediate term.However, beyond Powell's speech on Friday, we think POPCAT can re-attempt $0.55 and break back above it. If POPCAT is to break down, we would want to see the $0.30 to $0.40 area held as support. These are really strong support levels, so we would expect them to be held.
Recommended from Cryptonary


