Save 23% ($351) & Get a Free 1-1 Call with our Team ⏰ : 0d 2h 59m 44s

Are we on the cusp of a breakout, or is there more sideways action in store? With major economic indicators and interest rate decisions on the horizon, the next few weeks could be pivotal for crypto.
Disclaimer: This is not financial or investment advice. You are responsible for any capital-related decisions you make, and only you are accountable for the results.
BTC
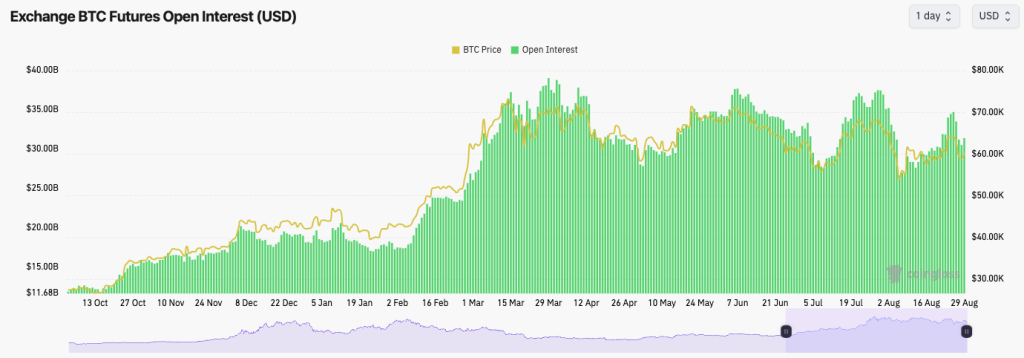
- In our last Market Direction, we commented that BTC's Open Interest had increased to relatively high levels, making it vulnerable to a flush-out. We got this on Tuesday.
- BTC's Funding is now flip-flopping between slightly positive and slightly negative, again indicating indecision.
- This is typical when the market is range-bound, and traders have become bored/somewhat stir-crazy by the price action.
- The Open Interest has been flushed back out again, and price from a mechanics perspective looks ok to grind higher from here.
Technical analysis
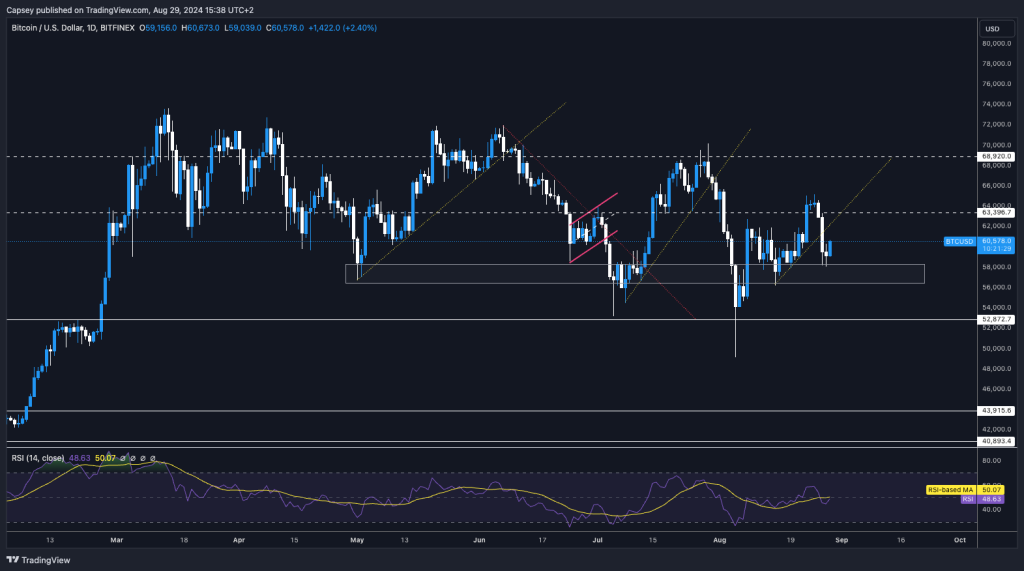
- We weren't necessarily expecting BTC to have a substantial breakdown, but once the $63,400 level was lost, Longs were offside, and the leverage was flushed, causing a more significant drop in price.
- Price was then unable to find support in the $61k to $62k region.
- We have placed a grey box where we believe there is stronger support for price between $56,500 and $58,300. We expect that area to hold in the short term (we'll see how price develops beyond the short term).
- Ultimately, price is still in its major range between $53k and $69k, and actually now back in its tighter range between $56k and $64k.
- We're not expecting the market to see any fireworks until the range, particularly the tighter range, can be broken.
- In order for us to turn more bullish in the immediate term, we'd need to see price reclaim above $63,400.
Cryptonary's take
Looking back now, price has essentially done what we expected over the last few weeks—absolutely nothing and just been range-bound. We are expecting more of this.However, come next Friday (September 6th), if the US Payrolls (and Unemployment Rate) are positive, i.e., showing that the labour market is holding up still, we believe that could ignite the rally as we move to Interest Rates on September 18th.
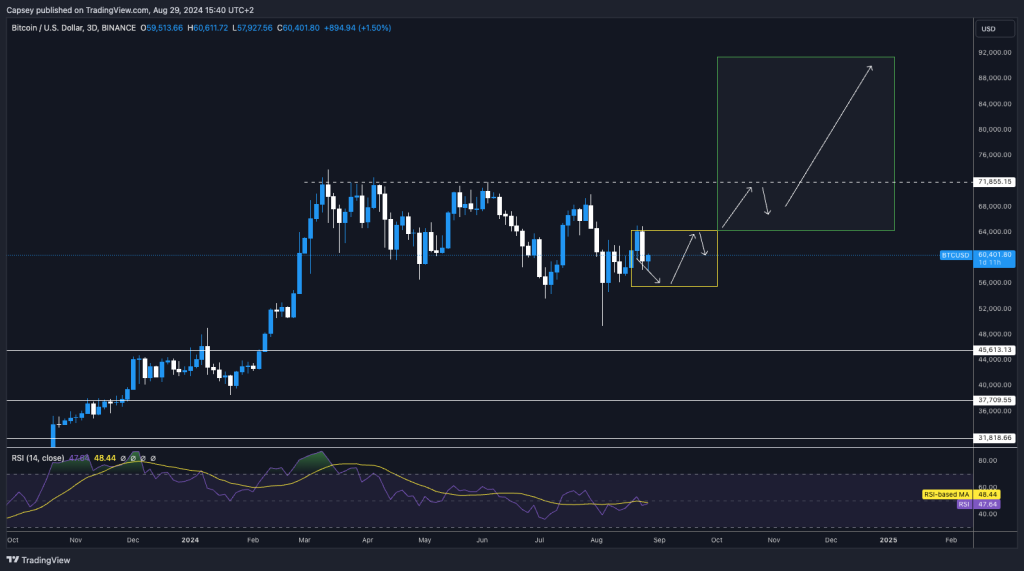
On another note for Bitcoin, if we refer to the zoomed-out chart and prediction we made for BTC's price action over the coming months, it's still right on track; in fact, the price rejected at the top of the Yellow box.
BTC 3D Timeframe: Zoomed-out perspective
ETH
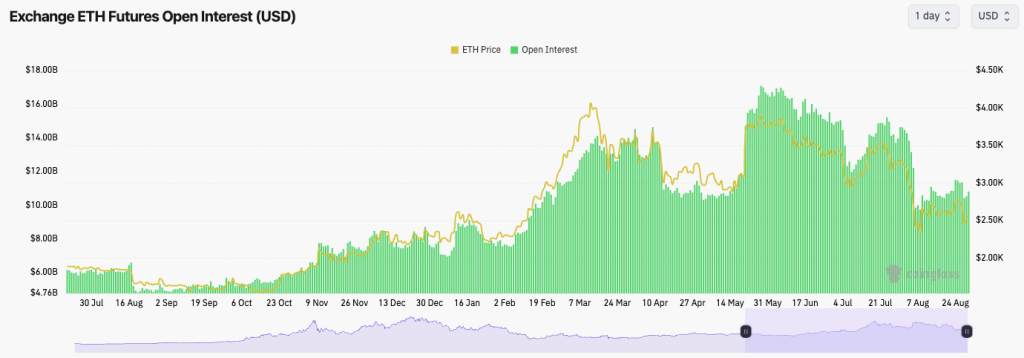
- ETH's Open Interest remains much more subdued, meaning severe leverage flush-outs are much less likely to occur.
- ETH's Funding Rate is flat at 0.00%, once again showing that traders are undecided about whether to be Long or Short.
Technical analysis
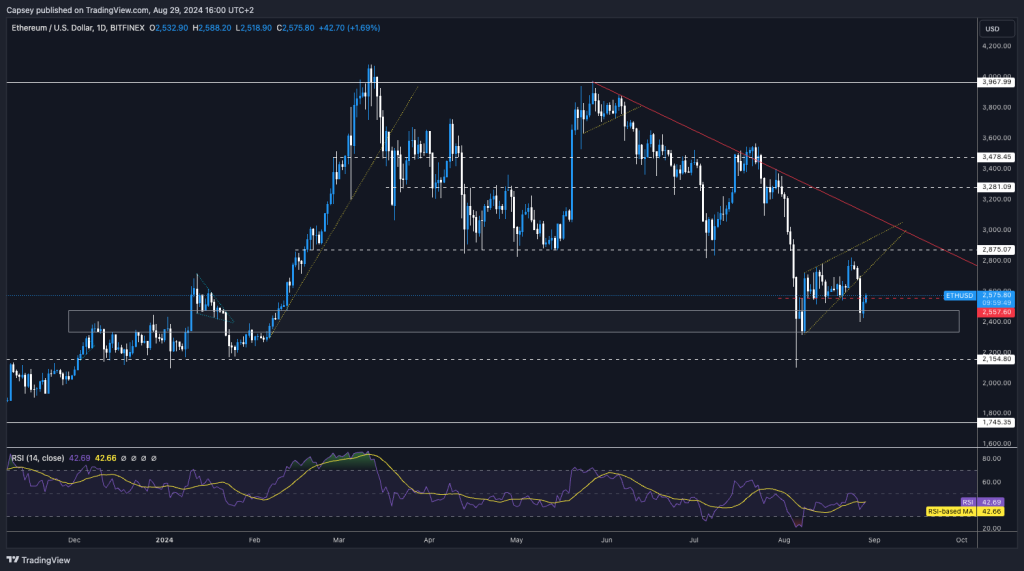
- ETH broke down from its ascending wedge, which we perfectly predicted and called for in the last Market Direction.
- However, price did drop slightly further than we initially expected, testing $2,400.
- We have inserted another box of support between $2,330 and $2,470, and we expect the price to continue finding support in that range.
- Price is currently facing local resistance at $2,555. To reclaim this level and build support above it, price needs to see a retest of $2,800.
- The RSI is relatively low at 42, so there is plenty of room for price to move higher.
Cryptonary's take
Generally speaking, we expect ETH to grind higher from here, even if it's sideways in the coming days. We would bid the grey box (between $2,330 and $2,470) with a view to holding this longer term. I am personally (Tom), in an ETH Long with an entry in the $2,500's.ETH may grind higher in September to test the $2,875 horizontal resistance and that main downtrend line. A breakout of these converging resistances would be bullish for ETH's price.
POPCAT
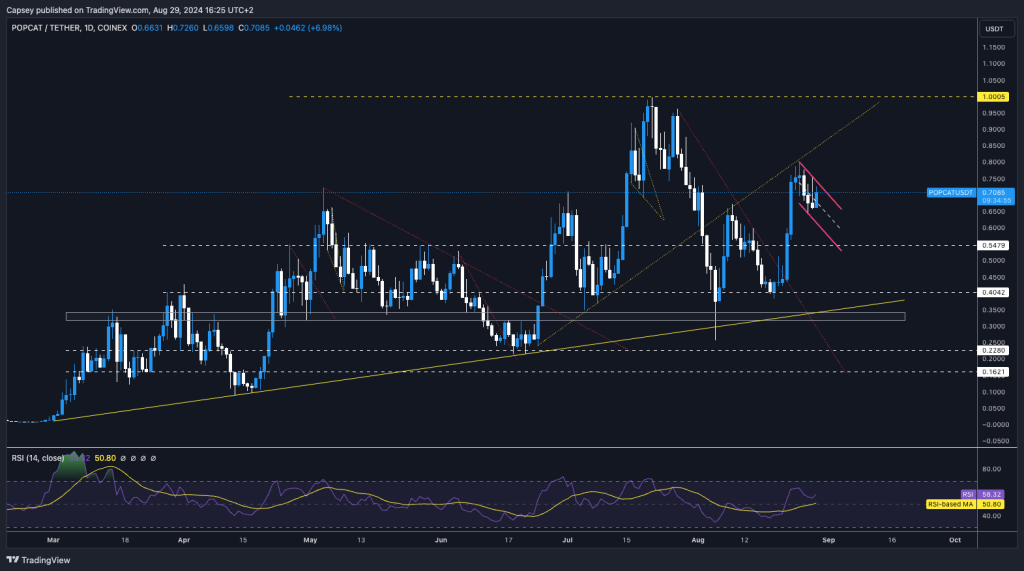
- Charting-wise, POPCAT looks excellent here.
- POPCAT initially rejected from the underside of the prior uptrend line, but it has pulled back and bounced off of the horizontal level of $0.65, previous resistance, now potentially new support.
- POPCAT is now forming a bull flag, which is a pattern that tends to break to the upside.
- A bull flag breakout target would be around $0.85. If that can be surpassed, then $1.00. However, we don't expect $1.00 to be passed in the short term.
- Moving forward, we'd like to see the $0.55 to $0.65 range hold as new support. We wouldn't rule out another retest of $0.40, although we see it as less likely.
- The RSI on POP is at 58, so another move higher for price (say $0.85) could send the RSI into overbought territory.
Cryptonary's take
Of course, we're still super bullish on POPCAT, and it has seemed to hold up better than other coins in this general market move down despite POPCAT being a more volatile asset.In the coming days, we'd like to see the bull flag breakout to the upside and price test $0.85. If price were to break down, our target area to hold would be between $0.55 and $0.65.
DOGE
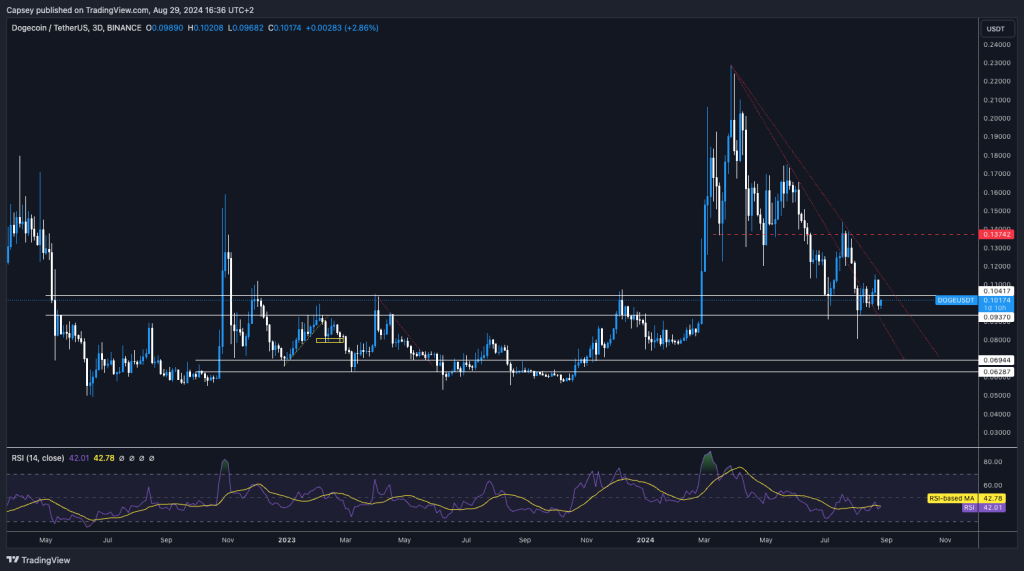
- Firstly, we're looking at DOGE on the 3D timeframe in the chart, so please be aware of this.
- DOGE has been in a general downtrend since mid-March and has now fallen into a zone of support between $0.093 and $0.10.
- Alongside this, price is now also squeezing into the downtrend lines.
- If price can form a base between $0.09 and $0.10 and push into the downtrend lines, then we may see a breakout.
- For our theory to stand/hold up, we'd need to see price hold above $0.09. A breakdown of this level would see price fall into a lower range, which wouldn't support a significant move up.
Cryptonary's take
As a pure trade goes, DOGE looks attractive here. However, it depends on whether DOGE can break out from the downtrend lines. To do that, it'll need to hold above $0.09 in the coming week and also reclaim back above $0.104.Overall, we see this as a positive setup, though. A breakout of the downtrend lines could see price run to $0.137 in the coming month or so.
TON
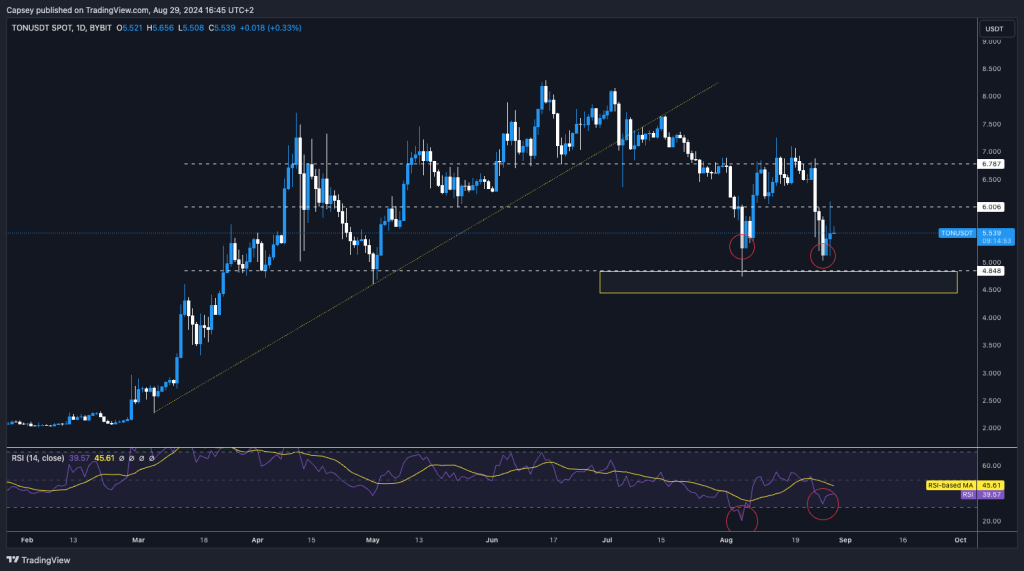
- With Pavel Durov's (Telegram's founder) recent arrest and subsequent release from prison, TON has seen volatile price action.
- TON's major horizontal resistance is $6.78, with $6.00 being a level lower.
- On the downside, TON's support is at $4.84. This is also extremely close to TON's major Yellow Buy Box, between $4.45 and $4.85.
- TON has also formed a bullish divergence on the RSI here. A lower low in price (candle bodies) with a higher low on the oscillator is a bullish formation that tends to see prices increase.
- To the upside for price currently, price is below $6.00, which is now a local horizontal resistance.
Cryptonary's take
TON is a top-10 coin by market cap, and considering its vast community, TON might be a "player" in the future.We're, therefore, watching price action here. Even though the situation is unclear (surrounding Durov), the chart is bullish, having put in a bullish divergence from oversold territory. If price does retest the Yellow Buy Box between $4.45 and $4.85, this would be the area to bid TON.
Recommended from Cryptonary


