Save 23% ($351) & Get a Free 1-1 Call with our Team ⏰ : 0d 2h 59m 44s
Bitcoin has already set the stage, breaking through its previous all-time high and trading above $90,000. The focus now shifts to how this rally will unfold for Ethereum, Solana, and the broader altcoin market.
What makes this moment particularly exciting is how the charts are aligning. The Total Market Cap is consolidating above its all-time high of $3.1 trillion, signalling that a breakout is imminent. Meanwhile, Ethereum/Bitcoin is approaching a critical bottoming range, positioning ETH to reassert itself against BTC.
On the other hand, Bitcoin Dominance is nearing its peak, preparing for a reversal that could ignite a full-blown altcoin season. The confluence between these key indicators points to a market-wide shift that could rival the euphoric phases of previous cycles.
In this edition of Battle of the Majors, we delve deeper into these dynamics, exploring the Total Market Cap's breakout potential, Ethereum's bottoming process, and Solana's growing dominance. With so much at stake, the market is primed for a move that could define the next phase of the bull run.
Disclaimer: This is not financial or investment advice. You are responsible for any capital-related decisions you make, and only you are accountable for the results.
Total market cap
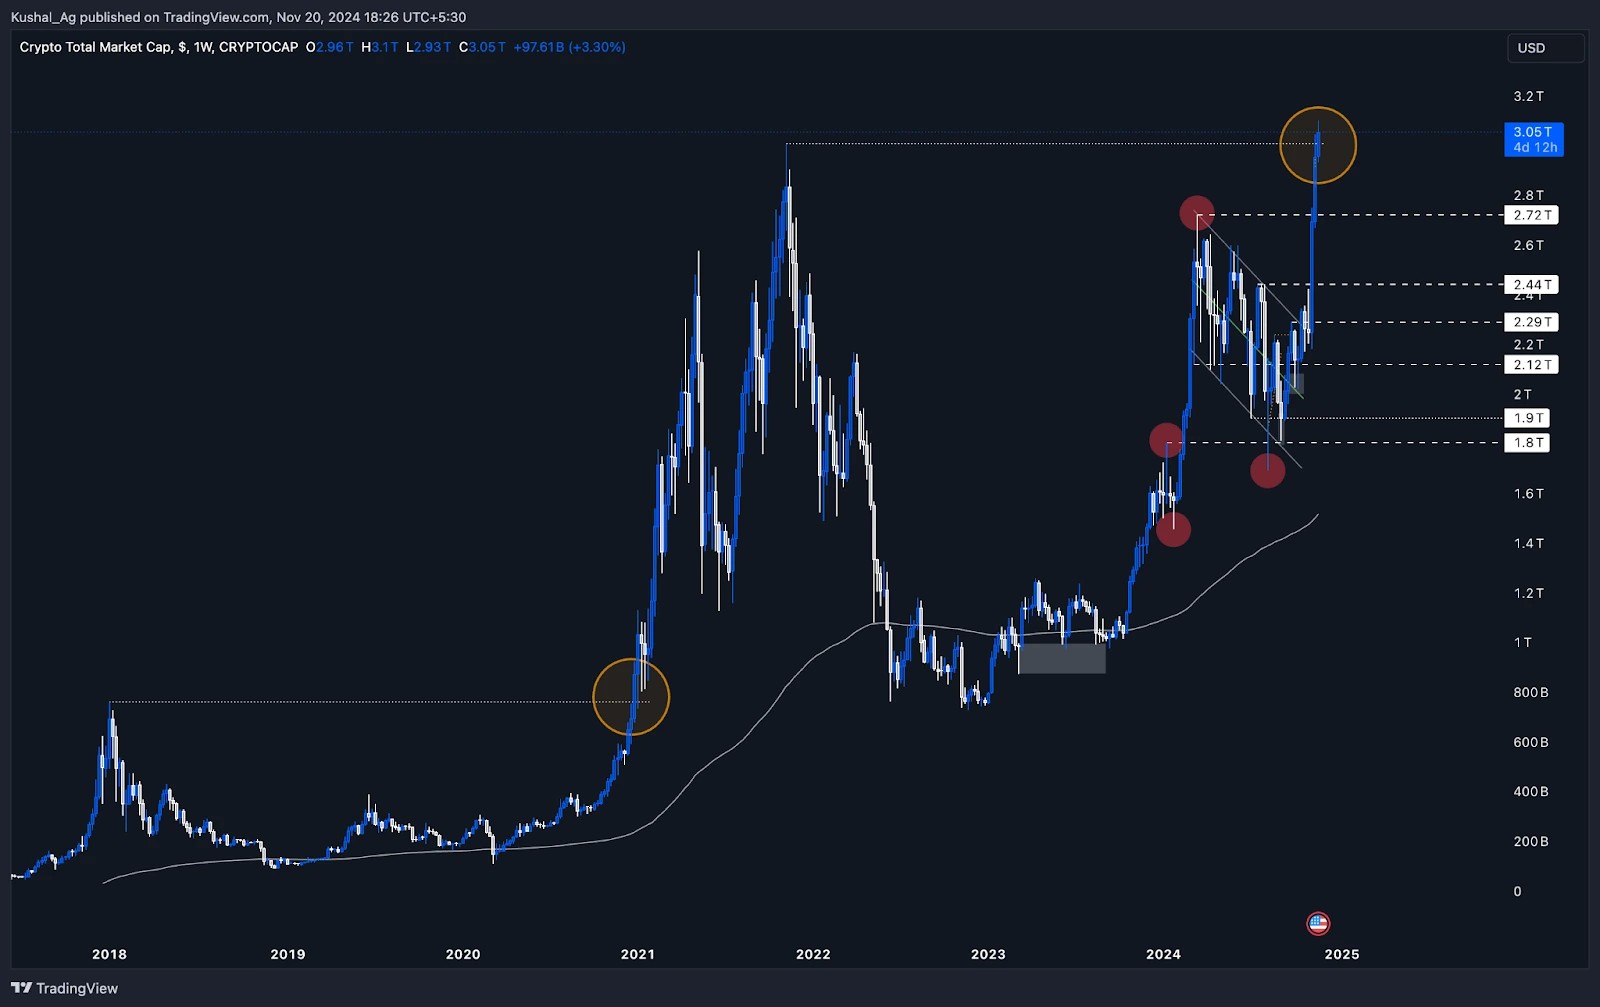
Let's start with the Total Market Cap to get a comprehensive overview of the market. In the weekly timeframe, the total market cap is breaking out of its 2021 all-time high of $3.01 trillion and is currently trading at $3.1 trillion. This breakout marks a significant milestone, positioning the market for a new phase of exponential growth and signalling a shift in market momentum.In Battle Of Majors (IV), we analysed the Total Market Cap when it was trading within a bull flag on the daily timeframe, consolidating between the $2 trillion and $2.2 trillion region. At the time, we anticipated a breakout above this range, and now the market has delivered, surpassing $3 trillion and moving into price discovery.
This upward momentum in the Total Market Cap mirrors the dynamics of late 2020, where similar breakouts led to significant market-wide rallies. With strong support levels established and new highs being tested, the Total Market Cap is leading the way for the next leg of the bull cycle.
Historical comparison
- In late 2020, the Total Market Cap broke out from its previous cycle high of $760 billion, skyrocketing to a $3 trillion-a 290% increase over a span of 300 days.
- The move was split into two major legs: an initial rally from $760 billion to $2.4 trillion (120 days) followed by a retracement of 58% to $1.12 trillion. The final leg saw the market surge by 640%, reaching $3 trillion.
Recent developments
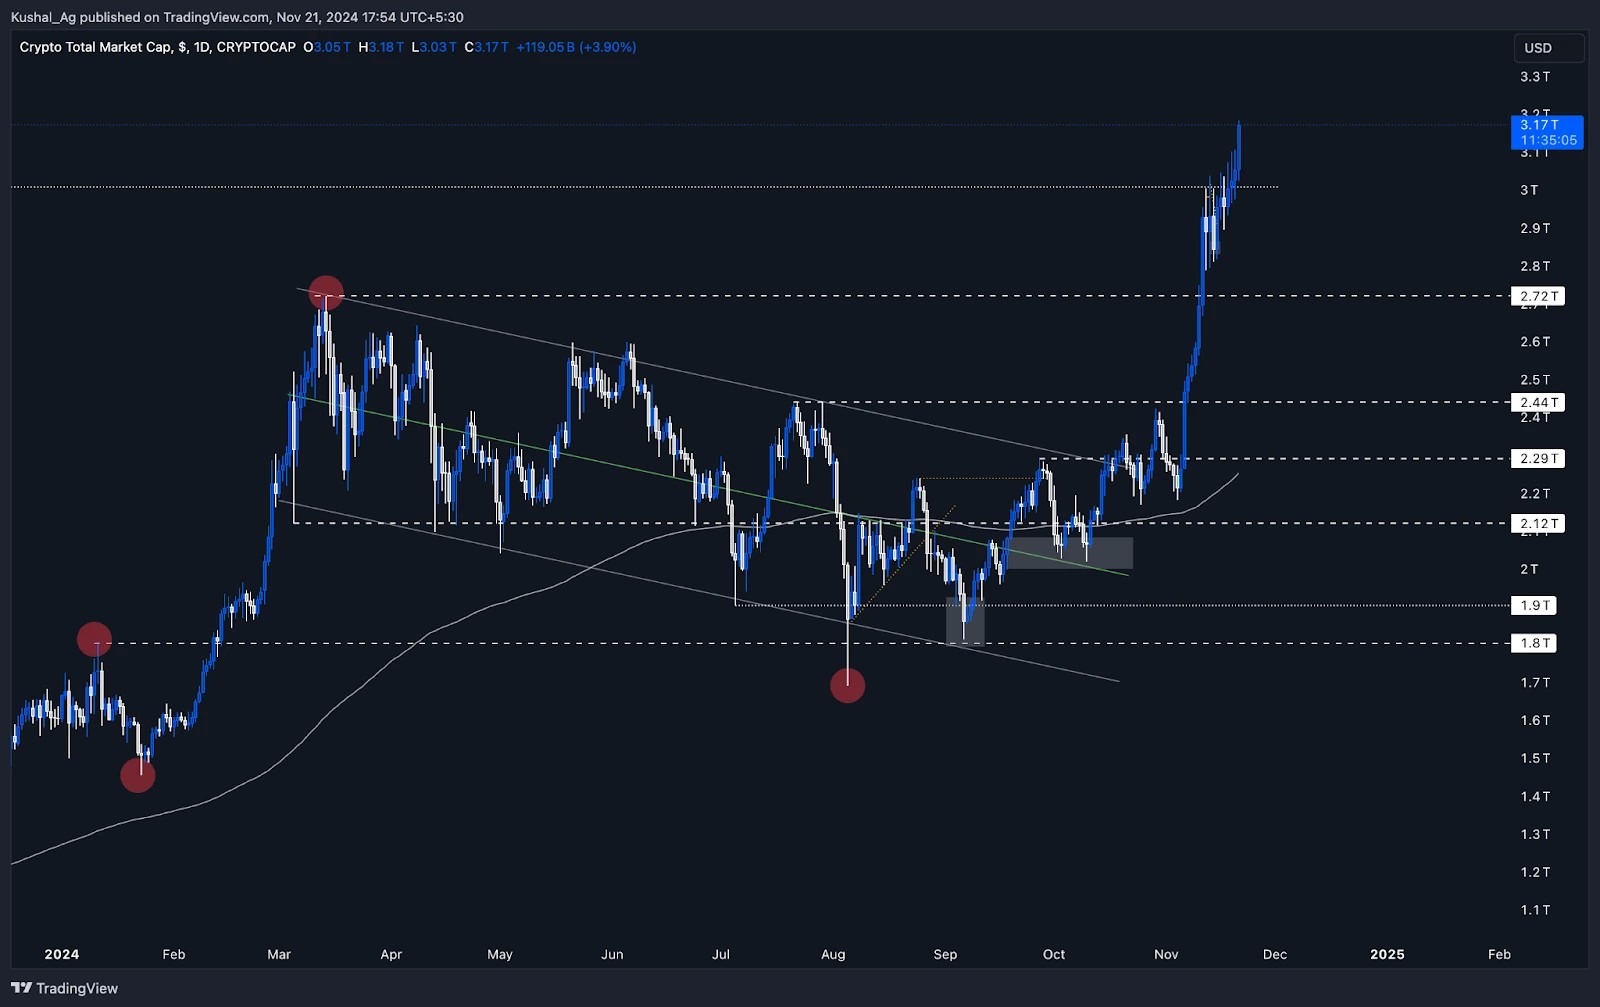
- In the daily timeframe, after breaking out of the bull flag, the market faced resistance in the $2.44 trillion region. This led to a brief retracement to $2.18 trillion in early November, forming a base for a subsequent 42% rally.
- The market is now consolidating at its all-time high, setting the stage for another breakout.
Key levels
- Resistance: Sustaining above $3.01 trillion is critical for the market to enter the next parabolic phase.
- Support: The $2.72 trillion level will serve as a strong base for any potential pullbacks.
Conclusion
The Total Market Cap has entered price discovery, and the breakout above its previous ATH mirrors the explosive phase of late 2020. If history repeats, we're on the verge of a monumental bull run.ETH/BTC
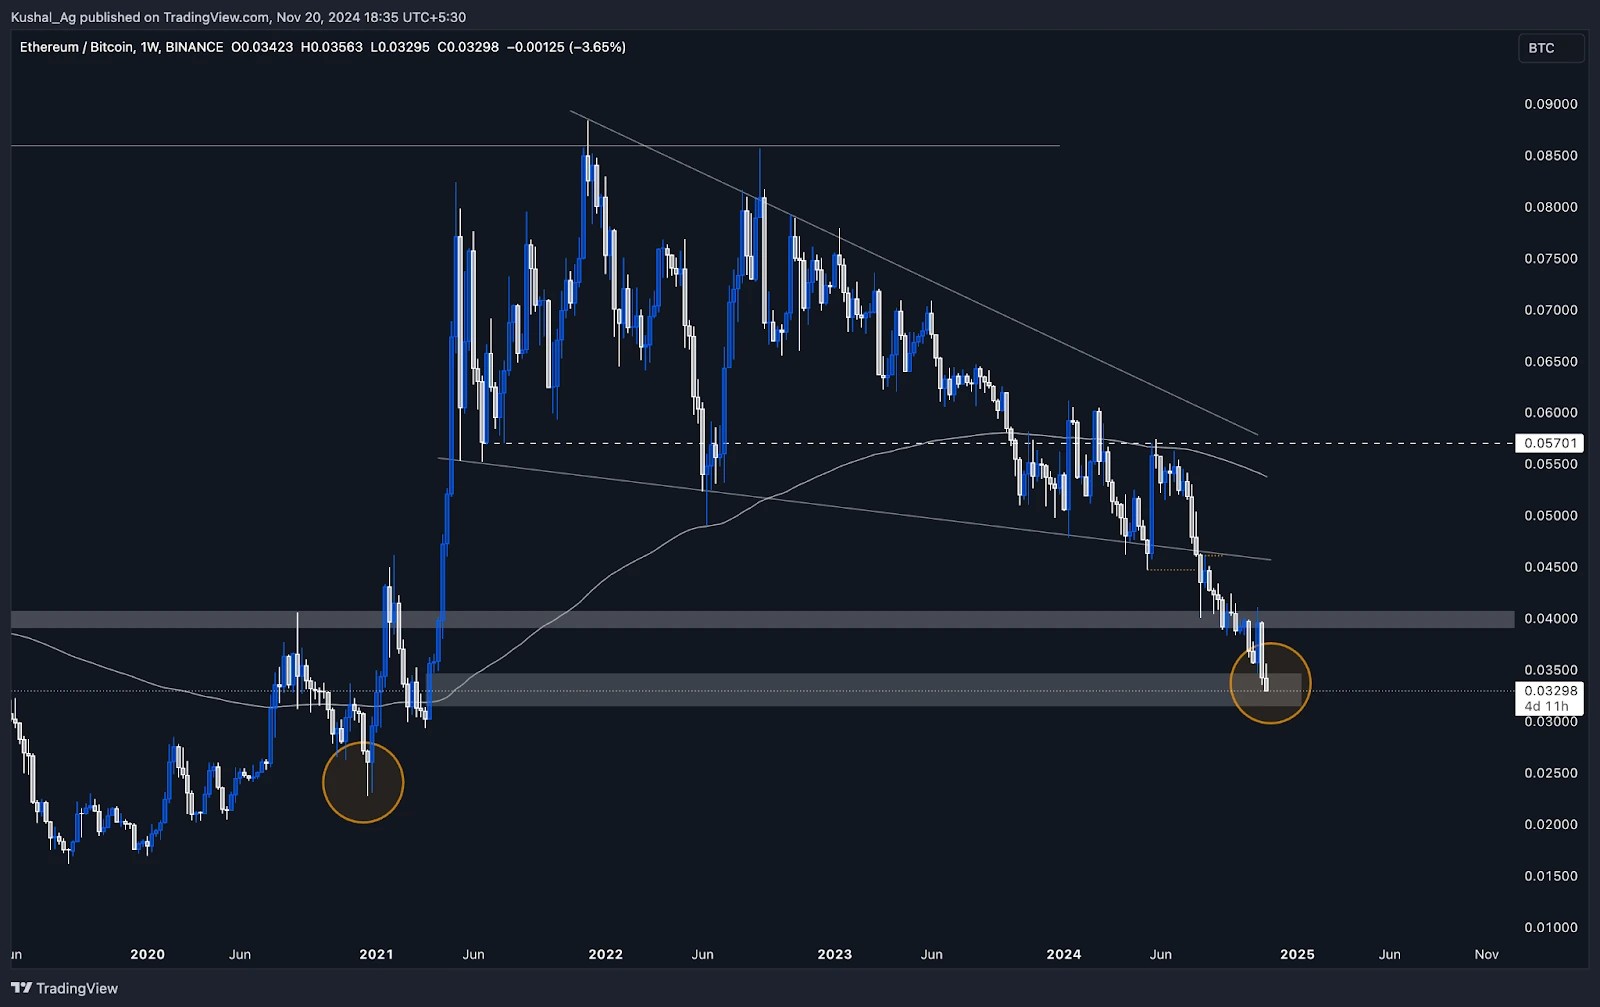
Moving forward, the Ethereum/Bitcoin chart has recently entered a critical range between 0.0315 and 0.0346 on the weekly timeframe. This zone is significant as we believe it will mark the bottom of this cycle. Price action within this range indicates accumulation, supported by single-sided reactions from 2021, which further validate its strength. This is not a level Ethereum has lingered in for long. It's a fresh test of a key zone, and the pair is showing early signs of preparing for a reversal.Historical comparison
In late December 2020, ETH/BTC bottomed out at 0.0227, setting the stage for a strong multi-phase rally.- The first leg up was a 100% move to 0.046, followed by a 36% retracement to 0.029.
- The second leg up saw ETH/BTC rally 181% to 0.082, after which it retraced 33% to 0.055 in mid-2021.
- The final leg-up lasted until late December 2021, with a 60% move from 0.055 to 0.088.
Recent developments
ETH/BTC is freshly testing the 0.0315-0.0346 range, which aligns with significant levels from prior cycles. This zone has the potential to act as the foundation for Ethereum to reverse its downtrend and reclaim dominance. Early price action suggests accumulation, with buyers stepping in at these levels.Key levels
- Support: The 0.0315-0.0346 range remains critical for Ethereum to establish a bottom for this cycle.
- Resistance: The 0.04 region is the key hurdle that must be cleared to confirm a reversal and initiate a strong upward move.
Conclusion
ETH/BTC has entered a key accumulation zone, with this range expected to form the bottom for this cycle. A reversal from here will position Ethereum to outperform Bitcoin, and a break above 0.04 will confirm the shift. This move will likely set the stage for broader altcoin strength in the coming months.BTC dominance (BTC.D)
Bitcoin dominance has been steadily climbing over the past months, reaching a critical resistance zone between 60% and 62%. This range aligns with previous cycle peaks, signalling that BTC.D may be nearing exhaustion. The market is at a pivotal point, with Bitcoin dominance poised for a reversal that could trigger a significant altcoin and memecoin rally. To gauge what's next, we analyse how BTC.D behaved in prior cycles.Historical comparison
In late December 2020, BTC dominance peaked at 73.6%, briefly wicking into the 70-72% resistance zone before reversing sharply. The first leg down was a 19% decline to 62% over 60 days, followed by a brief consolidation period lasting about 50 days. BTC.D then gave its major second leg down- a 36% decline to 39.7%, marking the beginning of alt season.Recent developments
Currently, BTC dominance is hovering around 61%, sitting just above its rising wedge on the weekly timeframe. Manipulative price action is evident, with dominance taking supply from the 60-62% grey box. A breakdown back into the wedge would confirm the start of a significant downward move, leading to capital rotation into altcoins.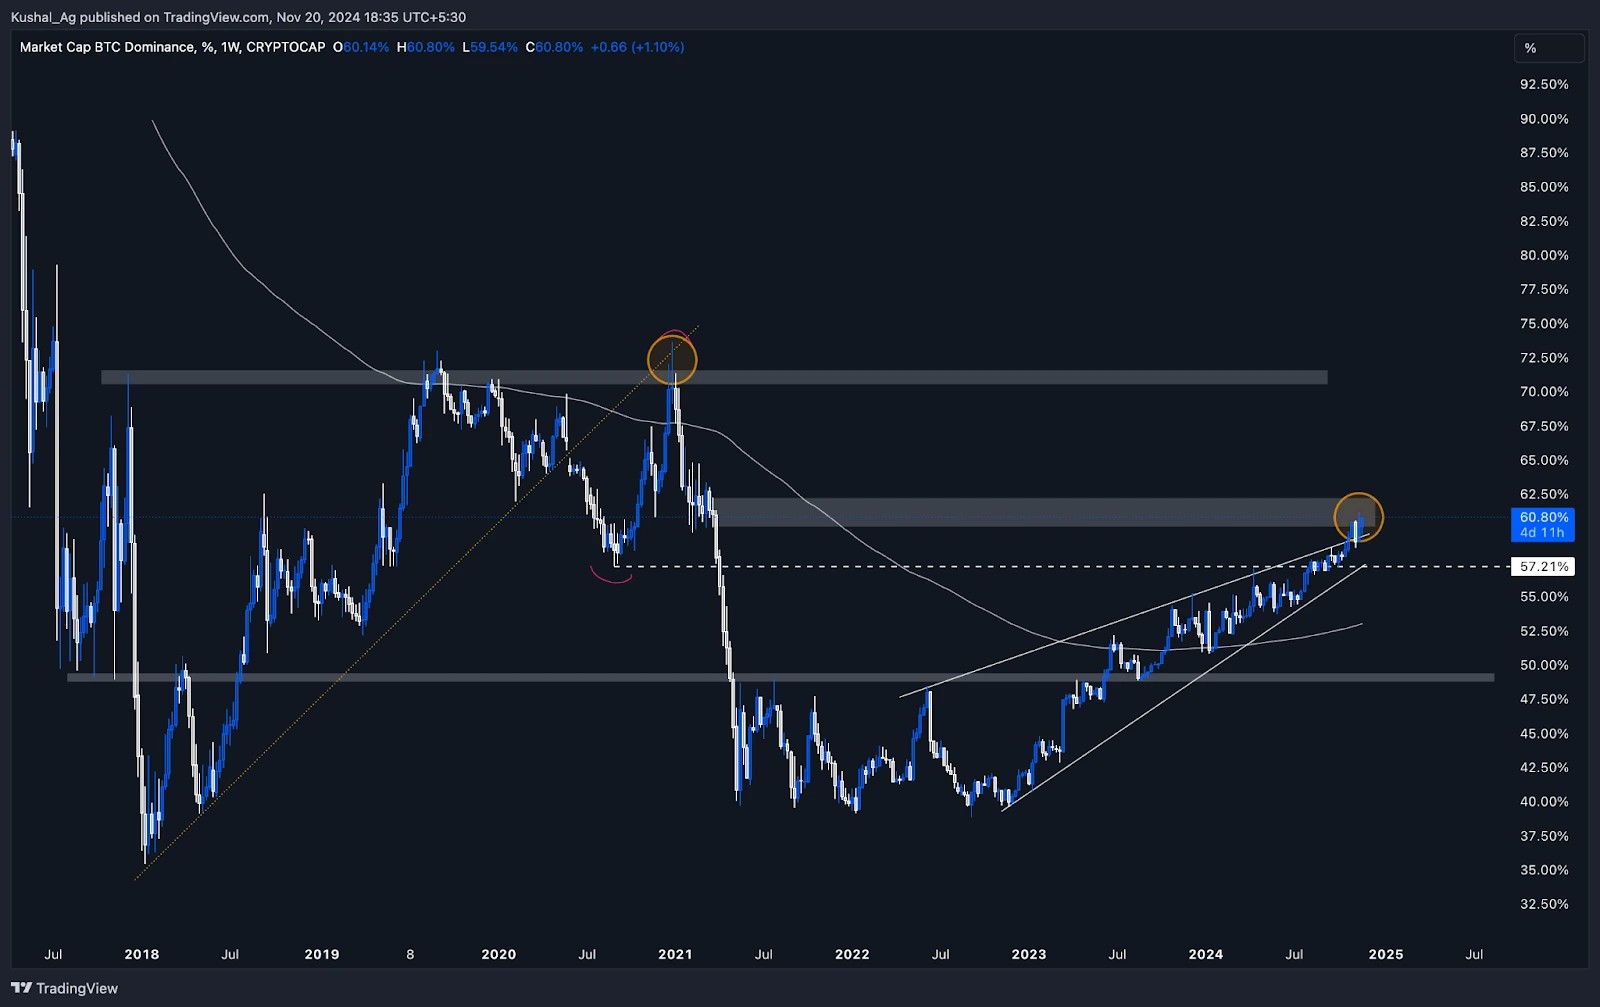
Key levels
- Resistance: The 60-62% range is a critical ceiling, signalling the peak of Bitcoin dominance for this cycle.
- Support: Initial support lies at 57.21%, followed by the 200 EMA on the weekly timeframe at 53%.
Conclusion
BTC dominance is nearing its cyclical peak, with a reversal expected in the 60-62% zone. Once dominance starts falling, it will pave the way for a broad altcoin and memecoin rally, echoing the patterns seen in late 2020.SOL/BTC
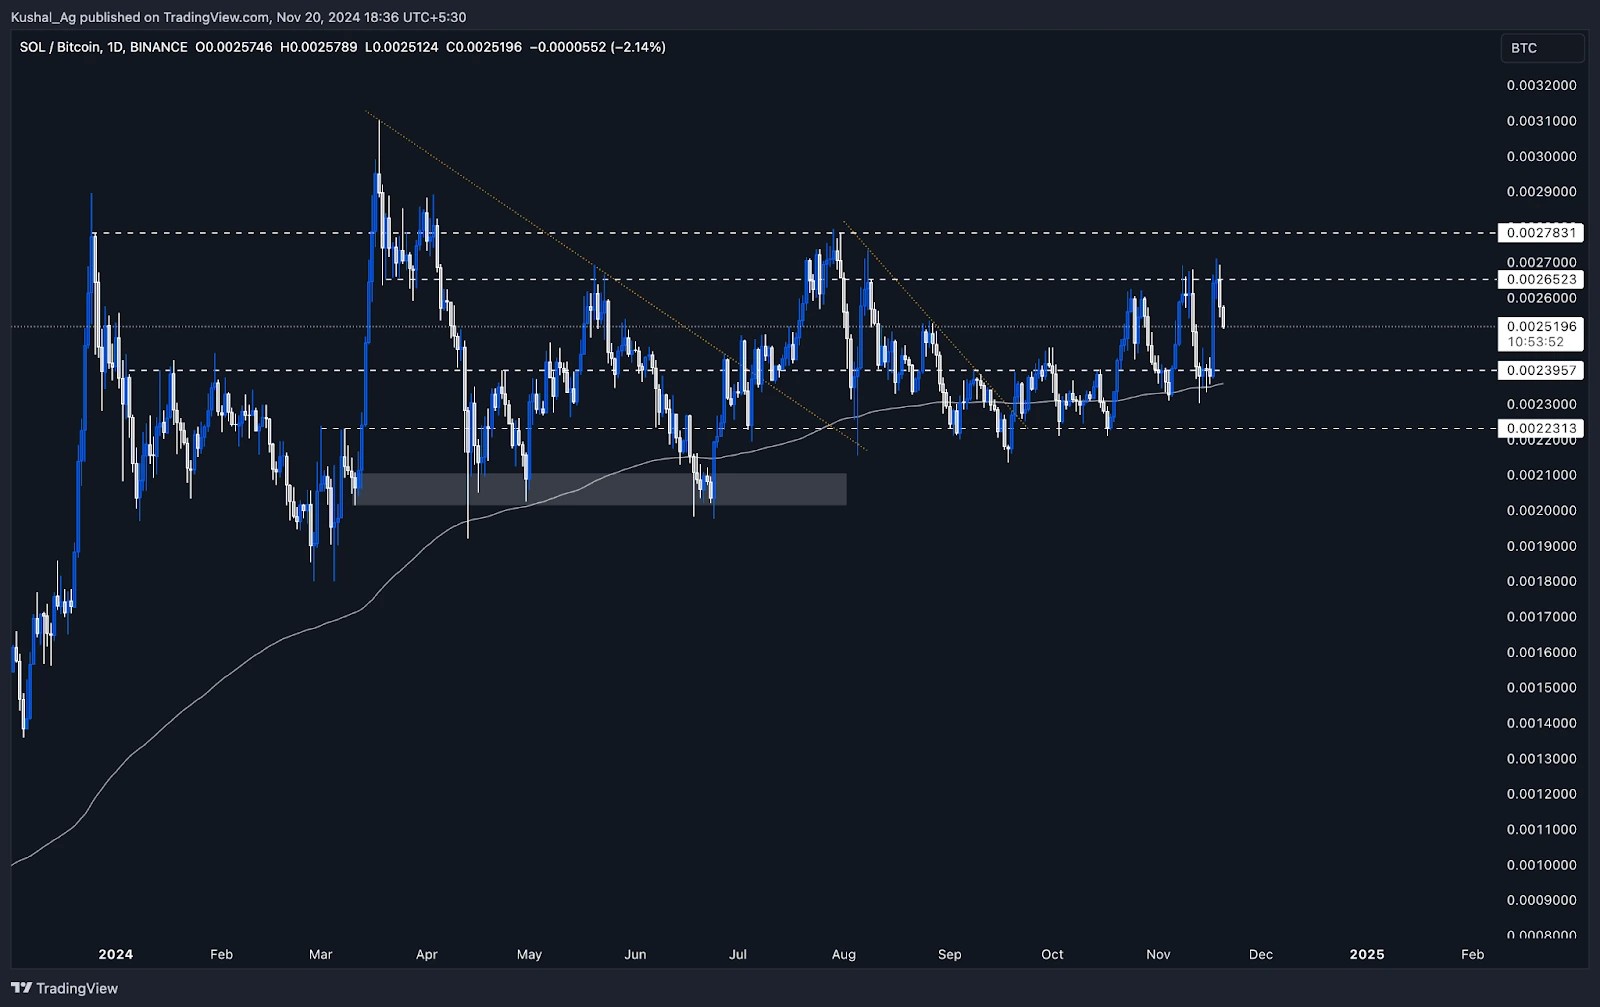
On the daily timeframe, Solana/Bitcoin is consolidating tightly within the 0.00239-0.00265 range, with the 200 EMA providing consistent support. This range has acted as a strong accumulation zone, building strength for Solana's next major move.Key levels
- Support: The 0.00239 region and the 200 EMA serve as crucial support zones, keeping Solana in a strong position.
- Resistance: A breakout above 0.00265 and 0.00278 is key for Solana to initiate a rally, targeting new higher highs.
Conclusion
Solana is ready for a breakout, with the 0.00265 resistance acting as the trigger point for its next leg up. Once cleared, Solana is likely to outperform Bitcoin, continuing its strong momentum in this cycle.SOL/ETH
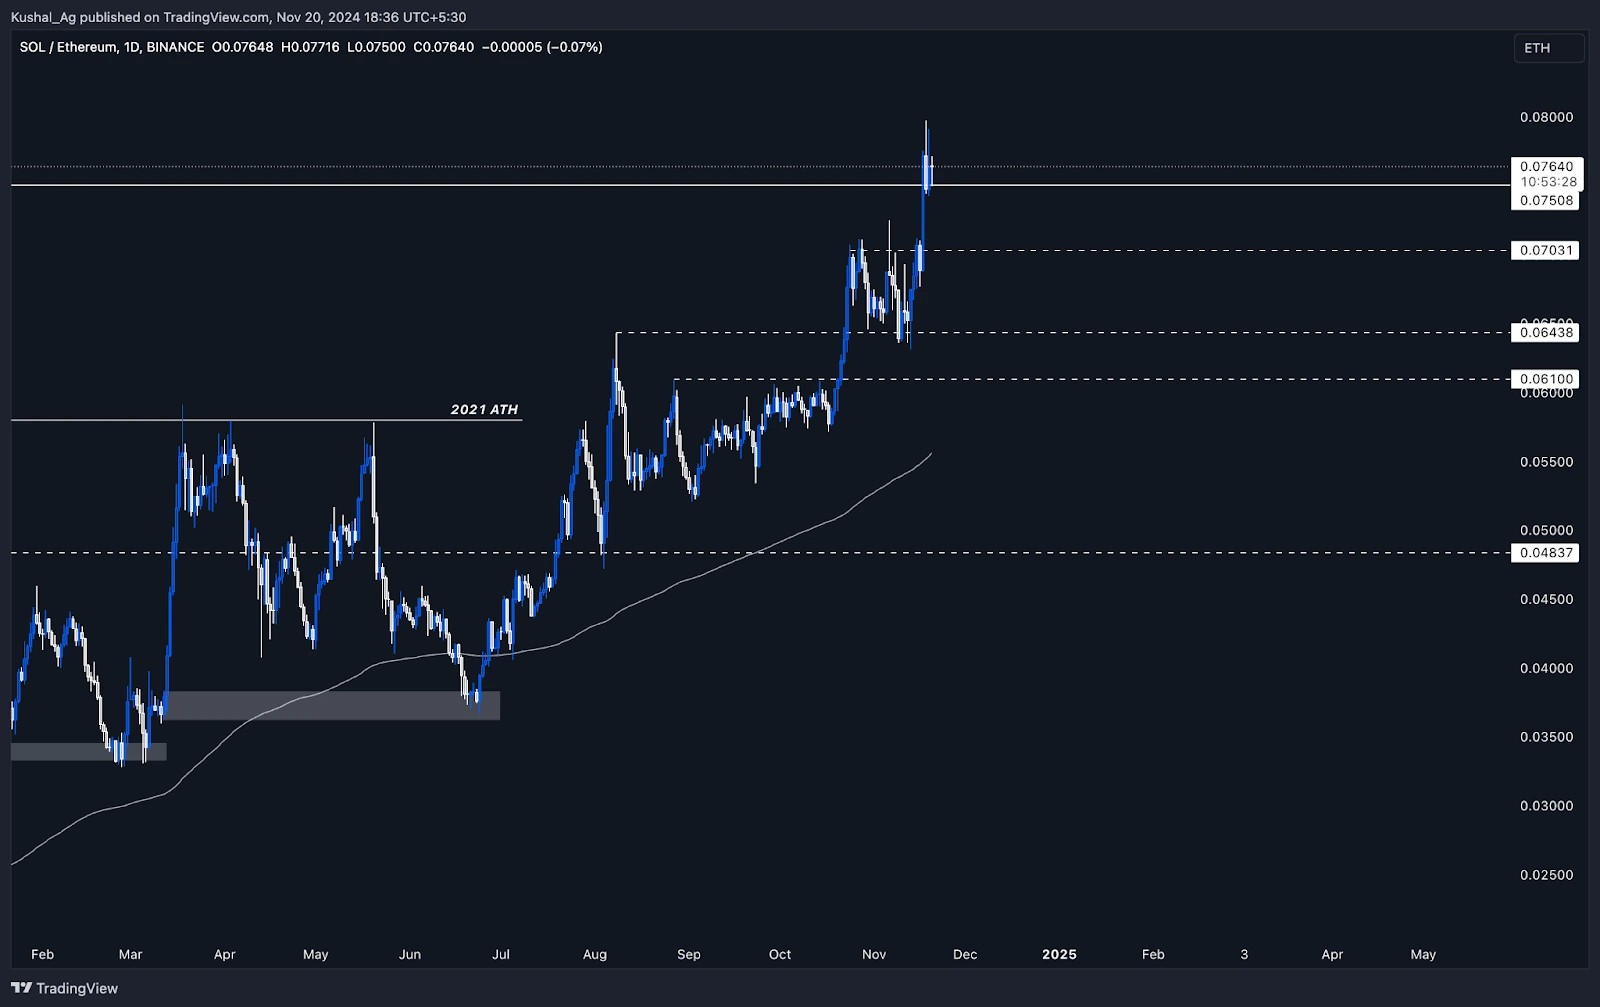
The Solana/Ethereum index has surpassed its Q4 2024 target of 0.075, trading at 0.076 and entering price discovery mode. This marks a significant milestone for Solana, which has consistently outperformed Ethereum throughout the year.Key levels
- Support: The 0.07 region serves as a strong base, with additional support at 0.0643, a previous resistance turned support.
- Momentum: Solana continues to dominate, but Ethereum's potential reversal on the ETH/BTC chart could introduce balance to this pair.
Conclusion
SOL/ETH remains bullish, with strong support levels in place. As Ethereum begins to wake up, we'll monitor how this pair reacts, but for now, Solana remains the leader.SOL dominance (SOL.D)
Solana's dominance has broken out of its 3.68% resistance, trading at 3.69% and nearing its 3.83% ATH. This breakout indicates that Solana is solidifying its market position and could continue capturing more shares in the coming months.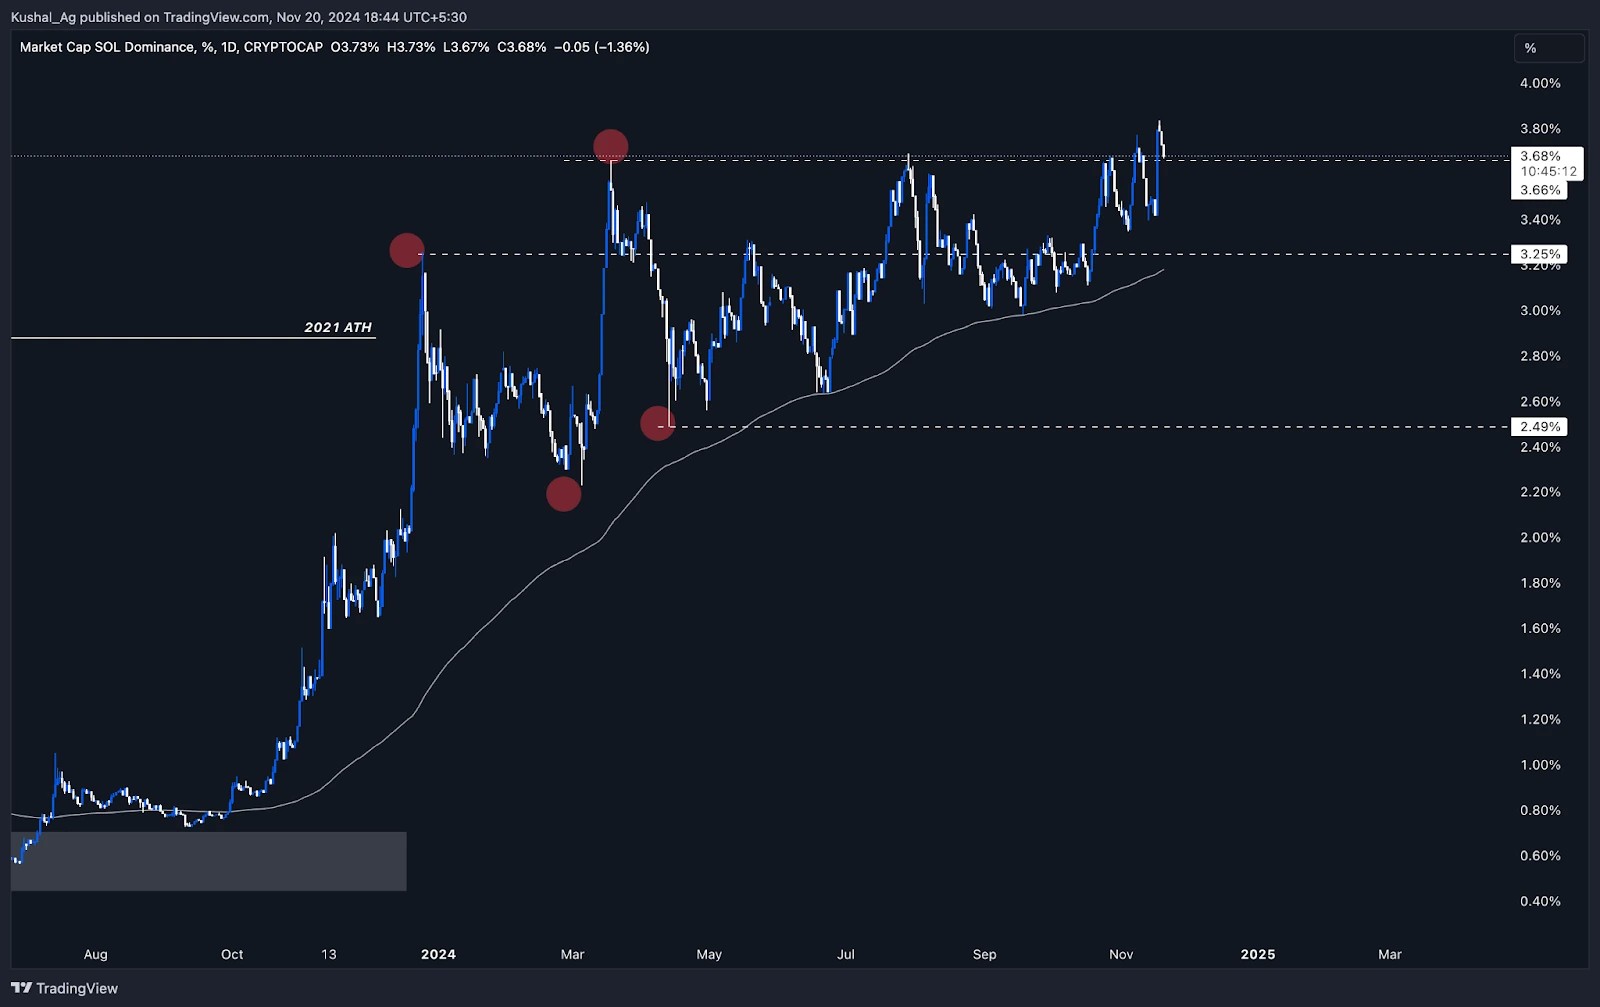
Key levels
- Support: The 200 EMA at 3.18% and the 3.25% zone remain strong bases for any pullbacks.
- Resistance: A sustained move above 3.83% will push Solana's dominance into new all-time highs.
Conclusion
Solana dominance is on the rise, breaking into uncharted territory. With strong support and momentum building below, Solana is positioned to lead the market into the next phase of the bull cycle.Cryptonary's take
The market is coiling up, and the parallels to late 2020 are impossible to ignore. Bitcoin has set the stage with its rally above $90,000, and the focus now shifts to Ethereum and Solana. Ethereum, trading near its cyclical bottom against Bitcoin, is primed for a reversal, offering long-term value and institutional appeal. Solana, on the other hand, continues to outpace Ethereum this cycle, dominating price action-wise and driving momentum across the market.Meanwhile, the Total Market Cap is consolidating at its all-time high, and Bitcoin dominance is peaking, signalling the start of a rotation into altcoins. This is the moment where altcoins, led by Ethereum and Solana, take centre stage.
Position accordingly- Ethereum for the long-term and Solana for this cycle's outperformance. The next phase of this bull run is shaping up to be explosive.
Peace!
Cryptonary, OUT!
Recommended from Cryptonary


