Save 23% ($351) & Get a Free 1-1 Call with our Team ⏰ : 0d 2h 59m 43s
Bitcoin Tracking Report
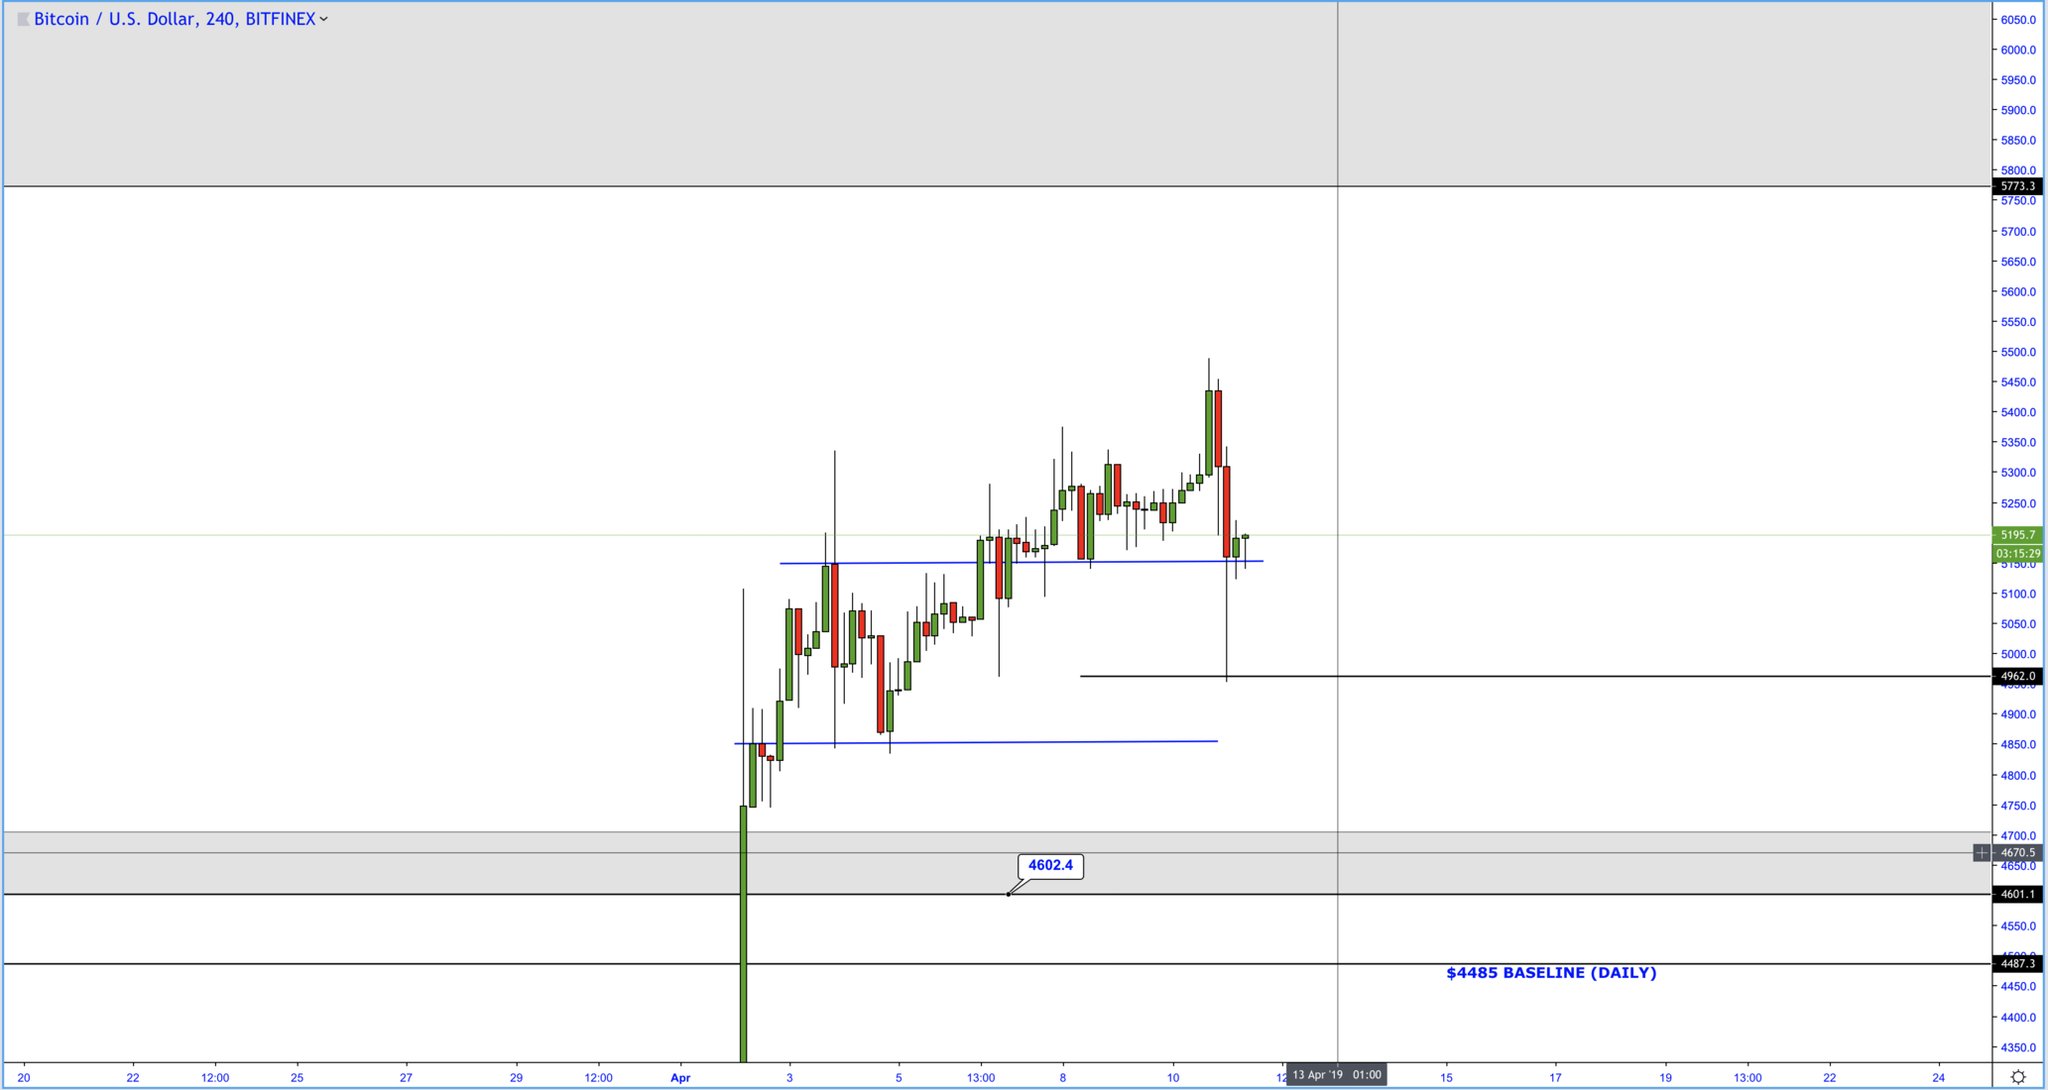
We left off with the notion that BTC was destined for further upside after the price broke through the critical region of $4700. The H4 chart above displays the price action on the 11th of April after some choppy consolidation. During this period price was screaming "what next?" but the Cryptonary team remained solidified with the bias for further upside into the $5800 level as a major weekly milestone was surpassed. I took my time to mark on a few crucial areas at the time and warned members that price might fluctuate massively due to profit taking and spots of low volume activity. In such a scenario, it's best to stick with H4 and 1D analysis, so we do not fall victim to intraday trapping and false signalling nonsense.
[caption id="attachment_1613" align="aligncenter" width="1024"]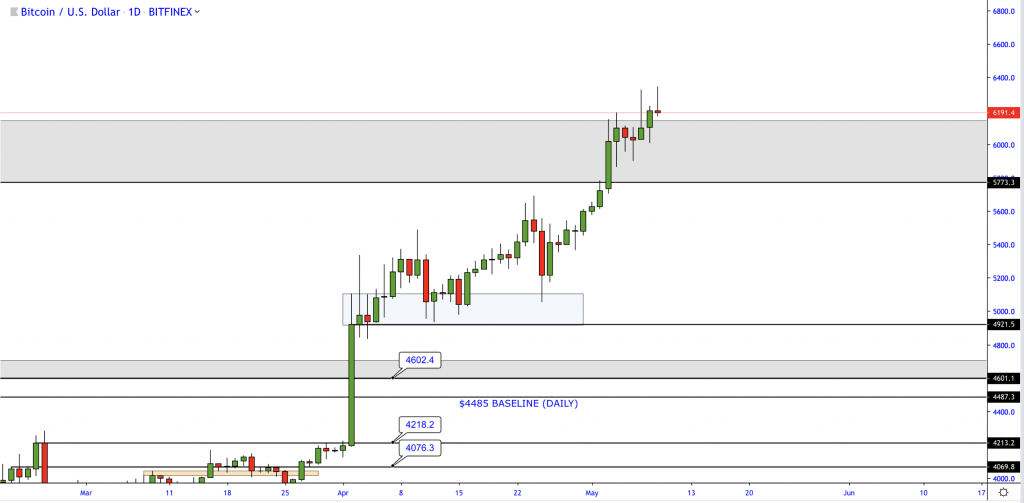 BTC 1D[/caption]
A little afterwards - Reverting to the Daily Timeframe I identified a solid area (taken from the candle spike highs) in which the price could dip back into to gather liquidity before moving higher. You can see P.A. enter three times before liftoff! BTC is then magnetised into a key weekly supply area which was covered early March. Price breaks $5800 and then hovers above $6000.
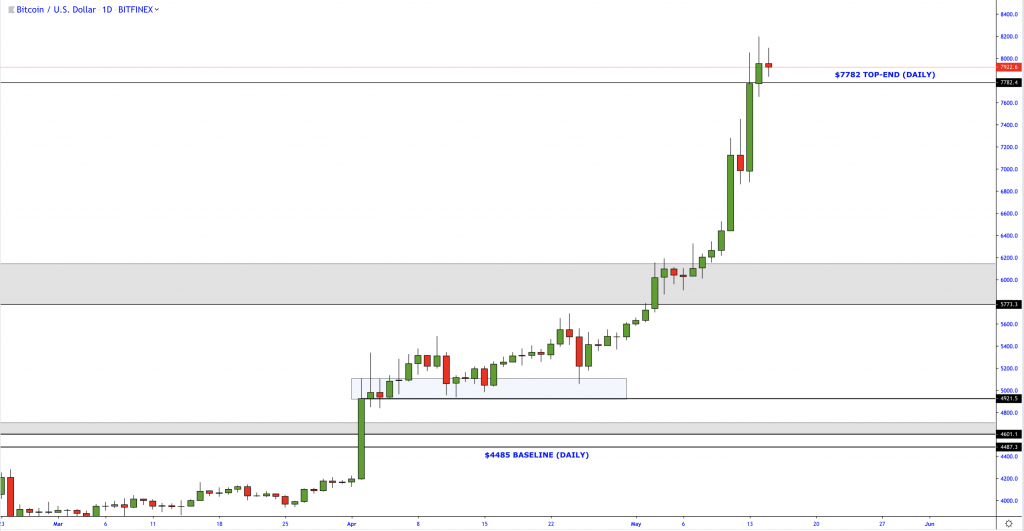
The highlighted weekly grey area highlighted above was a key factor in the next move. I stated that price could play around in this zone using it as "support" if you will, to gather further buying power with an upside target of $7780 (displayed above). The largest factor was the $6000 psychological level for our bullish sentiment confidence as absolutely no bears would step in unless a weekly closure below was solidified by the market.
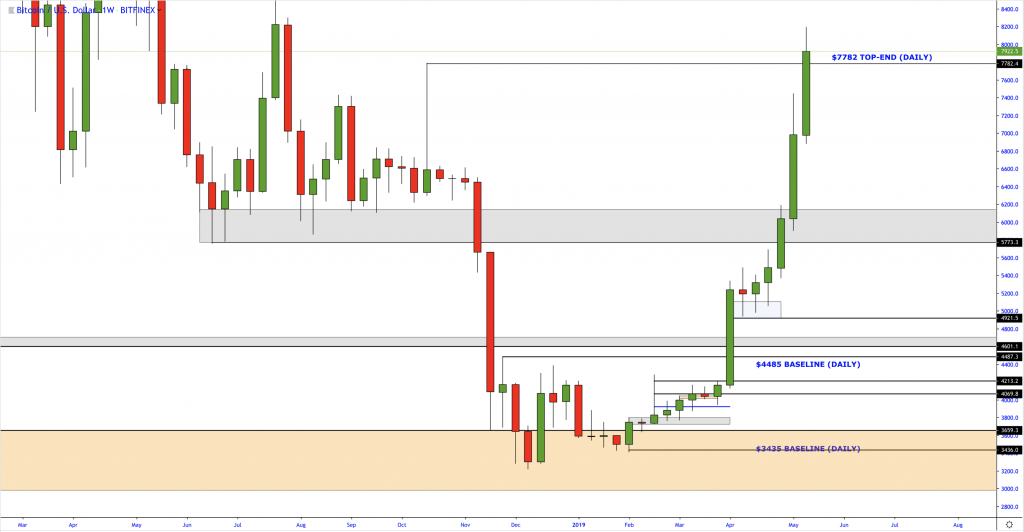
Lastly, the weekly chart below displays "top down" assistance from the previously mentioned daily zone. Multiple spikes reject the area before the momentum becomes evident and price shows no signs of slowing down tapped into the $6000 region. The upside wick high was fulfilled, and now we wait on the sidelines to gather the information necessary to predict the next move.
Thank You. Shaun Lee.
Recommended from Cryptonary


