Save 23% ($351) & Get a Free 1-1 Call with our Team ⏰ : 0d 2h 59m 44s
XRP Tracking Report
We left off with XRP reaching our primary target of $0.38, fulfilling a key Daily liquidity region while focusing on what exactly was next...to break or bounce. The above chart shows a clear relapse as XRP folds after spiking into the grey area, classic for this token due to low intraday liquidity.
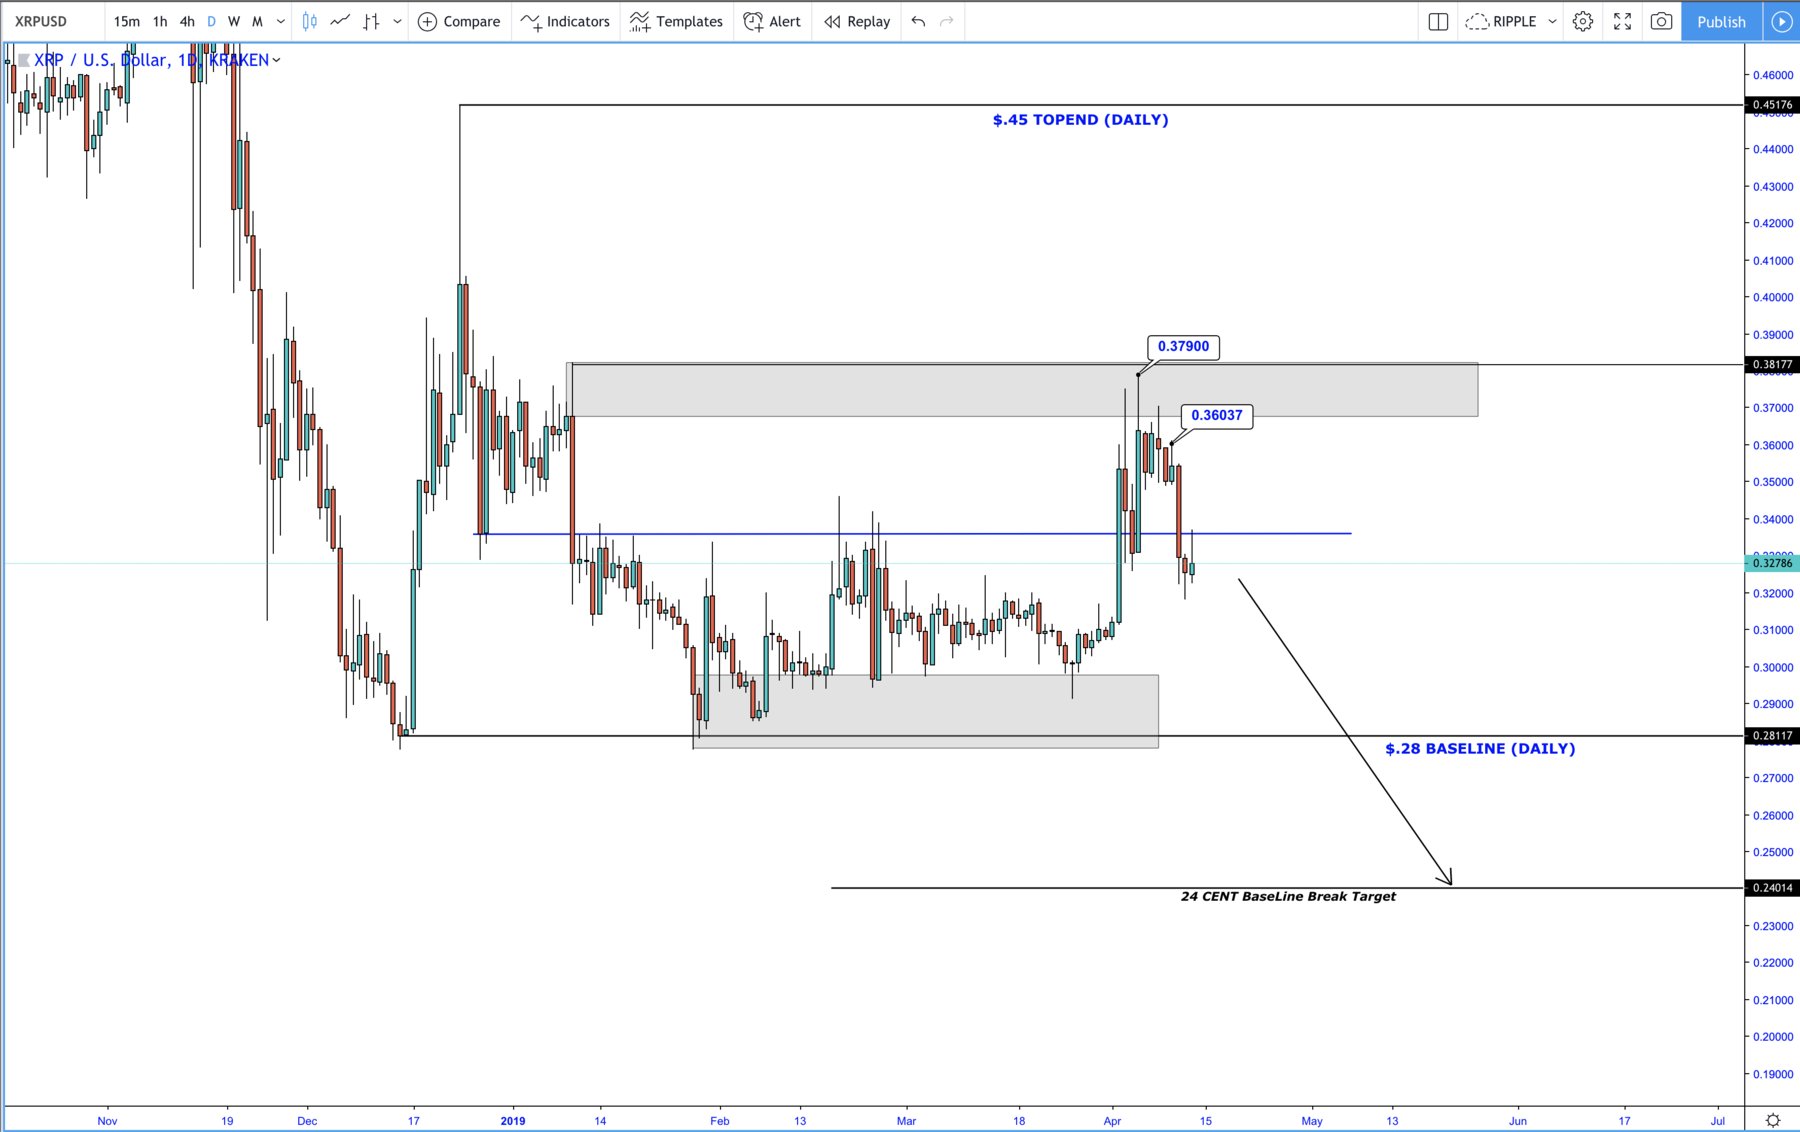
Due to sloppy weekly price action at the time, my initial projection was for XRP to lose bullish momentum completely, revisit the lower grey demand area then potentially break below to test the 24 cent price point. This bias was assisted by the principle of a new Daily lower swing high being solidified and a discretionary based judgement. What was also key is that price closed back below $0.33 (Blue line) on the 13th of April.
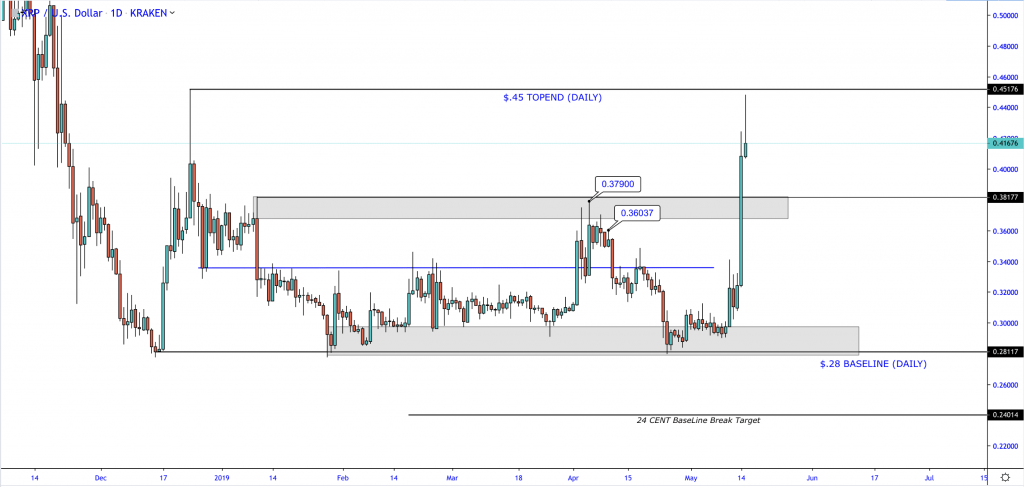
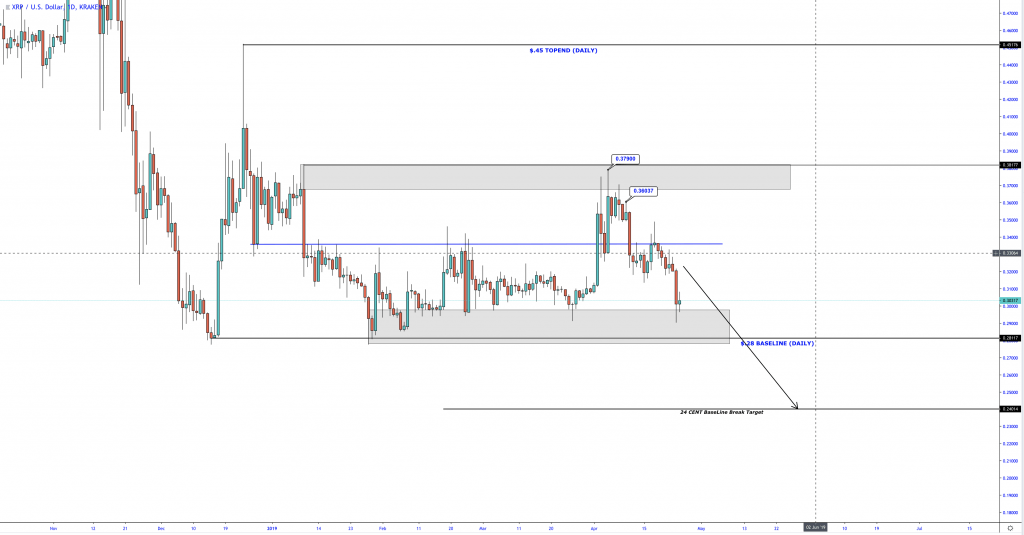
The chart above displays a downfall in price, back into the grey zone. The initial part of my bearish bias has been completed, and I was waiting for the price to break the zone - a potential fulfilment of $0.24 was on the cards, it was make or break. If the price decided to hold that level, then history would repeat itself with another upside move. I was ready for either side to be fulfilled as an acceleration in price would open up the pre-tested doorways into grey area 1 then overall $0.40. On the 14th May XRP reaches target 2 to the upside. We now sit on the sidelines, patiently for clarity.
Recommended from Cryptonary


