Save 23% ($351) & Get a Free 1-1 Call with our Team ⏰ : 0d 2h 59m 43s

Today’s Market Direction report paints a bullish picture across the board, with Bitcoin sitting in the upper bound of a larger bull flag pattern and its funding rate and open interest indicating a healthy market setup.
Meanwhile, Ethereum is primed to fill its "yellow buy box" between $2,900 and $3,090, potentially marking a major bottom for the second-largest crypto.
But the real story may be in altcoins like Solana, Avalanche, and the memecoins WIF and POPCAT.
The markets are still red, but all the signals remain bullish, and you should hold on through the consolidation.
TLDR
- Bitcoin is sitting in the upper bound of a bullish flag pattern, with healthy open interest and funding rate signals.
- Ethereum is primed to fill a $2,900 - $3,090 "yellow buy box", potentially marking a major bottom.
- Solana singled out as "play of the cycle", potentially offering a chance to add bags below $160.
- Avalanche presents an opportunity to build position if it re-enters the $41-$44 range.
- Memecoins POPCAT and WIF remain the top memes of this cycle; don’t let the current consolidation shake you out.
- Overall, markets may be red, but technical signals remain bullish across the board.
Disclaimer: This is not financial or investment advice. You are responsible for any capital-related decisions you make, and only you are accountable for the results. "One Glance" by Cryptonary sometimes uses the RR trading tool to help you quickly understand our analysis. These are not signals, and they are not financial advice.
BTC
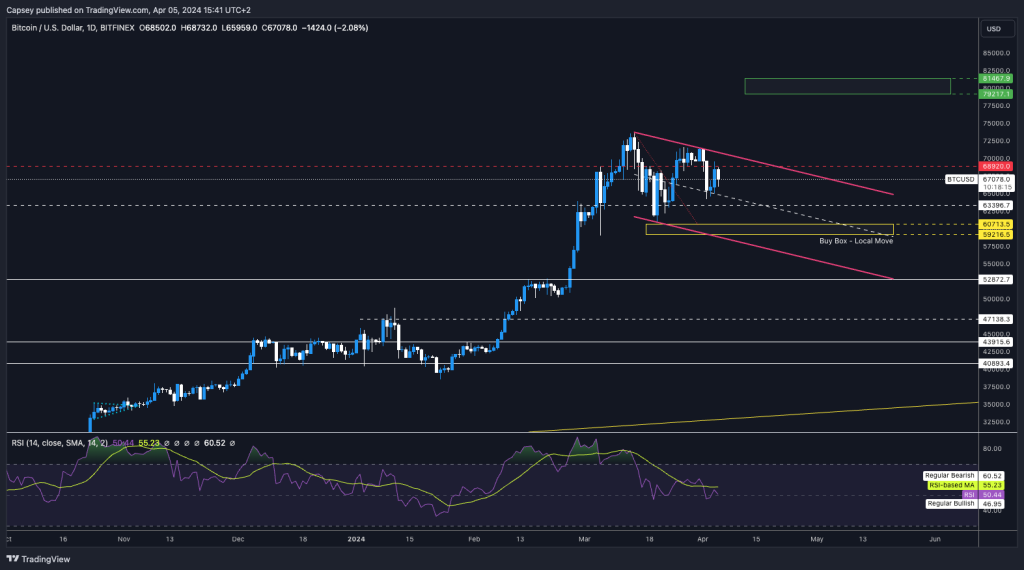
When looking at the rest of the market, Bitcoin looks very positive here. It is still sitting at $66,700, a 10% move away from its all-time high and in the upper bound of the larger bull flag pattern—bullish in the mid-and long term.The Open Interest (the amount of leverage in the system) has also come down substantially, now at $31.72b, having reached its high of $36.31b a week ago. This shows a slight cleansing for Bitcoin while the price remains 5% shy of $70k, which is really positive, we'd say.
The Funding Rate is at 0.01%, indicating no bias amongst traders regarding being Long or Short. Again, this is a very healthy setup. It’s good to see Bitcoin undergo this cleansing after being at very high leverage and frothy levels for a good month or so. This flush has been needed, but seeing that the price is still around $66k again, it is positive.
Technical analysis
- In keeping the TA aspect relatively simple, we have identified Bitcoin as being in a larger bull flag while price remains in the upper bound of the flag.
- It was positive that price came down and bounced (found support) on the 50% line of the bear flag channel, keeping price in the top half of the channel - this is bullish.
- Currently, overhead resistance is at $69k; if price can clear that level, then we should see a more major breakout. However, we do not expect this in the very short term; we expect more range-bound price action first.
- The bottom of the bull flag channel also converges with the Yellow Buy Box between $59,200 and $60,700. I (Tom) would see it as very positive if price pulled back, filled this box, moved slightly higher, and then continued the consolidation before a breakout of the bull flag sometime in May. This would be the most ideal set up, in my opinion.
- The RSI has reset substantially during the daily timeframe, which is good. However, the 3D and the Weekly timeframes still look like they need to be further reset (more price consolidation is necessary).
Cryptonary's take
Bitcoin looks very strong in comparison to altcoins. Bitcoin has been up 70% since late January, so pullbacks or periods of consolidation should be expected and are, in fact, healthy for the market.I (Tom) think it's ideal to see another 3 to 6 weeks of price consolidating between $59k and $70k, as this more likely sets up a better breakout of the bull flag sometime in late May. Overall, we're very content here and not looking to sell Spot bags. If price gets below $61k, we'll add more BTC to our Bitcoin Spot bags.
ETH
Like BTC, ETH's leverage setup has also reset substantially, with the Open Interest pulling back from mid-$13 billion and now sitting at mid-$11 billion. Alongside this, the Funding Rate is at 0.01%, indicating no bias on overall positioning. A clearing out of the froth that had built up and a reset back to a more healthy market, all round, more positive.Technical analysis
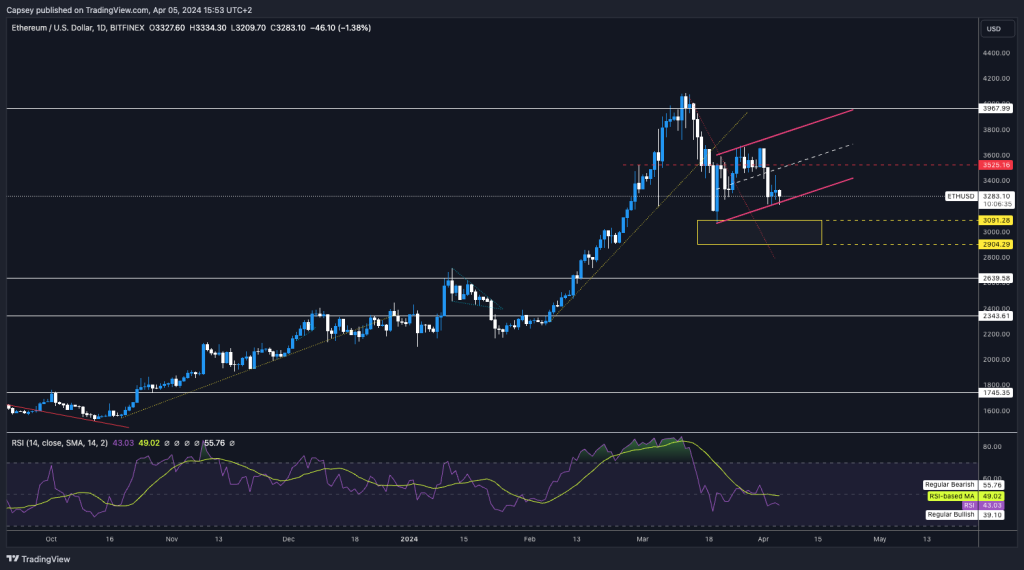
- ETH remains in a bear flag (the bias is for them to see price breakdown). Price is now resting on the bear flag’s bottom border, having rejected from the key horizontal level of $3,525.
- We expect this pattern to break down and for ETH to fill its Yellow Buy Box. If we get this, we'd consider adding to our ETH bags between $2,900 and $3,090.
- The RSIs on the larger timeframes have reset more, but they could still use a more substantial reset that would build confidence in traders that we may be at a potential major bottom.
Cryptonary's take
Setup-wise, ETH does not look anywhere near as good as Bitcoin, but if the market does pull back, we see ETH dropping and potentially filling its Yellow Buy Box between $2,900 and $3,090.If this were to happen, we'd expect it to be a major bottom for ETH’s price likely. If you're bullish on ETH, then the Yellow Buy Box may be a good area to add to your ETH bags. However, I am more bullish on SOL and the SOL ecosystem, so more of my focus and allocation of capital will be there.
SOL
Again, it has a much cleaner outlook from the leverage point of things. OI has declined considerably while the Funding Rate sits at 0.01%. From a mechanics point of view, SOL is positioned similarly to BTC and ETH. It is much more positive from this perspective.Technical analysis
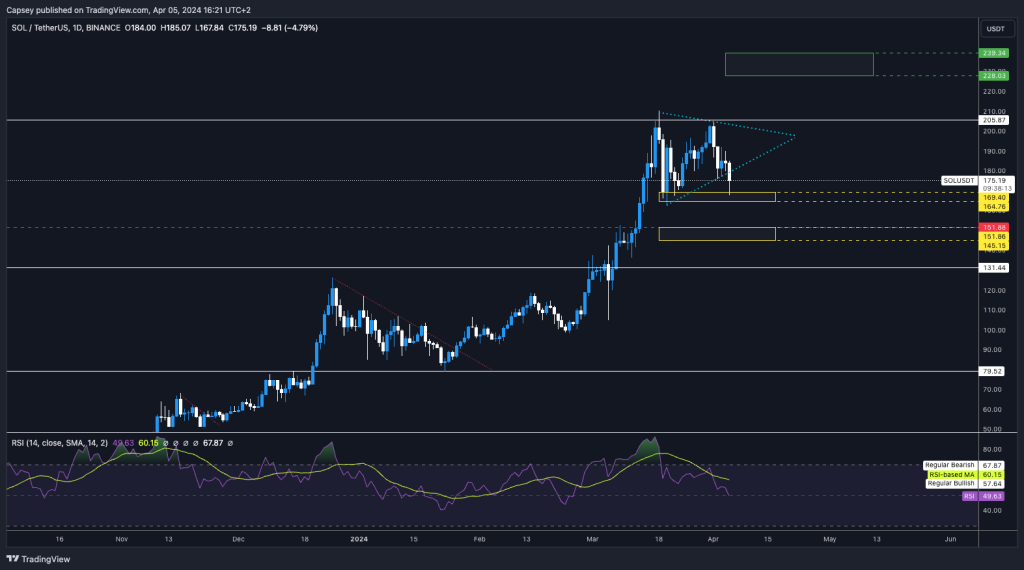
- Once again, the Yellow Buy Box (between $164 and $169) acts as a liquidity grab, and the market goes up from there once it fills, like absolute clockwork.
- SOL has broken down from its pennant pattern and filled the upper Yellow Buy Box again. The next objective will be to see if price can reclaim the pennant; for now, price is just beneath.
- The RSI has reset on the Daily timeframe and is now out of the overbought territory on the 3D and the Weekly, but only slightly. We would like to see this reset more substantially, which might require further consolidation or a further pullback in price.
- The lower Yellow Buy Box (between $145 and $151) would be the ultimate level to reload on buying SOL. It's in question whether we get there or not; there is probably around a 40% chance that we do.
Cryptonary's take
As many of you will now know, I (Tom) believe SOL is the play of this cycle.Even though I see only a 40% chance that the lower Yellow Buy Box fills at that level, I will be lightly adding to my SOL bags under $160 if the price gets there. My personal feeling is that we will. And even though I put the odds at a 40% chance the lower Yellow Box fills, I actually think it may fill.
However, I have had a lot of questions recently about this. Just because I think something may go lower in the short term does not mean that I am looking to sell at current prices and re-buy lower. You have to get this so spot on to get this right, and it might only be worth an additional 8-10% more coins. It's just not worth the risk, in my opinion.
AVAX
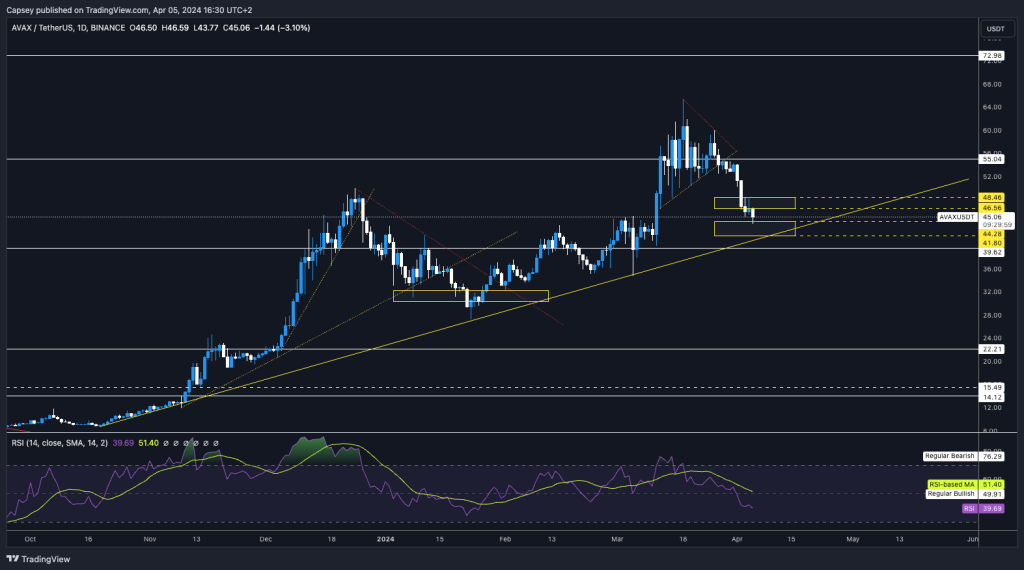
- For those with zero exposure to AVAX, it may be worth building a small position if the price re-enters the lower Yellow Buy Box between $41.80 and $44.20.
- AVAX remains in a larger uptrend (identified as the thicker yellow uptrend line).
- There are also horizontal supports between $39 and $42, so the lower Yellow Buy Box may represent a good opportunity to fill Buy Orders for the long term.
- The RSI has also been more meaningfully reset, even though there is room for it to come down slightly further on the 3D and Weekly timeframes.
Cryptonary's take
AVAX is personally (Tom) one I have 0 exposure to. However, I may look to build a small position in it for the next 9-15 months by taking advantage of buying it between $42 and $44 if it refills the lower Yellow Buy Box. If the uptrend line holds for price, then it's all good. However, if it fails and the price breaks below, then it's possible we will see $35 be tested.RUNE
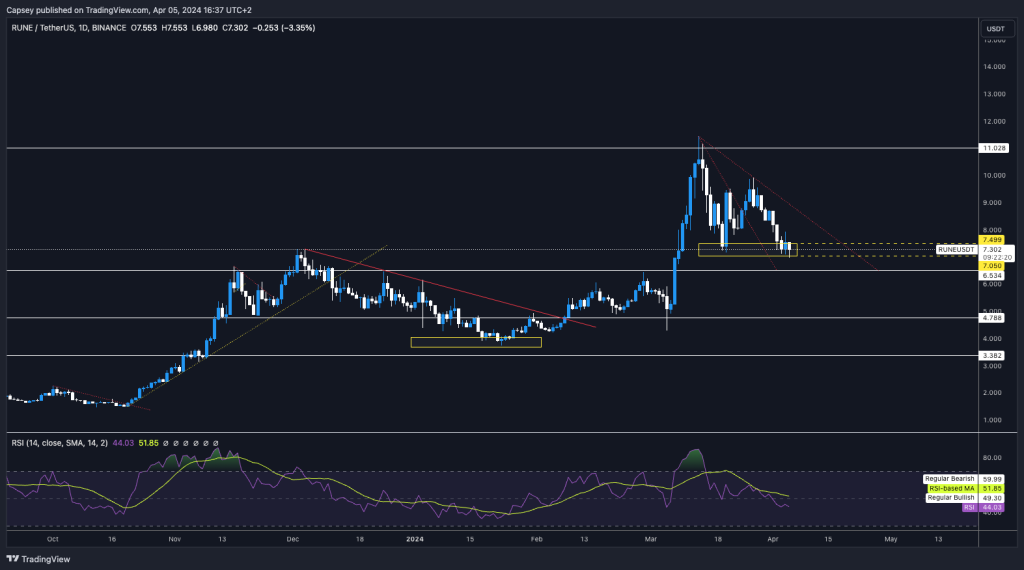
- Price rejected into the main horizontal resistance at $11.02. It has come down and filled the Yellow Buy box, bounced, pulled back, and is now refilling the box.
- There are large layers of support between $6 and $7. Even though this is a wide range, price should be able to find a bottom in this range.
- The RSI has reset substantially on all major timeframes, which is positive.
Cryptonary's take
For those that like RUNE and are bullish on RUNE long-term, between $6.50 and $7.00 might be a good area to add to your bags, with sub $6.50 down to $6.00 looking like an even stronger level. I (Tom) personally do not hold RUNE.RNDR
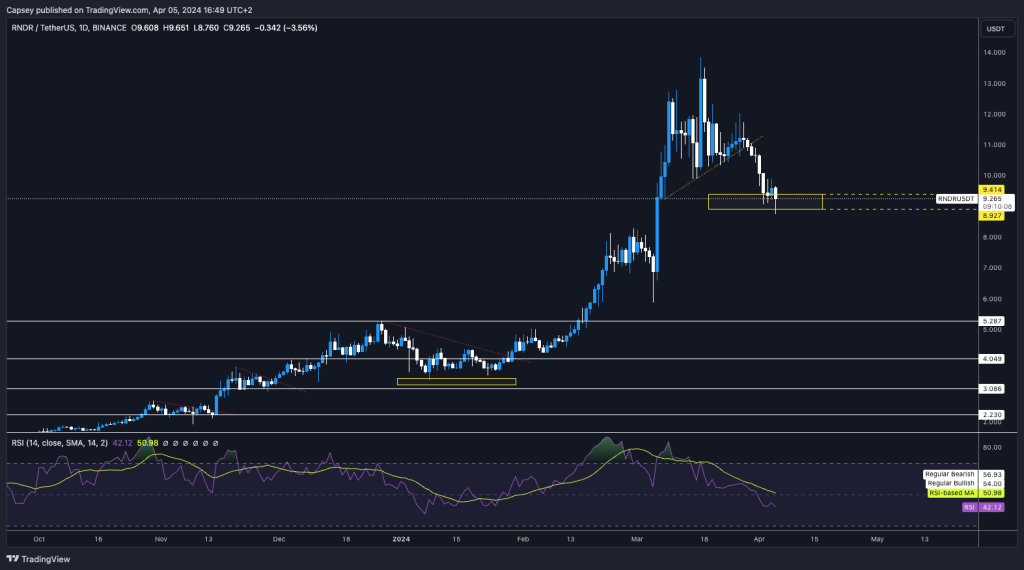
- As we highlighted in our last analysis, we were patient and waiting for RNDR to go lower and fill its Yellow Buy Box, which is exactly what we have.
- Price has now filled the whole of the box between $8.90 and $9.40.
- It's possible that price has a small bounce and then goes lower, testing the liquidity area between $7.20 and $8.20. However, we do think it would be good to build a small position at the current price (between $8.90 and $9.40).
Cryptonary's take
RNDR is a big player in the SOL ecosystem and will likely perform well over the coming quarters. price is currently between $8.90 and $9.40 in one of our Yellow Buy Boxes, and therefore, this may be a good level to begin picking up a bag of RNDR.WIF
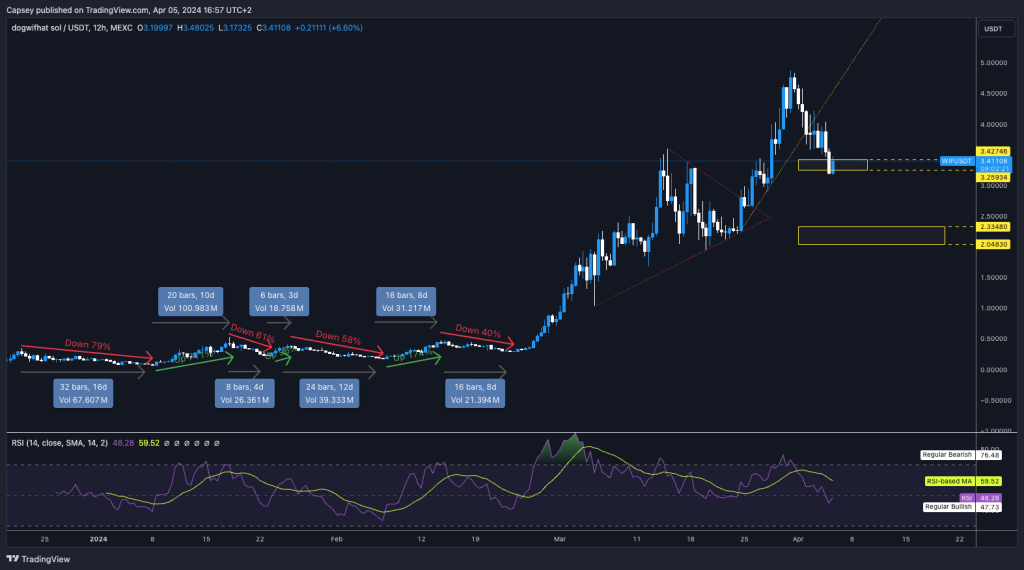
- Looking at WIF on the 12-hour timeframe, we can see that price has broken below its uptrend line and is now filling a local Yellow Buy Box (between $3.25 and $3.42), although personally, to add to our position, we would wait for lower.
- The major Yellow Buy Box is between $2.05 and $2.33. If we were under-exposed, this is where we'd look to add WIF more aggressively.
Cryptonary's take
We see WIF as the likely major player in the meme space this cycle, and therefore, if a ripe entry is presented between $2.05 and $2.33, we will look to take advantage of it.POPCAT
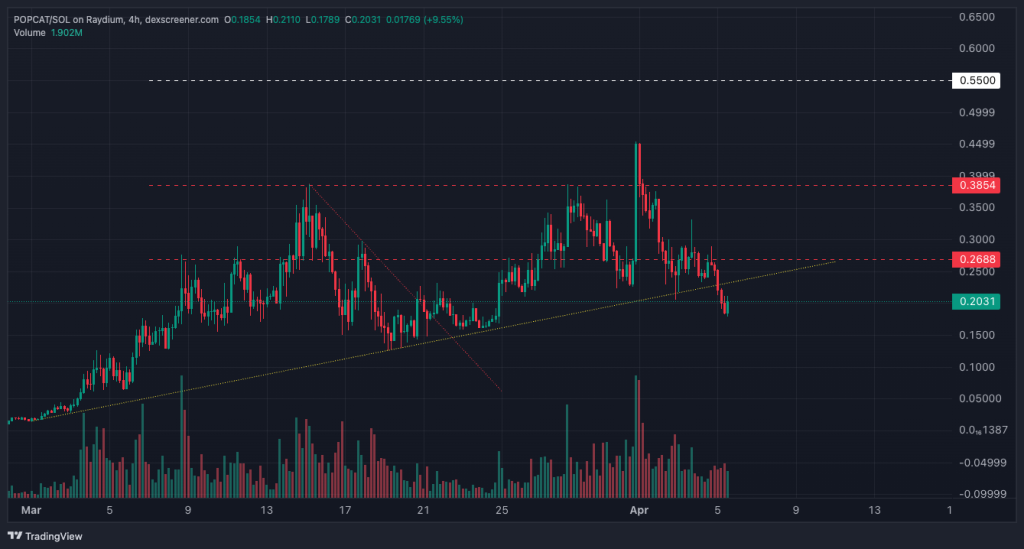
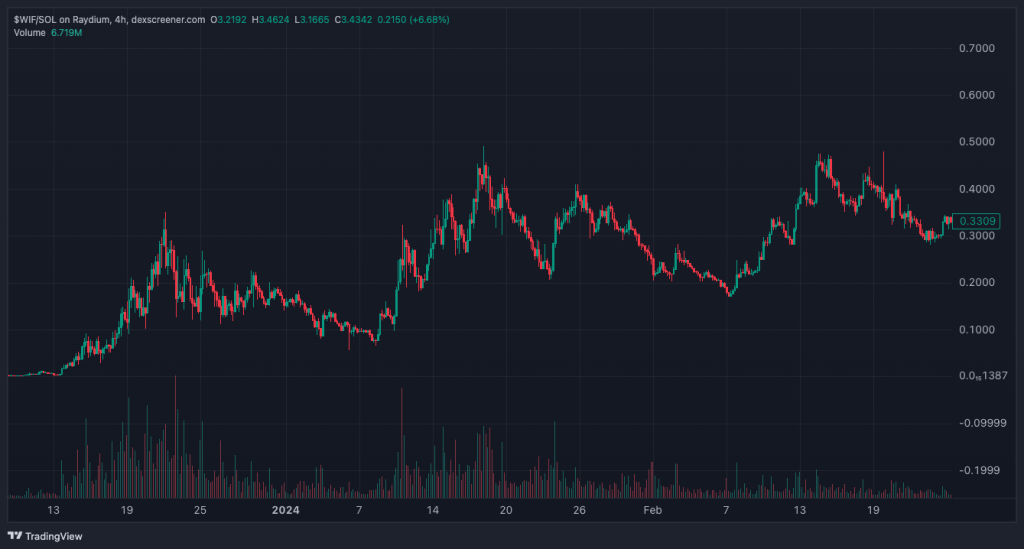
- Looking at POPCAT, price action-wise, it seems to be playing out remarkably similar to WIF in its early days. When WIF broke out of $0.01 on 13 December, it was range bound between $0.08 and $0.40 until late February, when it broke out and surged to $1.80 in less than a week.
- POPCAT broke out of $0.01 on February 29th, so we're really only five weeks into the process, of which WIF took ten weeks before going truly parabolic. This suggests that POPCAT may have range-bound price action in the coming month.
- POPCAT may even move to the $0.15 area again before moving up to $0.40, potentially pulling back to $0.30 and then popping from there.
Cryptonary's take
This is one I personally have a big bag in. Sometimes, its price action doesn’t look as good as other memes, and sometimes, it looks as if it's heavily outperforming other memes, but in general, this is how memes go.We're not looking to sell here, as we still think POPCAT has huge upside targets, well north of $1.00. We have tagged WIF's charts below from the early days (a few months back...) and then shown the breakout, and we have shown the current POPCAT chart against that.
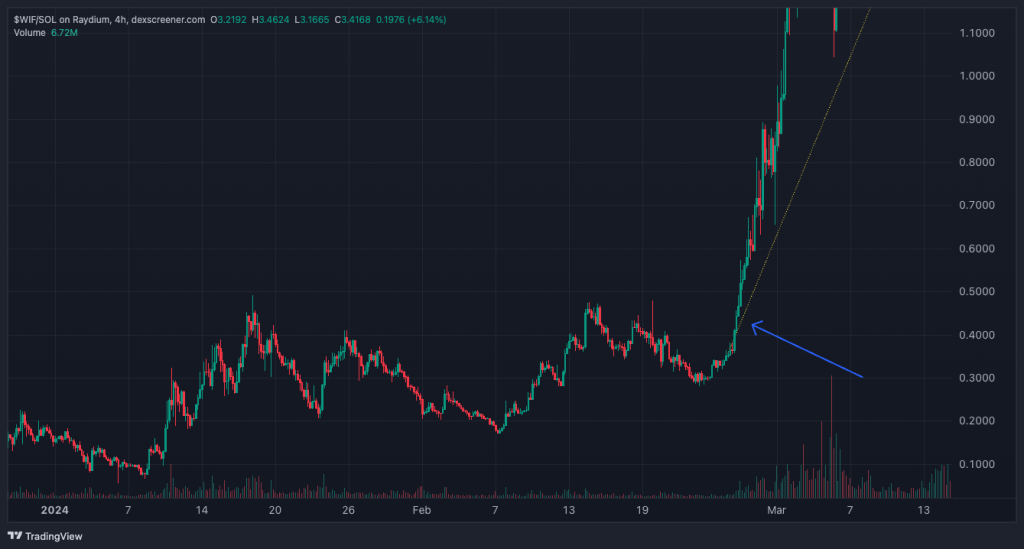
We hope this puts the POPCAT chart in context against WIF for you and may put some of you at ease.
Now, this is the meme's space, so anything can happen, but we are confident that POPCAT can do very well, so we're looking to hold and continue riding this out for whenever the market breaks higher.
Recommended from Cryptonary


