Save 23% ($351) & Get a Free 1-1 Call with our Team ⏰ : 0d 2h 59m 43s

Just when you think you've unravelled the clues, new puzzling signals emerge to cloud the picture.
Today's market update aims to decode one such tantalising signal - the potential formation of a bullish breakout pattern for Bitcoin amid an economic landscape of mixed messages and uncertainty.
Let's dive in.
TLDR
- Strong manufacturing PMI beats forecasts, but with rising price pressures
- Inflationary forces make imminent rate cuts difficult despite dovish bias
- Bitcoin is potentially forming a bullish "bull flag" pattern amid ranging market
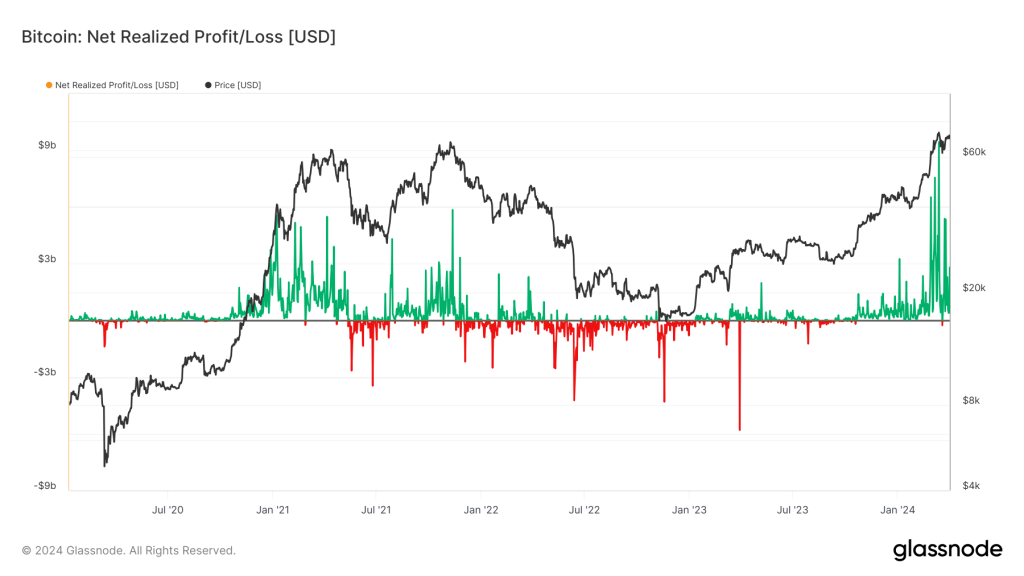
- Net realised profit/loss shows reduced selling into new highs
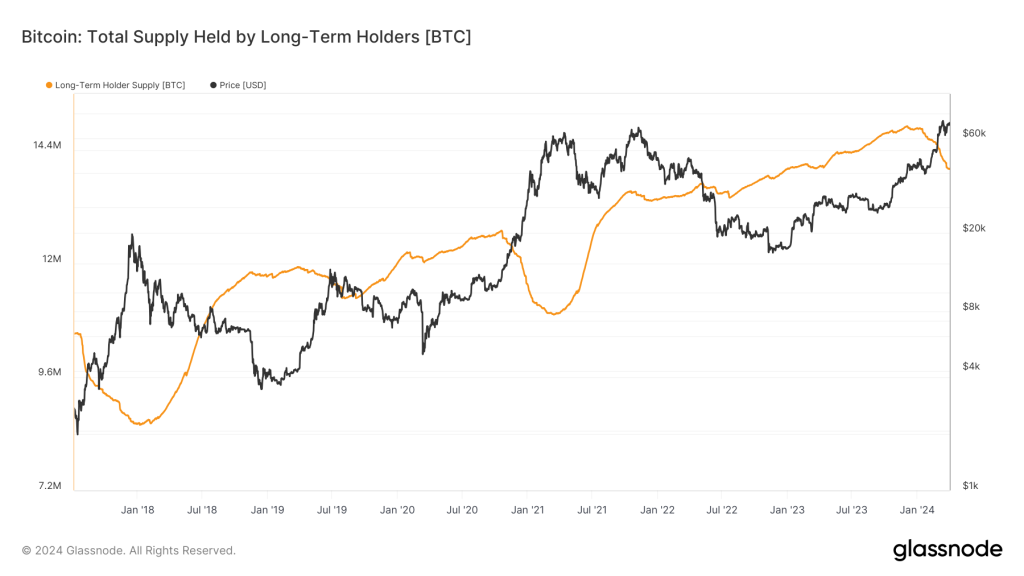
- LTH supply levels are similar to pre-bull run stages of past cycles
- Despite volatility, recent rallies in WIF and POPCAT are enough reasons to stay resolute.
Disclaimer: This is not financial or investment advice. You are responsible for any capital-related decisions you make, and only you are accountable for the results. "One Glance" by Cryptonary sometimes uses the RR trading tool to help you quickly understand our analysis. These are not signals, and they are not financial advice.
Strong economic data and its effects
On Monday (yesterday - April 1st), we had the Manufacturing PMI data out, which came out at 50.3, well above the 48.4 consensus.This increase in Manufacturing shows that the economy is expanding and growing potentially more than economists first thought in Q1 24. What was also alarming was that the prices paid component came in at 55.8, well above the 52.7 forecast. This indicates that prices are increasing—this increase was, however, driven by higher commodity costs. But, regardless of what is driving it, it is inflationary.
Why is this important? Why are we looking/focusing on this?
Well, an expansionary economy with prices paid increasing - with a big element of this being commodity prices increasing - is inflationary, therefore making it more difficult for the Fed to cut rates in June or even July if the economic data continues to come in strong. The reaction to this yesterday was a slight sell-off in Equities, an increase in the Dollar (DXY) and an increase in Bond Yields = risk-off environment.
Alongside this, the market has now priced a June rate cut at less than 50%, with a July cut also now in question. The Fed is biased toward cutting rates as needed to reduce the interest they pay on their debts, but that'll be difficult for them to do in an expansionary economy.
We cover this topic in greater detail in the 'Monthly Report' that I (Tom) am currently writing. To add to the above, we have Unemployment data out on Friday, April 5th. Expectations are for strong numbers, but we'll cover this closer to the time.
On-chain data indicates range-bound price action
We had predicted a pause in positive price action several weeks ago, simply because many 'Market Indicator' on-chain metrics looked overbought in the short term. Trading indicators also suggest the same.Net realised profit/loss
If we look at the net realised profit/loss, we can see that on the first move into price all-time highs, a large amount of profits were realised, which is expected and typical of prior cycles.Price then remains range-bound in and around all-time highs while realised profit-taking decreases. Then, the price tends to break out to new, fresh highs and becomes more euphoric following that. We're currently pre-that-stage, as we're seeing realised profit-taking decreasing (fewer large green spikes are shown in the chart below).
Long-term holder supply
If we look at long-term holder supply, we can see that it has begun to sell off some of its supply—as it always does—into new price all-time highs. However, the current level looks similar to that of December 2020.As we know from the last cycle, the market topped (on-chain-wise via retail excitement) in early May 2021. This would suggest that we have at least six months more of the current cycle. However, let's also note that this cycle seems more 'left-sided'; we're not even at the next Bitcoin halving event yet.
Cryptonary's take
So, we have called this current decline in the market for some weeks – a topping market in the short term, but we don't expect major pullbacks of, say, 35%-40%.In prior bull markets, we've seen 25% to 40% pullbacks, but in the new cycle, it's likely we see less severe pullbacks of maybe just 15% to 25% as there is a more mature crowd in the market this cycle—TradFi. Note: we have already seen a near 20% correction when BTC's price went from $73,500 down to $60,900 – but that's all fine.
Moving into April, we see that the range-bound price action will likely continue between $60k and $70k. Perhaps we will see another retest of $60k, and it could potentially go as low as $58k, but I'm not seeing this as most likely.
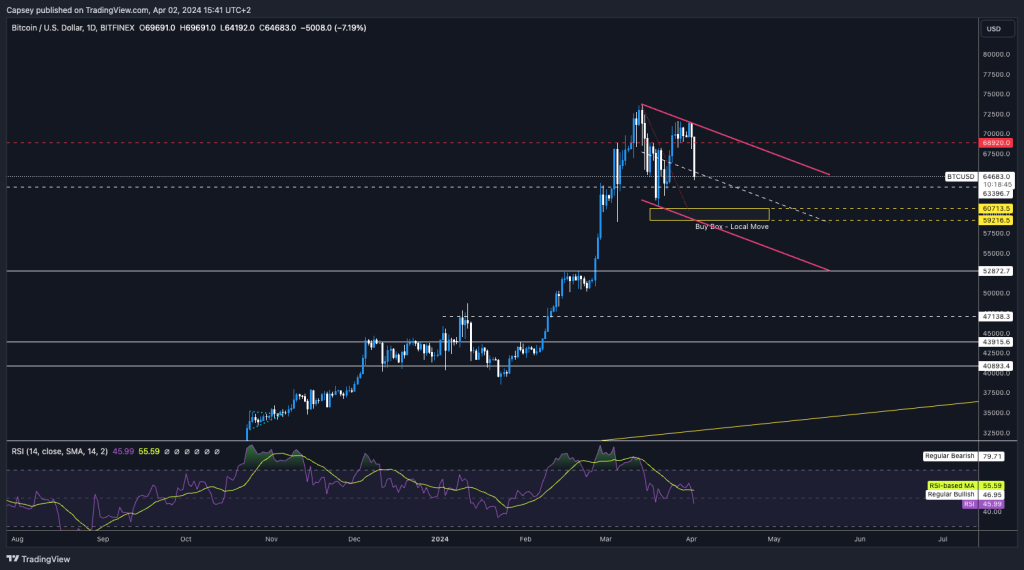
I expect it to be range-bound between $60k and $70k, keeping it general. When looking at the Bitcoin chart, and I haven't seen this analysis anywhere yet, it could be possible that if we get range-bound price action for another 2-4 weeks, Bitcoin forms a large bull flag pattern.
This would look incredibly bullish for a breakout towards the end of April, setting us up for a brilliant May through August period.
Remember, pullbacks are likely and completely normal. So far, we've only seen one 20% pullback, which is very typical of Bitcoin bull markets. So, nothing here for now worries me.
We'll continue to monitor the macro/inflation picture. Still, for now, we expect more range-bound price action before heading considerably higher in 3-5 weeks... especially if Bitcoin forms a large bull flag in the coming weeks.
On a side note, memes. Yes, they're phenomenally volatile because the orderbooks are thin, etc. But let me remind you. On 26th February (less than five weeks ago), WIF was $0.40 and POPCAT was $0.011. So, when you're in the volatility, zoom out.
Don't fumble the bag!
Cryptonary, Out!
Recommended from Cryptonary


