Save 23% ($351) & Get a Free 1-1 Call with our Team ⏰ : 0d 2h 59m 43s

TLDR:
- Over the past weeks, TVL has taken a hammering due to native token prices falling and the amount of tokens staked decreasing.
- Due to the collapse of the Terra blockchain in terms of staking, Terra is no longer in the top 10 chains by TVL, so many of the other top 10 chains have gained market dominance. Tron has reaped the most rewards, gaining more than double its market dominance than it had before.
- Over the past 30 days, all of the top 10 chains have seen large TVL losses other than Tron.
- Over the past 30 days, many of the top 10 protocols have also seen TVL losses. Anchor is the notable loser, seeing its TVL down 99% in just a few weeks and losing its position amongst the top 10 protocols by TVL.
Market By Numbers – Total Market TVL
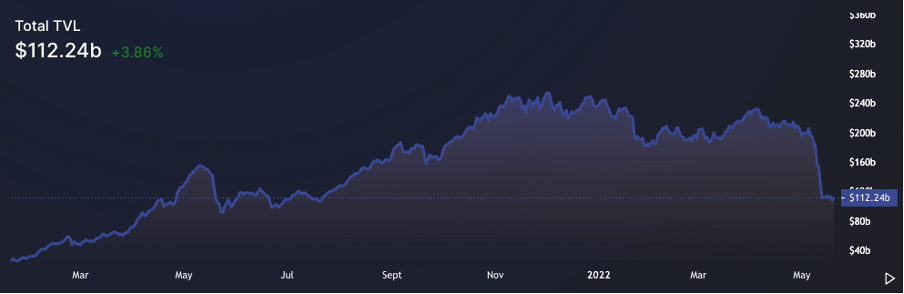
We will begin this report by looking over a summary chart of the Total TVL of the market. This gives us an indication of the overall TVL in the market and how it has changed over the last 7 to 30 days. This enables us to identify trends and when trends may be turning for us to position our own portfolios accordingly.
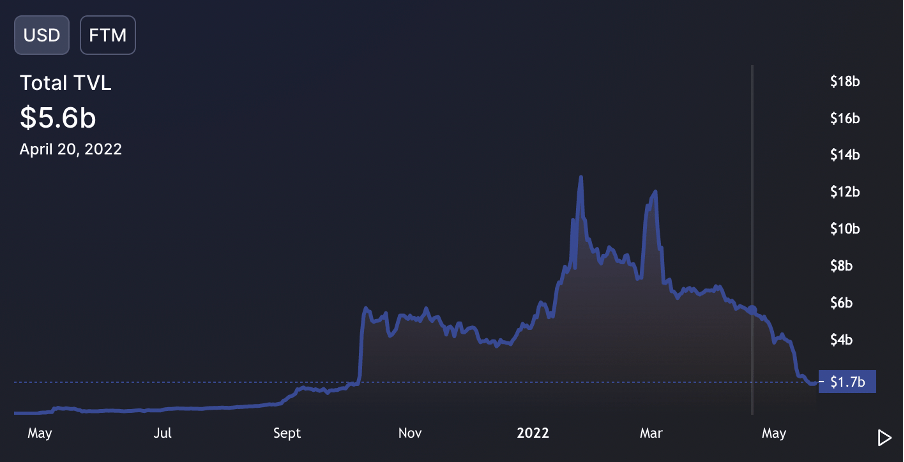
After last week’s brutal Total TVL drop from USD 205 billion on May 5th to USD 112 billion on May 12th, we can see that we have effectively remained at the USD 112 billion level with current Total TVL at USD 112.24 billion.
After a significant decrease in Total TVL, it would be expected that TVL does not recover so quickly and that it may stay at this lower range for some while, particularly if native token prices continue to fall, this would not help the cause.
Total TVL
Market By Numbers – Chains & Dominance
If we now turn our attention to the individual chains, we can see if certain chains have outperformed others, which gives us an indication as to where the flows of capital are flowing to. We can see that in the top 10 chains by TVL, there are reasonably mixed 7-day and 30-day returns. However, we can see that many have still gained TVL places (on the top 10 list) over the past month because of the breakdown of Terra (Luna), which is currently down to 0.14% of TVL dominance. This is a remarkable collapse considering just several weeks ago, it sat at a TVL dominance north of 14%.
TVL of All Chains – Dominance
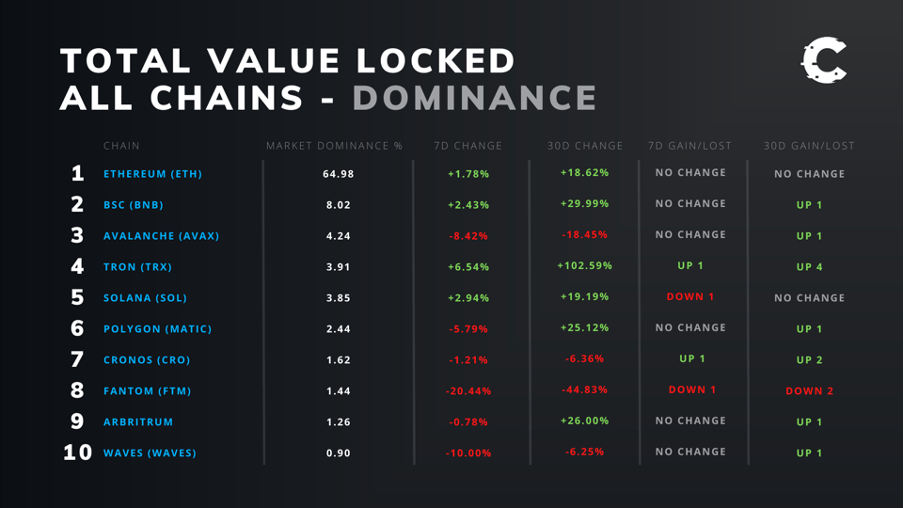
The biggest winner is clearly Tron. Many of the chains have gained just a single rank (in the top 10 chains by TVL) or are unchanged, yet Tron has gained more than 4 places in the past 30 days. The reason for this is that many chains have seen TVL losses whereas Tron’s TVL has stayed relatively flat, even increasing slightly. Tron’s TVL has increased from USD 4.14 billion to USD 4.43 billion in the past 30 days, where as all the other top 10 chains have seen TVL losses in the same time period.
Tron TVL By USD
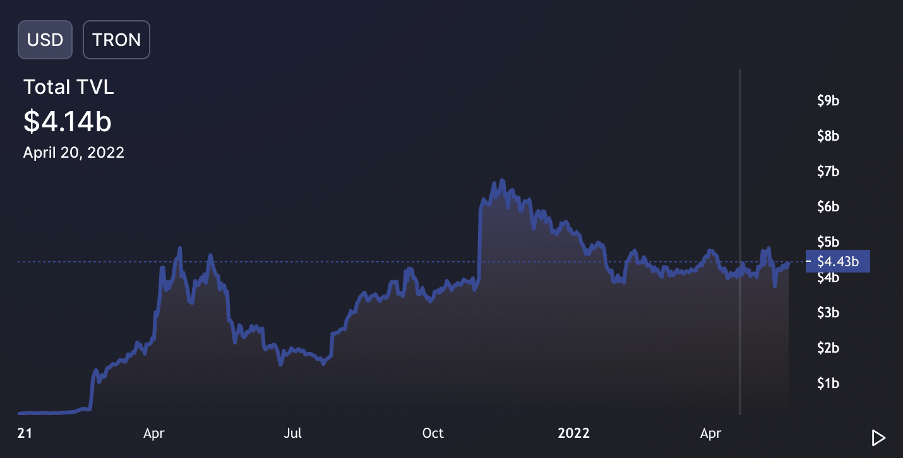
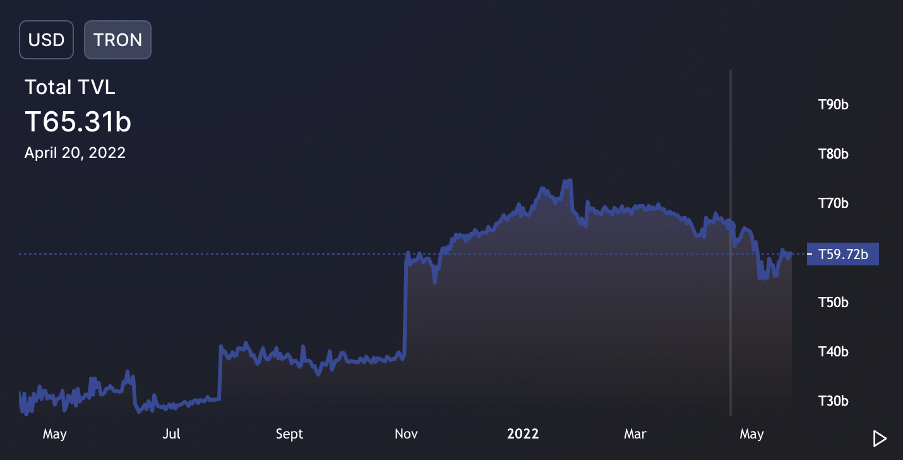
The reason for the increase in Tron’s TVL is that the amount of Tron staked has decreased by 8.5%, however, the price of Tron’s native token is up by more than 12% in the same time period, hence we see a positive TVL increase over the past 30 days.
Tron TVL By Tron Staked
If we now look into the top 10 chains, and not assess them from a TVL dominance point of view, we can see that over the past day and 7-days, there have been some positive TVL prints, however, it’s when we turn our attention to the TVL changes over the past 30 days, is where we see that 9 out of the top 10 chains by TVL have suffered large TVL losses. Of course, the one anomaly being Tron, as we explained above. The reason the majority of chains have suffered significant TVL losses is due to native token prices falling considerably over the past month, for instance Ether is down 32.59% in this time. When native token prices fall, some users look to de-stake their tokens and sell them to the market in panic that prices will fall further.
Top 10 Chains By TVL
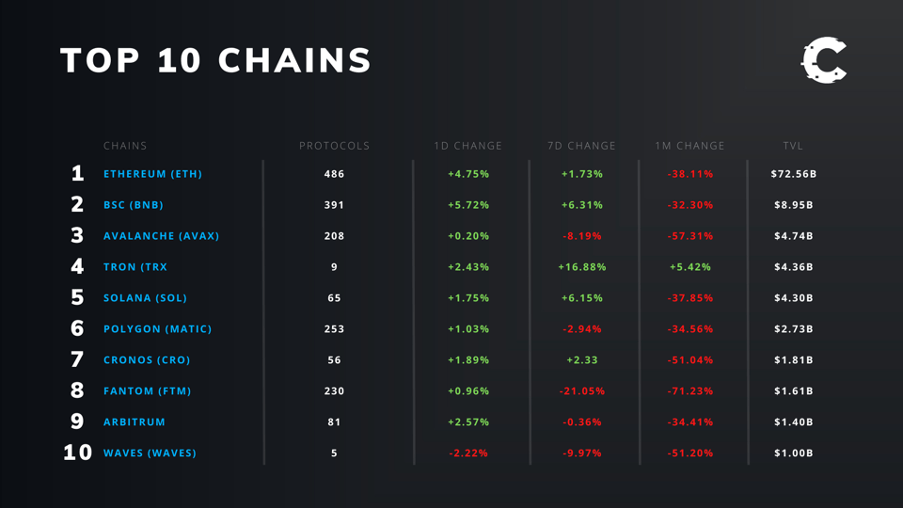
Looking at the above chart, perhaps the two stand-out TVL losers have been Avalanche and Fantom. Let’s investigate why they suffered more severe TVL losses than other chains.
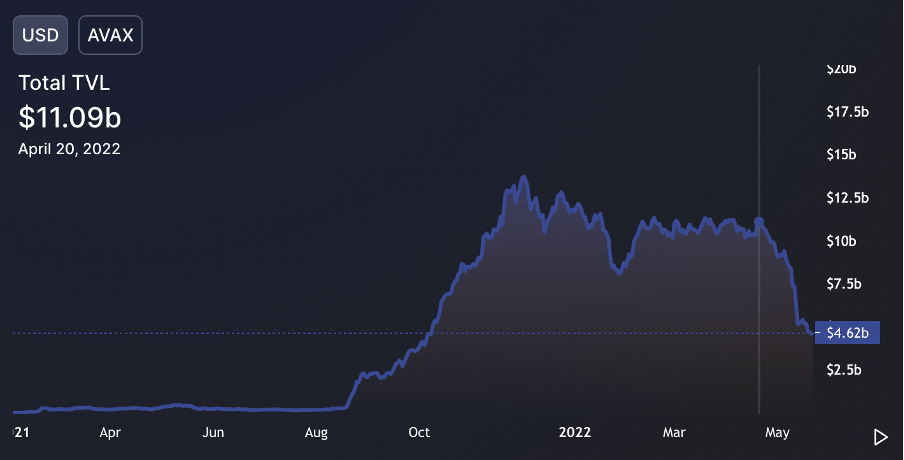
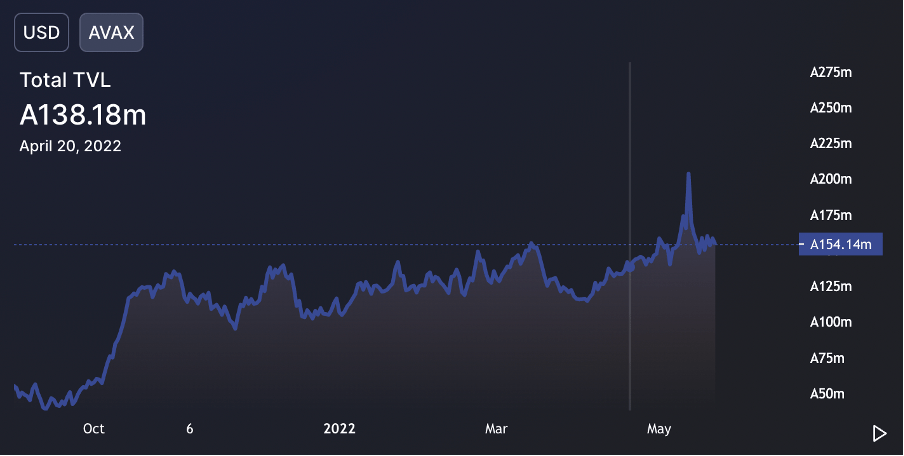
Let’s start by looking at Avalanche. We can see from the below charts that the amount of Avax staked has increased from 138 million Avax to 154 million Avax, a more than 10% increase. However, TVL by USD has fallen from USD 11.09 billion to USD 4.62 billion. This is mainly due to the Avax token price falling by 58.46% in the past 30 days.
Avax TVL By USD
Avax TVL By Avax Staked
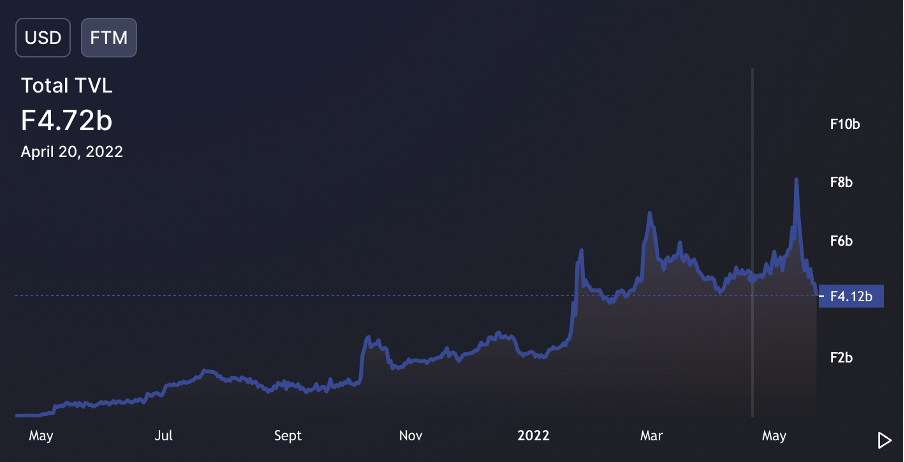
If we now turn our attention to Fantom, we can see that Fantom on the other hand saw less FTM being staked and the price of FTM also decrease. This led to significant TVL losses over the past 30 days. FTM staked has decreased from 4.72 billion FTM to 4.12 billion FTM, this is more than a 15% decrease in total FTM staked. Alongside this, FTM has decreased by 59.82% in the past 30 days.
Fantom TVL By FTM Staked
Fantom TVL By USD
Market By Numbers – Top 10 Protocols By TVL
If we now look at the top 10 protocols, we can see that all of the top 10 protocols lost TVL over the past 30 days. Over the past 7 days, most protocols have lost TVL but there are no real stand-out winners or losers, in terms of TVL.
Top 10 Protocols By TVL
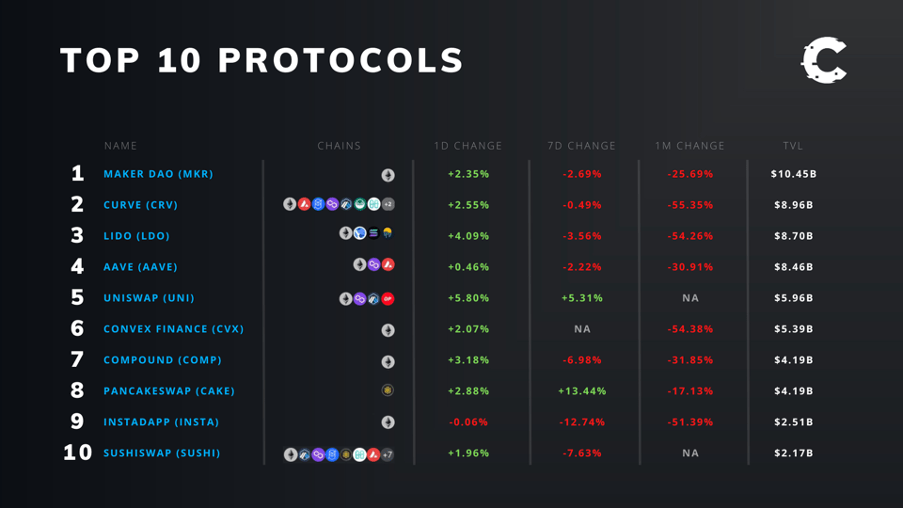
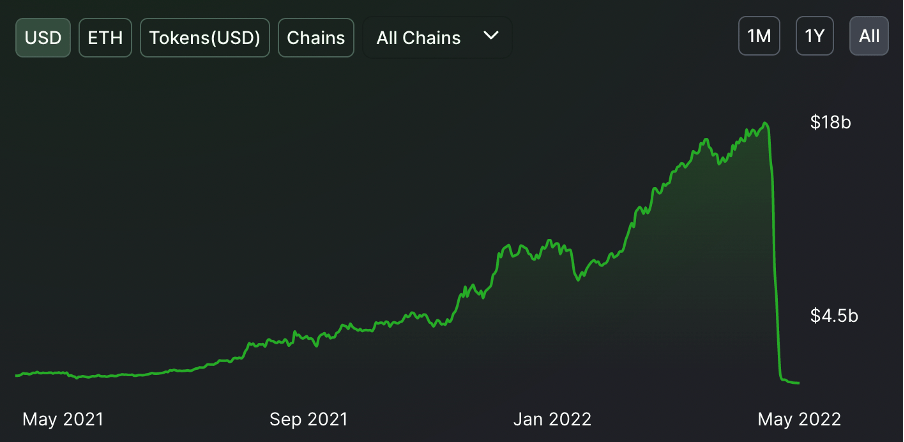
Perhaps the most notable protocol is Anchor. Just a few weeks ago, Anchor was in the top 3 protocols by TVL, but after the de-pegging of UST (the Luna backed stable coin), the Anchor protocol has lost 99.45% of its TVL over the past 30 days. This is due to the amount of tokens being staked in the protocol coming down drastically. For instance, just 2 weeks ago, there was over 6 million Ether staked in the protocol, there is now just 50,000 Ether staked.
Anchor TVL By USD
Summary
It can be said that the market sell-off in the past few weeks has significantly negatively affected TVL. As native token prices have gone lower, users have de-staked their tokens and sold them to the market in fear that token prices would continue to decrease. Alongside this, the collapse of the Luna backed stable coin, UST, also caused significant fear in the space and resulted in one of the top protocols by TVL (Anchor) seeing an over 99% decrease in its TVL as users de-staked their tokens. This more than likely had a negative effect on the DeFi market, likely spooking users and only adding to the level of fear in the space that we have seen over the past weeks.
Recommended from Cryptonary


