Save 23% ($351) & Get a Free 1-1 Call with our Team ⏰ : 0d 2h 59m 44s

TLDR:
- In the past 4-6 weeks, Total TVL has dropped from approximately USD 220 billion to now just USD 90 billion.
- Tron has gained the most TVL market dominance and remains the anomaly with 7 top 10 chains losing considerable dominance to their competitors.
- If we look at the top 10 chains by TVL in USD, we can see that every chain has lost TVL over a 1, 7 and 30-day period other than Tron which has only gained TVL over the past 30 days.
- If we look at the top 10 protocols by TVL, JustLend (Tron’s top protocol by TVL) is the only gainer over the past month.
Market By Numbers – Total Market TVL
In beginning this report, we will assess the total market TVL. This will allow us to see an overview of the flows of TVL over the past week; can we expect significant inflows or outflows of certain chains for instance.
Total TVL
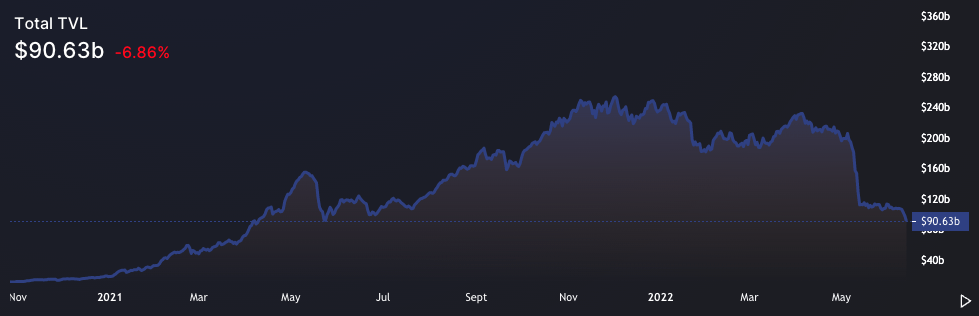
After the May 9th-13th market price drops in many assets, we seem to still be in a sentiment of hesitant recovery. Perhaps the most notable positive is that we have now seen several weeks since the significant TVL drop where TVL has remained relatively stable and hasn’t decreased a lot further. However, over the weekend, we have begun to turn towards the downside once more, but in a far less significant fashion than we saw in early to mid-May.
It should be noted that when TVL ‘crashed’ in early to mid-May, it found a support level at approximately USD 112 billion on May 14th, unfortunately TVL is currently at USD 90.63 billion, indicating that we have still seen a near 20% drawdown since the ‘crash’. Total TVL is currently at its lowest level since May 23rd 2021.
Market By Numbers – Chains & Dominance
We will now pivot to the individual chains to see how their TVL has performed and if they have gained market share over competitor chains.
TVL of All Chains – Dominance
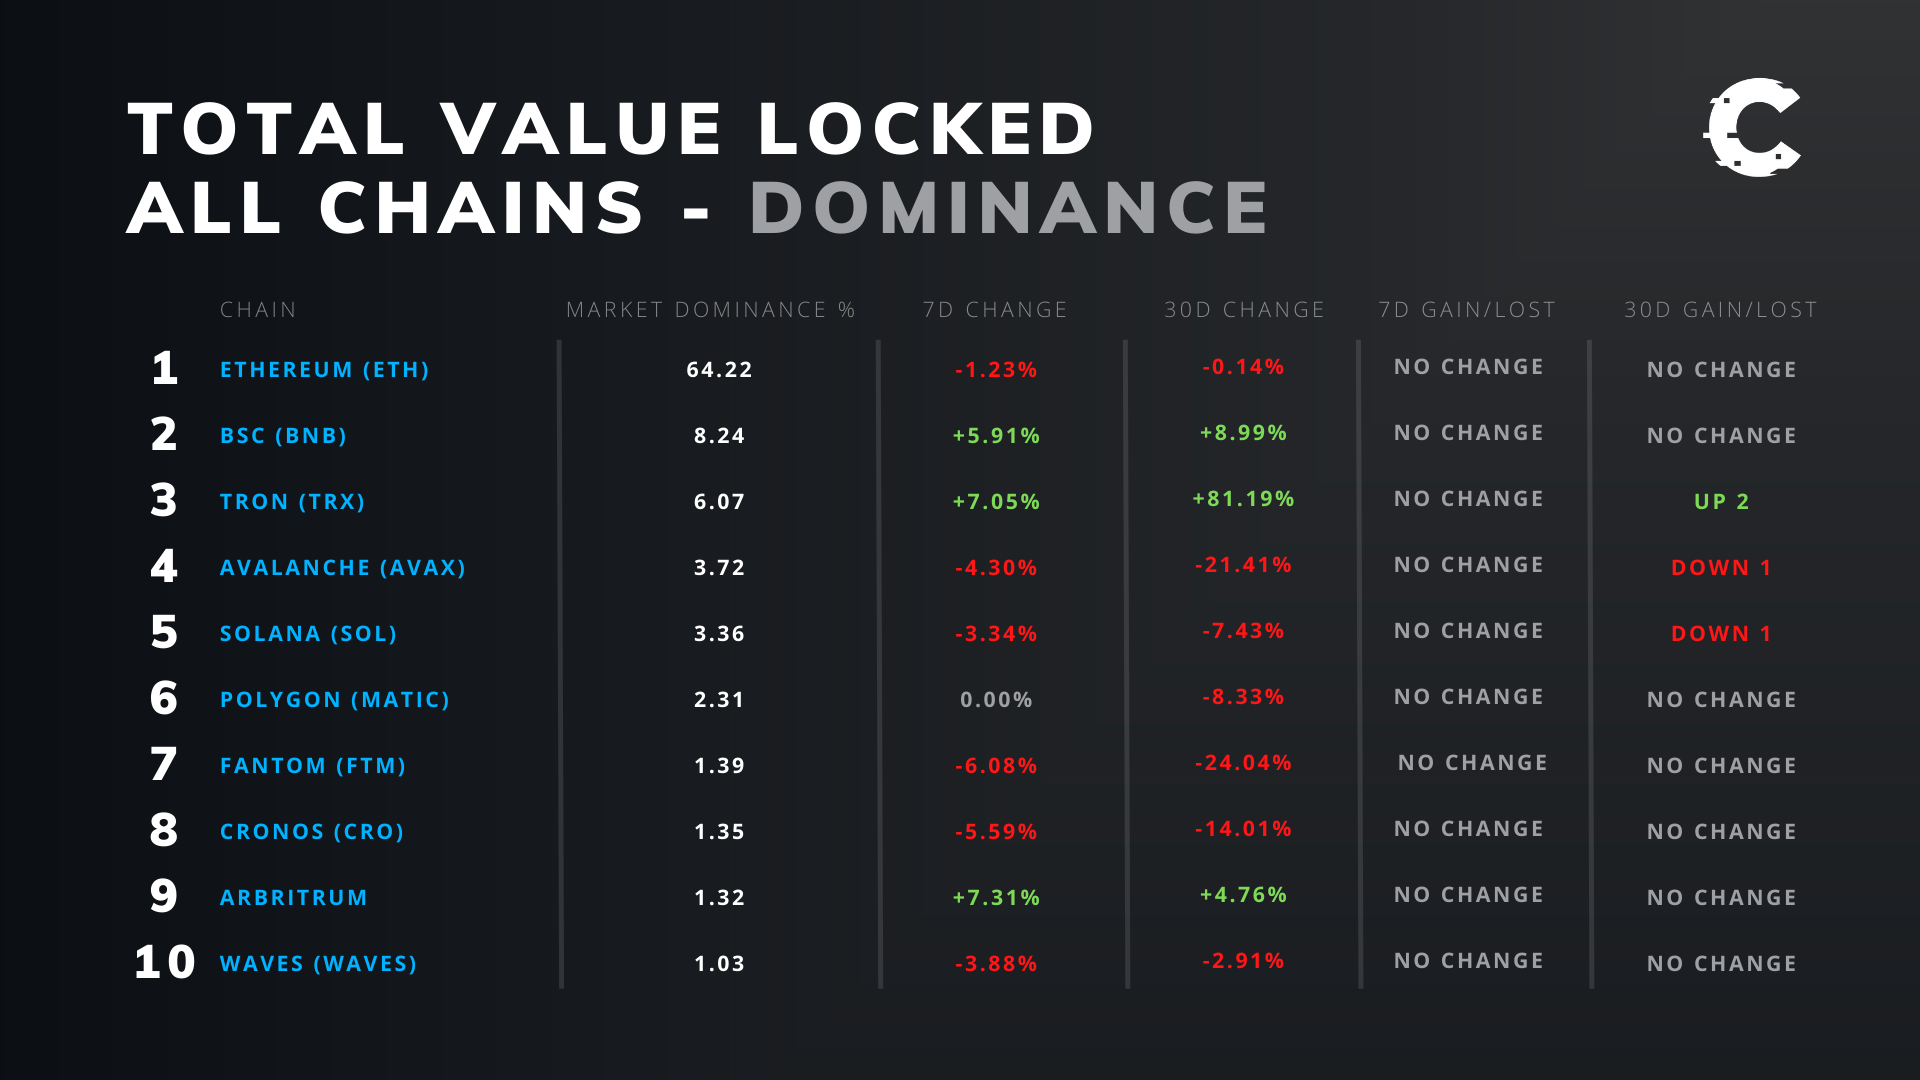
We can see from the above chart that there are mixed results. Perhaps the clearest winner is Tron, and Avalanche and Fantom are the biggest losers over the past month. Now, we are passed Luna impacting the above chart, we are seeing more stable results rather than seeing Ether increasing its market dominance by 20-30% over a 30-day period simply due to the chart updating against the Luna collape.
Note: On May 6th, 2022, Luna had a TVL market dominance of 14.86%, this now stands at 0. So, effectively, 14.86% of TVL market dominance has flown out of Luna and into other competitor chains.
Market By Numbers – Chains.
If we turn our attention to the chains and the figurative TVL (in USD terms), we can see that over the last 30 days, 9 out of the top 10 chains have seen significant TVL losses. The only of these that hasn’t seen losses is Tron.
Top 10 Chains By TVL
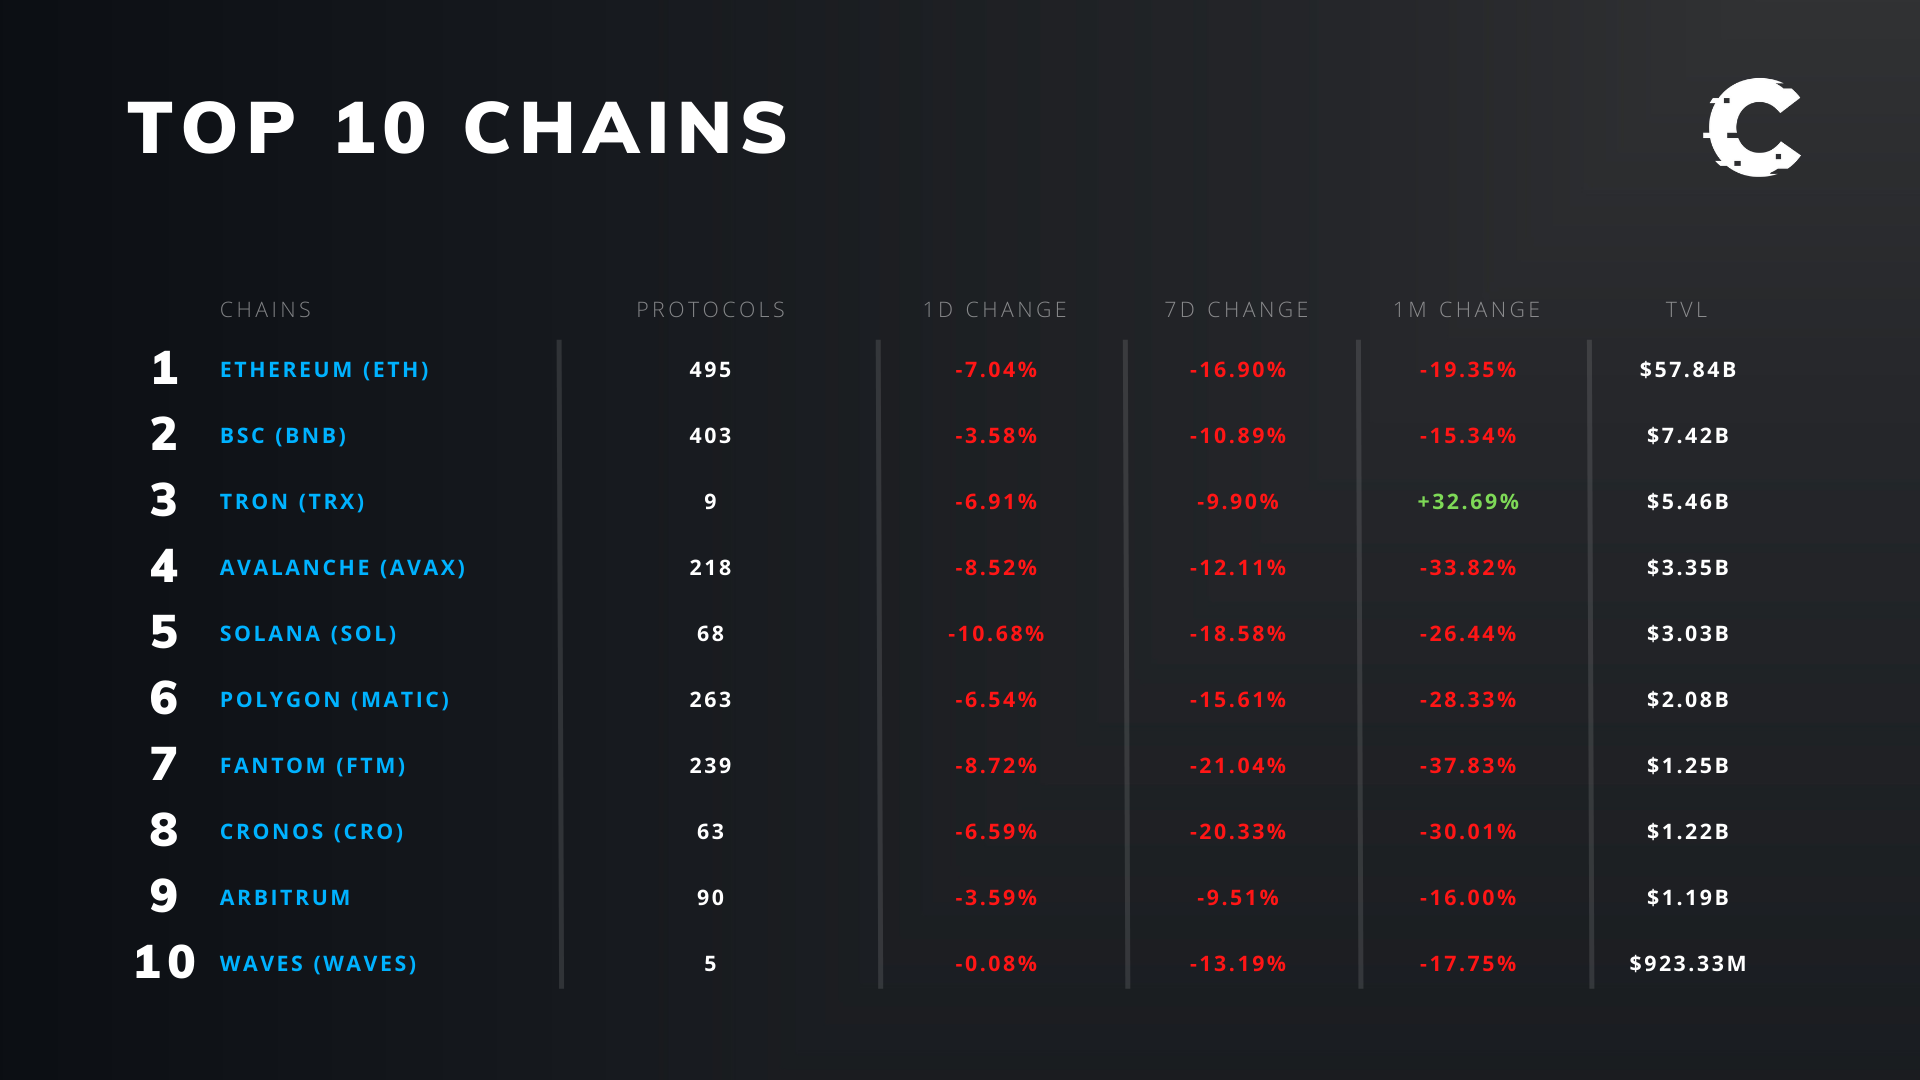
Firstly, we will assess Tron and why it has seen TVL gains over the past 30 days. Firstly, it should be noted that many chains and protocols native tokens are down considerably over the last 30 days, Tron is only down 6.83%. To put this in perspective, Ether is down 34.49% over the same timeframe. So, effectively Tron has held up relatively well especially in comparison to the wider market. This encourages investors to move their funds to Tron, which as a result helps to keep price up even more.
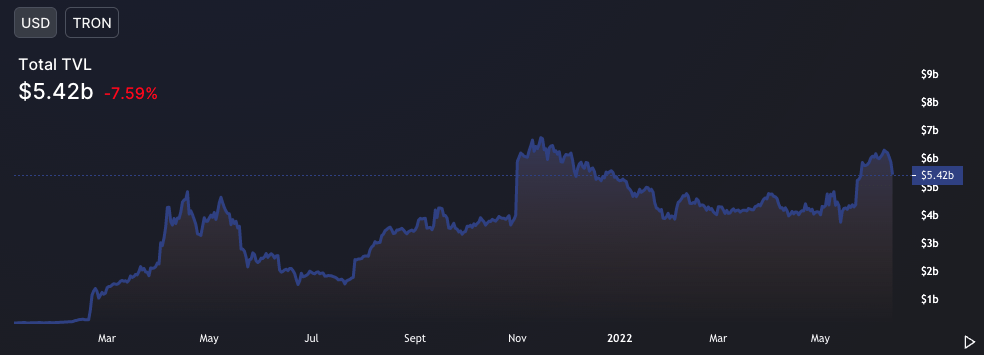
We can see from the below list, that Tron’s top protocol (JustLend) by TVL, has increased by 55.73% in the last month. Now, there are just 8 protocols on Tron, with the top protocol (JustLend) making up nearly 50% of the total TVL on Tron. So, Tron’s TVL performance is heavily influenced by JustLend and vice versa.
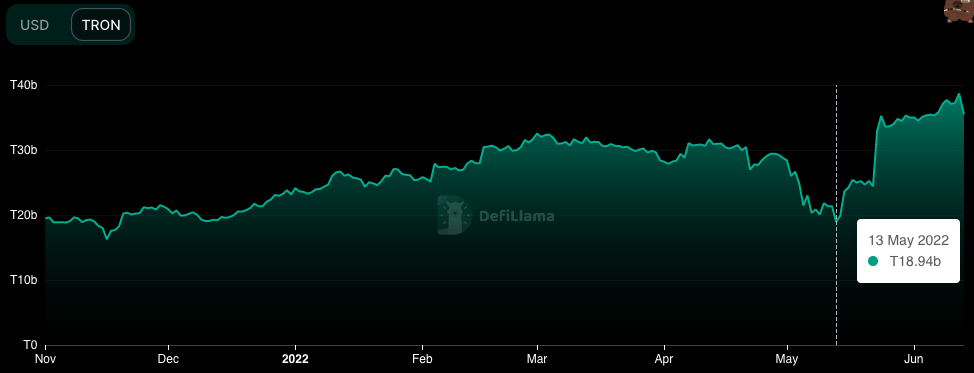
Tron’s TVL by USD
Tron’s TVL by Tron Staked
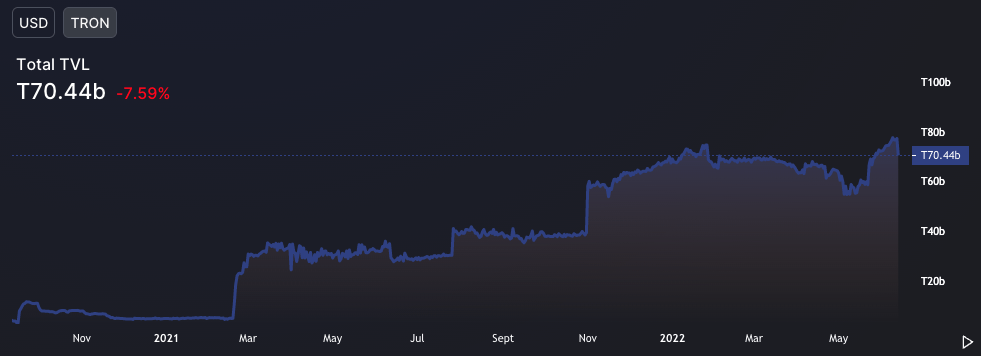
We can see in the above two graphs, that the number of Tron staked has increased over the past month from, 55.26 billion to 70.40 billion. This is just under a 30% increase in the number of Tron staked and the reason why Tron has performed so well in the last month. As mentioned, Tron’s native token has held up much better price wise than the rest of the market, which may be the reason why investors have chosen to move funds from other chains and protocols into Tron.
Market By Numbers – Protocols
We will now focus on the individual protocols and their performance and analyse a few of them.
Top 10 Protocols By TVL
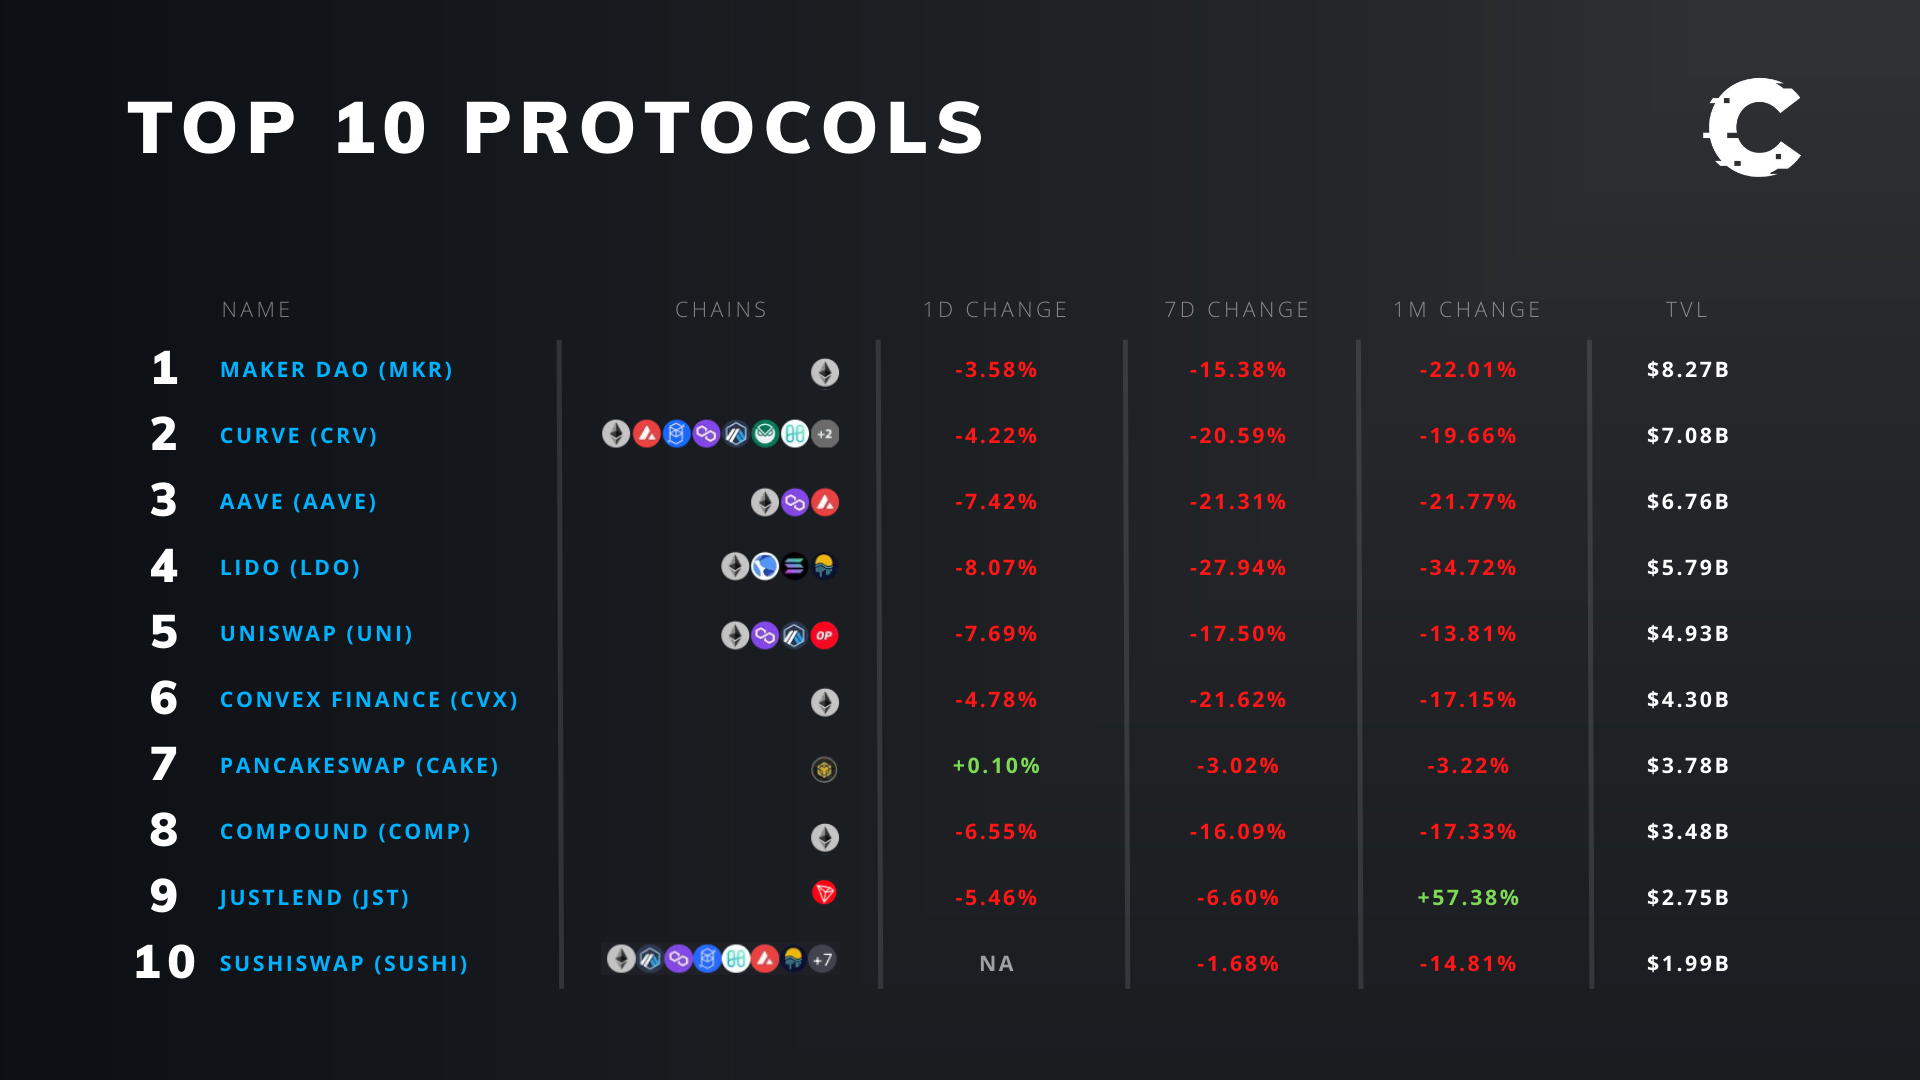
We can see in the above chart that many protocols have seen significant TVL losses in the past day, week and month. JustLend has performed the best over a 30-day period and Lido has performed the worst.
We know for JustLend that the Tron native token has held up well in comparison to the market, so it is likely that investors flocked to the top protocol on Tron in order to stake. When a native token price is holding up well, it’s top protocols usually gets better inflows than the other protocols on that chain simply due to investors going with what they consider the safest option (the protocol that has the highest TVL on that specific chain). In the past month, the amount of Tron staked on just lend has gone from 18 billion to 35 billion Tron.
JustLend TVL by Tron Staked
If we now look at the top 10 protocol with the biggest TVL losses over the past month, Lido, we can see that at its peak, Luna made up a significant portion of its TVL, that is now of course not the case and one of the reasons why it has lost so much TVL in total.
Lido TVL by USD – Split Into Individual Contributing Chains
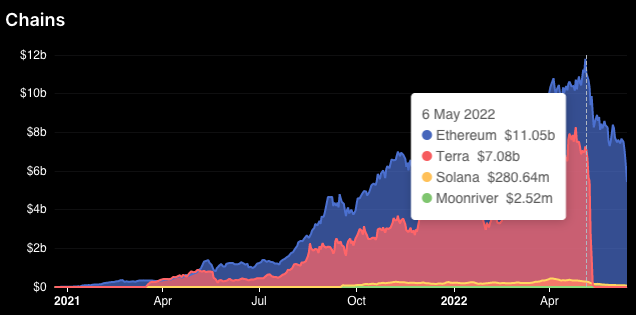
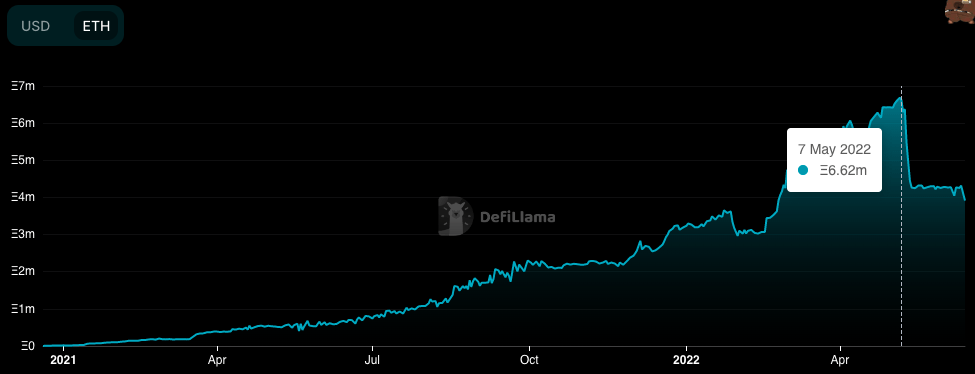
A second reason as to why Lido has lost so much TVL, is that the amount of Ether staked on the protocol has decreased in the past month from 6.62m to 3.92m.
Lido TVL by Ether Staked
Alongside this, the prices of both Ether and Lido have fallen by 34.49% and 54.79% over this period. Now if you compare this to Tron and JustLend, it becomes clear as to why investors continue to move funds into Tron and JustLend.
Summary
Over the past months, we have seen TVL on many chains and protocols top out and come down considerably from their highs. With decreasing native token prices and the collapse of Luna and UST, it is no wonder as to why TVL’s are decreasing like they are. Many investors will have become scared out due to native tokens falling, for then Luna to collapse, this has really seen many investors flushed out of the market. The result of the Luna collapse in early to mid-May 2022 is clear to see from the Total TVL chart (the biggest move in the charts history in a few days’ timeframe).
Total TVL
Recommended from Cryptonary


