Save 23% ($351) & Get a Free 1-1 Call with our Team ⏰ : 0d 2h 59m 43s
DOGE, TARS, RUNE and PENDLE: ready for the next big move?
DOGE, TARS, RUNE and PENDLE are showing interesting price movements, with DOGE holding key support levels, and TARS breaking significant resistance. RUNE's recent price action has been promising. PENDLE, while in a bearish downtrend, has shown strong bullish bounces and is currently testing a critical resistance level. All three assets are positioned for potential breakouts if they maintain their current momentum.

Here’s an in-depth look at the price action and key levels to watch. Let's dive in!
Disclaimer: This is not financial or investment advice. You are responsible for any capital-related decisions you make, and only you are accountable for the results.
Overview
DOGE has proven its staying power by becoming a favourite for many investors and traders. As of today, DOGE is showing clear signs of bullish momentum. After a period of consolidation and a brief retracement, it's now on the move, trading at approximately $0.127 with an 8% gain just today.DOGE's higher timeframe price action, specifically on the weekly chart, indicates that it has taken key support from the 200 EMA. Furthermore, DOGE's daily chart shows that it has been respecting its demand zones and breaking out of critical downtrend trendlines. This combination of bullish developments places DOGE in a favourable position as we analyse its potential move higher, especially given that Bitcoin (BTC) has been breaking through its own key resistances.
With this backdrop, let's dive into DOGE's weekly and daily charts and analyse its performance against Bitcoin (DOGE/BTC pair).
Weekly timeframe analysis (DOGE/USD)
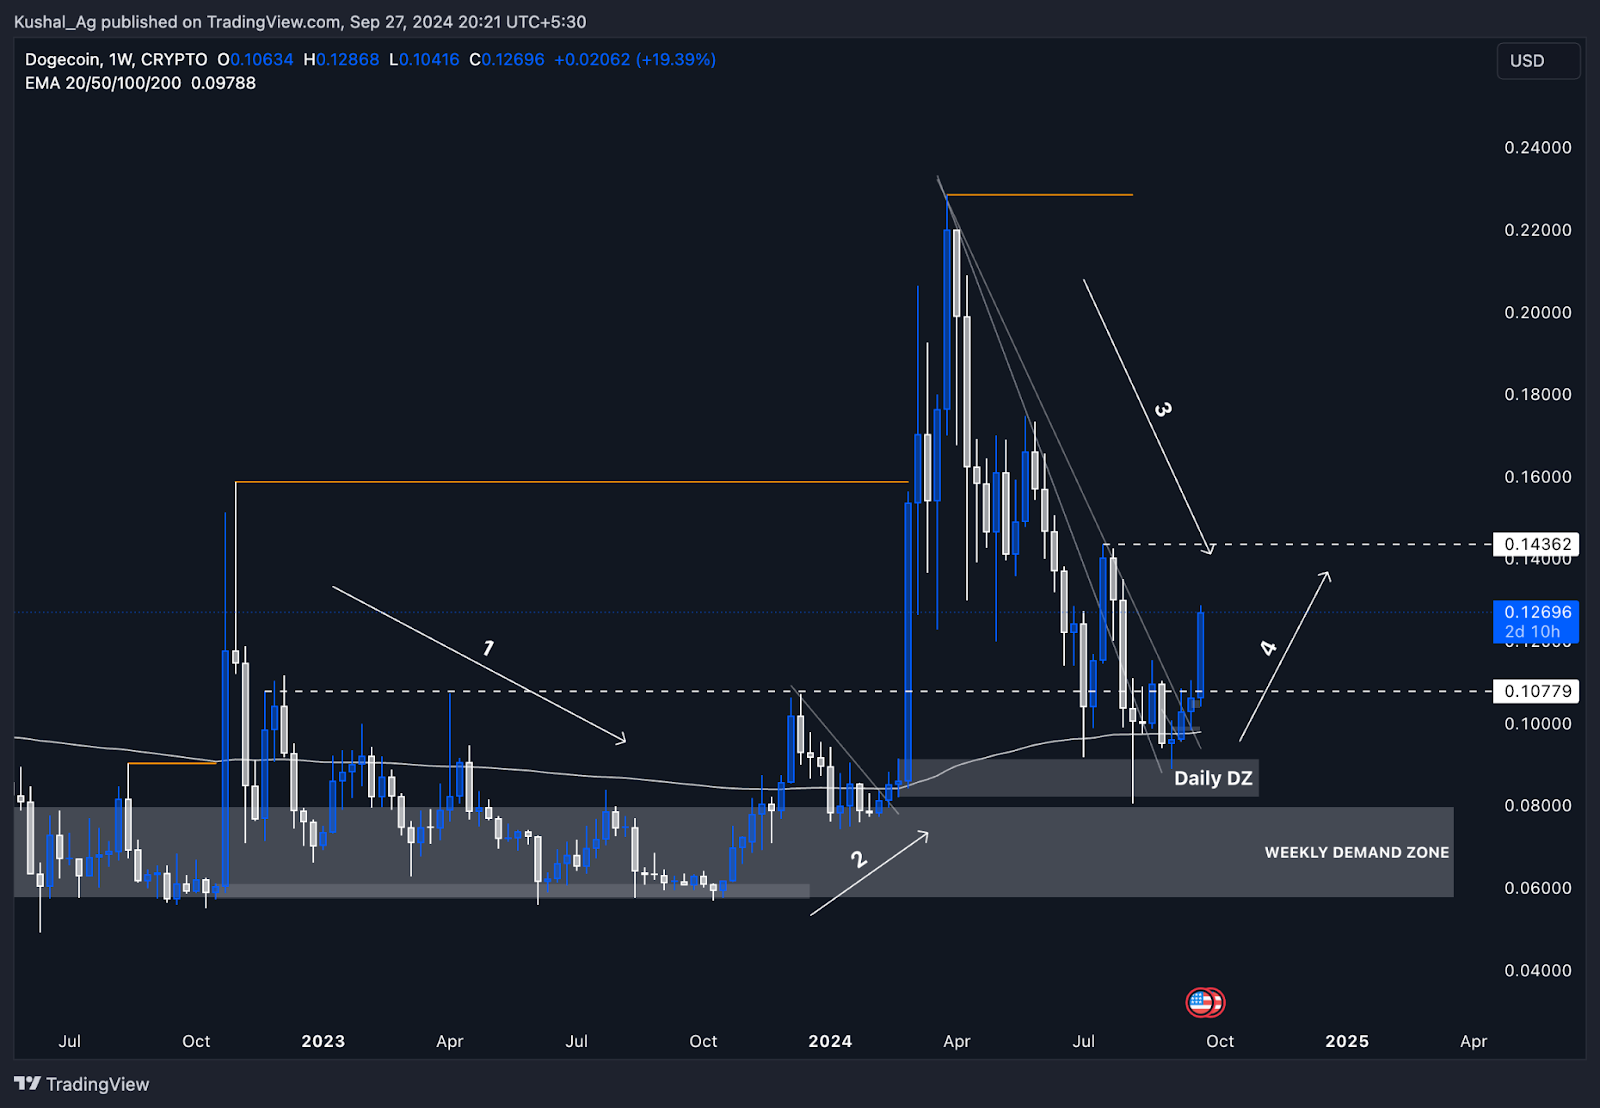
DOGE has held up well on the weekly timeframe, using the 200 EMA as a crucial support level. After multiple tests, the price dipped below momentarily, leading to long liquidations, but this ultimately proved to be a liquidity grab before a reset and bounce back to higher levels.- 200 EMA support: DOGE's ability to consistently hold the 200 EMA suggests that this is a strong level of support, signalling the long-term health of the asset. Buyers have continued to step in at this level, pushing prices back up.
- Bullish trendline break: DOGE has been consolidating for several weeks and has now broken out of a downtrend trendline, marked by the orange line on the chart. This breakout indicates that momentum is beginning to shift in DOGE's favour.
- Key resistance levels: The first major resistance is at $0.1436, and breaking this would potentially trigger a much stronger rally. The next resistance is at $0.23, followed by the ATH zone. If these levels are flipped into support, DOGE could see a more significant move upward in the coming weeks and months.
Daily timeframe analysis (DOGE/USD)
On the daily timeframe, DOGE continues to show a strong bullish trend. The coin has respected the $0.10078 level as a significant support zone, which led to a major breakout after several days of consolidation. DOGE also took support from the daily demand zone, marked by the grey box on the chart, which is key to its recent price action.- Breakout from downtrend: DOGE has broken out of a downtrend trendline, resulting in a strong rally of 25%, moving from $0.10078 to $0.125.
- Potential accumulation zone: The $0.10078 level, now flipped into support, offers a potential accumulation zone for investors looking for solid entries. Layering orders in this region provides a good risk-to-reward ratio, given DOGE's bullish momentum. Additionally, the $0.1436 resistance could act as a new support if flipped, offering another area for accumulation.
- Next resistance levels: As DOGE pushes higher, the next key resistance zones to watch are $0.1436, followed by $0.23. Once $0.1436 is flipped, DOGE could move swiftly toward higher levels, including the ATH target.

DOGE/BTC pair analysis
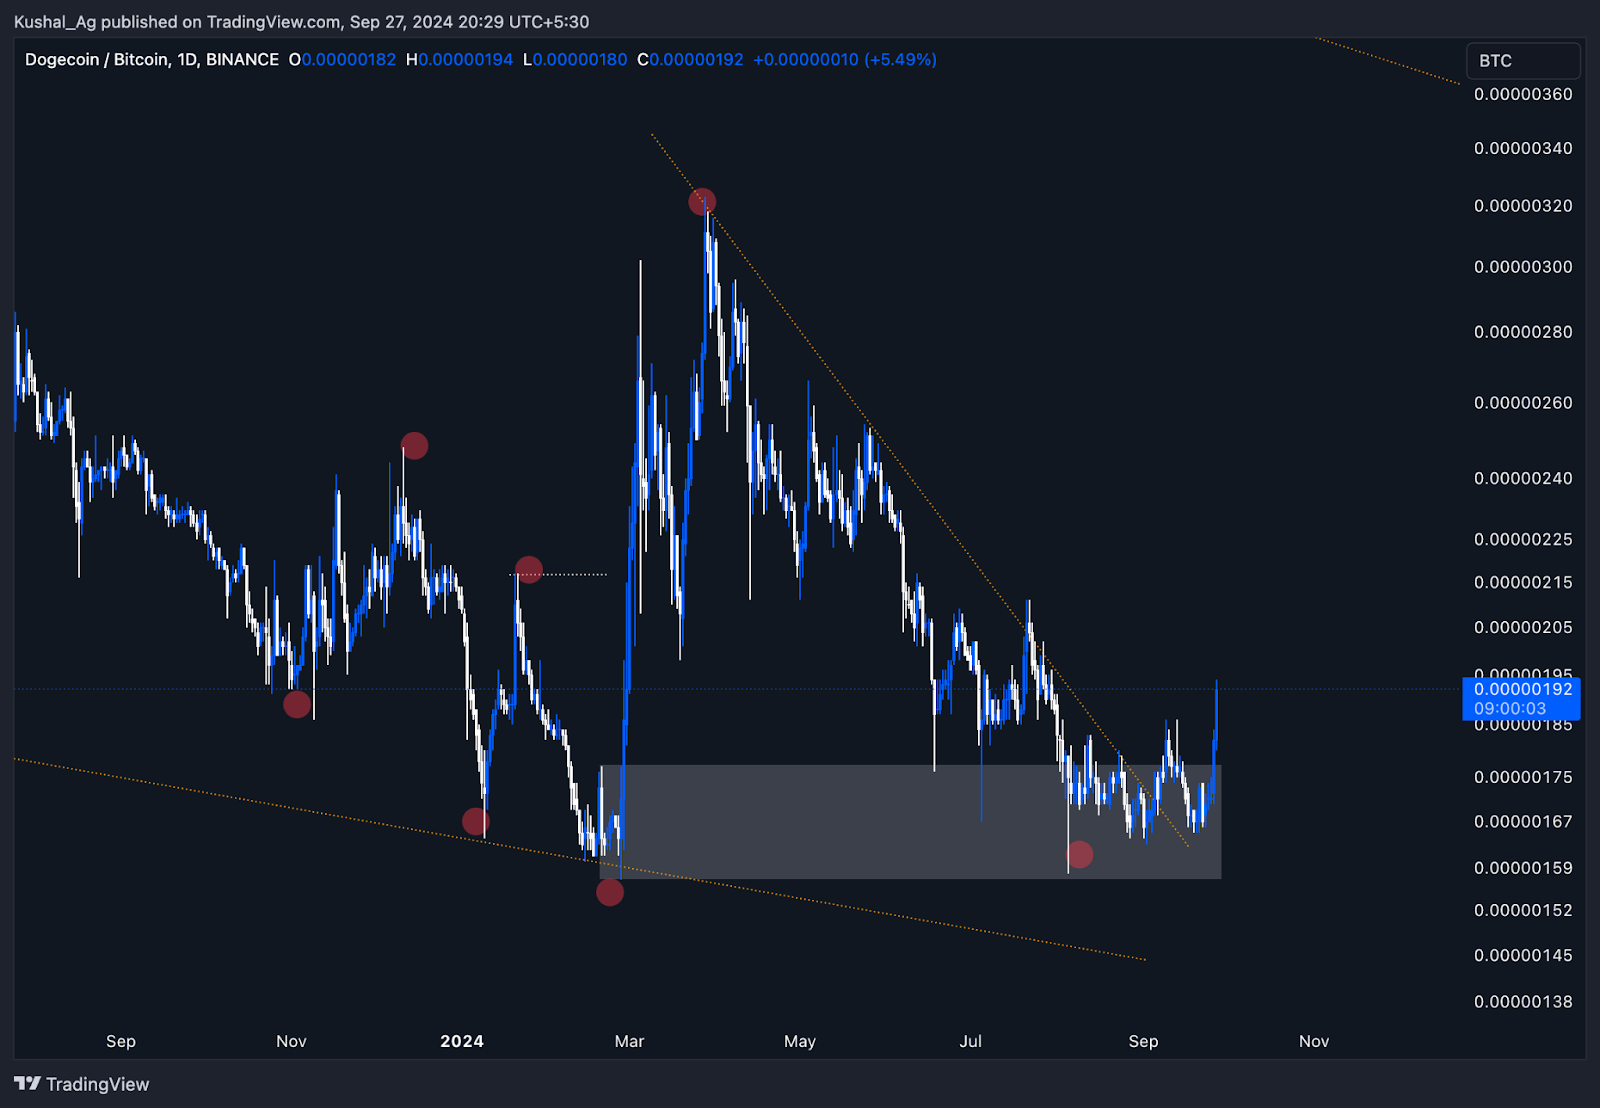
The DOGE/BTC pair is crucial in analyzing DOGE's relative strength against Bitcoin (BTC). After a long downtrend, DOGE/BTC has recently broken out of a daily downtrend trendline. This breakout signals that DOGE is poised to outperform BTC, especially if Bitcoin continues its bullish run.- Higher highs and higher lows: The structure on the DOGE/BTC pair shows that DOGE has been forming consistent higher highs and higher lows, marked by the red dots on the chart. This indicates strength in DOGE's price action relative to BTC.
- Demand zone bounce: DOGE/BTC found strong support in a daily demand zone, represented by the grey box on the chart. This zone acted as a springboard for the price to break out of its downtrend and move higher.
- Potential outperformance: With both DOGE/USD and DOGE/BTC breaking key resistances, DOGE seems poised for outperformance against BTC. This is especially relevant as Bitcoin continues breaking key levels, further fueling DOGE's momentum.
Cryptonary's take
DOGE appears to be gearing up for a notable bullish move, supported by strong technical signals on both the weekly and daily timeframes. The breakout from key downtrend lines, combined with the strength shown in the DOGE/BTC pair, underscores the potential for significant outperformance in the near future. If DOGE can flip the critical $0.1436 resistance into support, it could rally toward $0.23 and beyond, aligning with the broader market's bullish momentum.That said, meme coins like DOGE come with inherent volatility and heightened risk. While technical indicators are signaling a potential breakout, it's essential to be cautious as DOGE remains susceptible to sharp corrections. Investors should closely monitor Bitcoin's performance, as its movement will heavily influence DOGE's trajectory. For those looking to accumulate, the current setup presents opportunities, but strategic risk management remains crucial in this high-risk asset class.
TARS
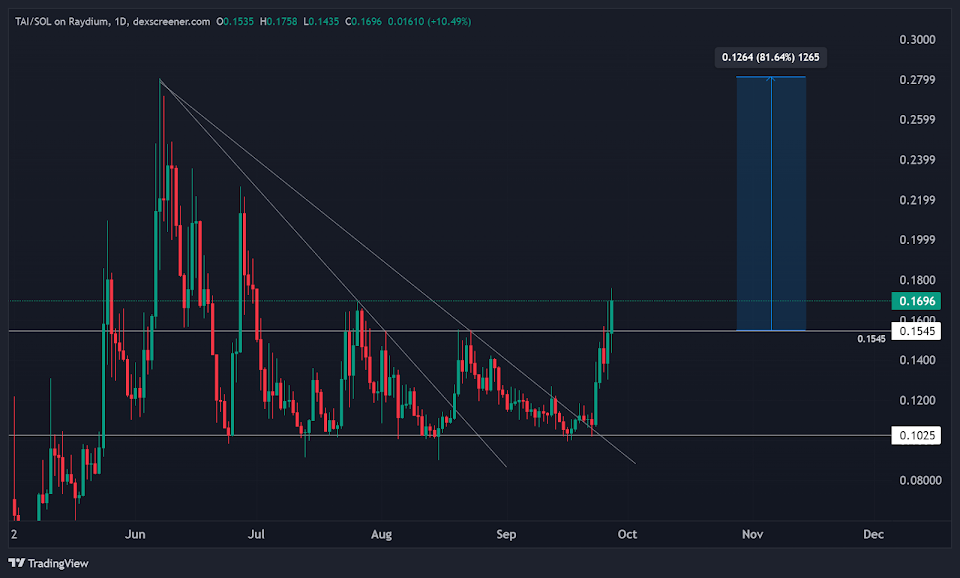
TARS is a relatively young asset, just 148 days old, but we’ve already seen a clear support level of around $0.1. This has acted as a floor during a consolidation period where the asset was range-bound.The key level to watch now is $0.1545, which has been respected multiple times. After testing and holding this level, we’ve seen a solid breakout. TARS is still 82% down from its all-time highs, meaning there’s plenty of room for movement.
Structurally, TARS has broken out of two diagonal resistance levels:
- The first is from the June high to the July swing high.
- The second is from the June high to the August swing high.
Playbook
- Bid the Breakout: If you have a conviction in TARS, bidding the breakout could be a strong move. Momentum is here, and with the diagonal resistance cleared, sellers are likely exhausted at these levels.
- Wait for a Retracement: For a more conservative approach, you can wait for a potential retracement to the $0.1545 level. If this flips from resistance to support and holds, it can act as a new floor for future price action.
Note: This is a technical analysis and not an investment recommendation. We are not personally invested in TARS, and this is purely for educational purposes to help members understand potential strategies.
Cryptonary’s take
TARS is showing clear bullish signals after breaking two key resistance levels. While it’s still far from its all-time high, this breakout opens the door for further upside. Whether you’re a breakout trader or waiting for a pullback, TARS offers opportunity, but patience will be key. If the $0.1545 level holds, we could see the next leg up, but as always, managing risk is essential. Keep a close eye on how the price reacts in the coming days.Rune
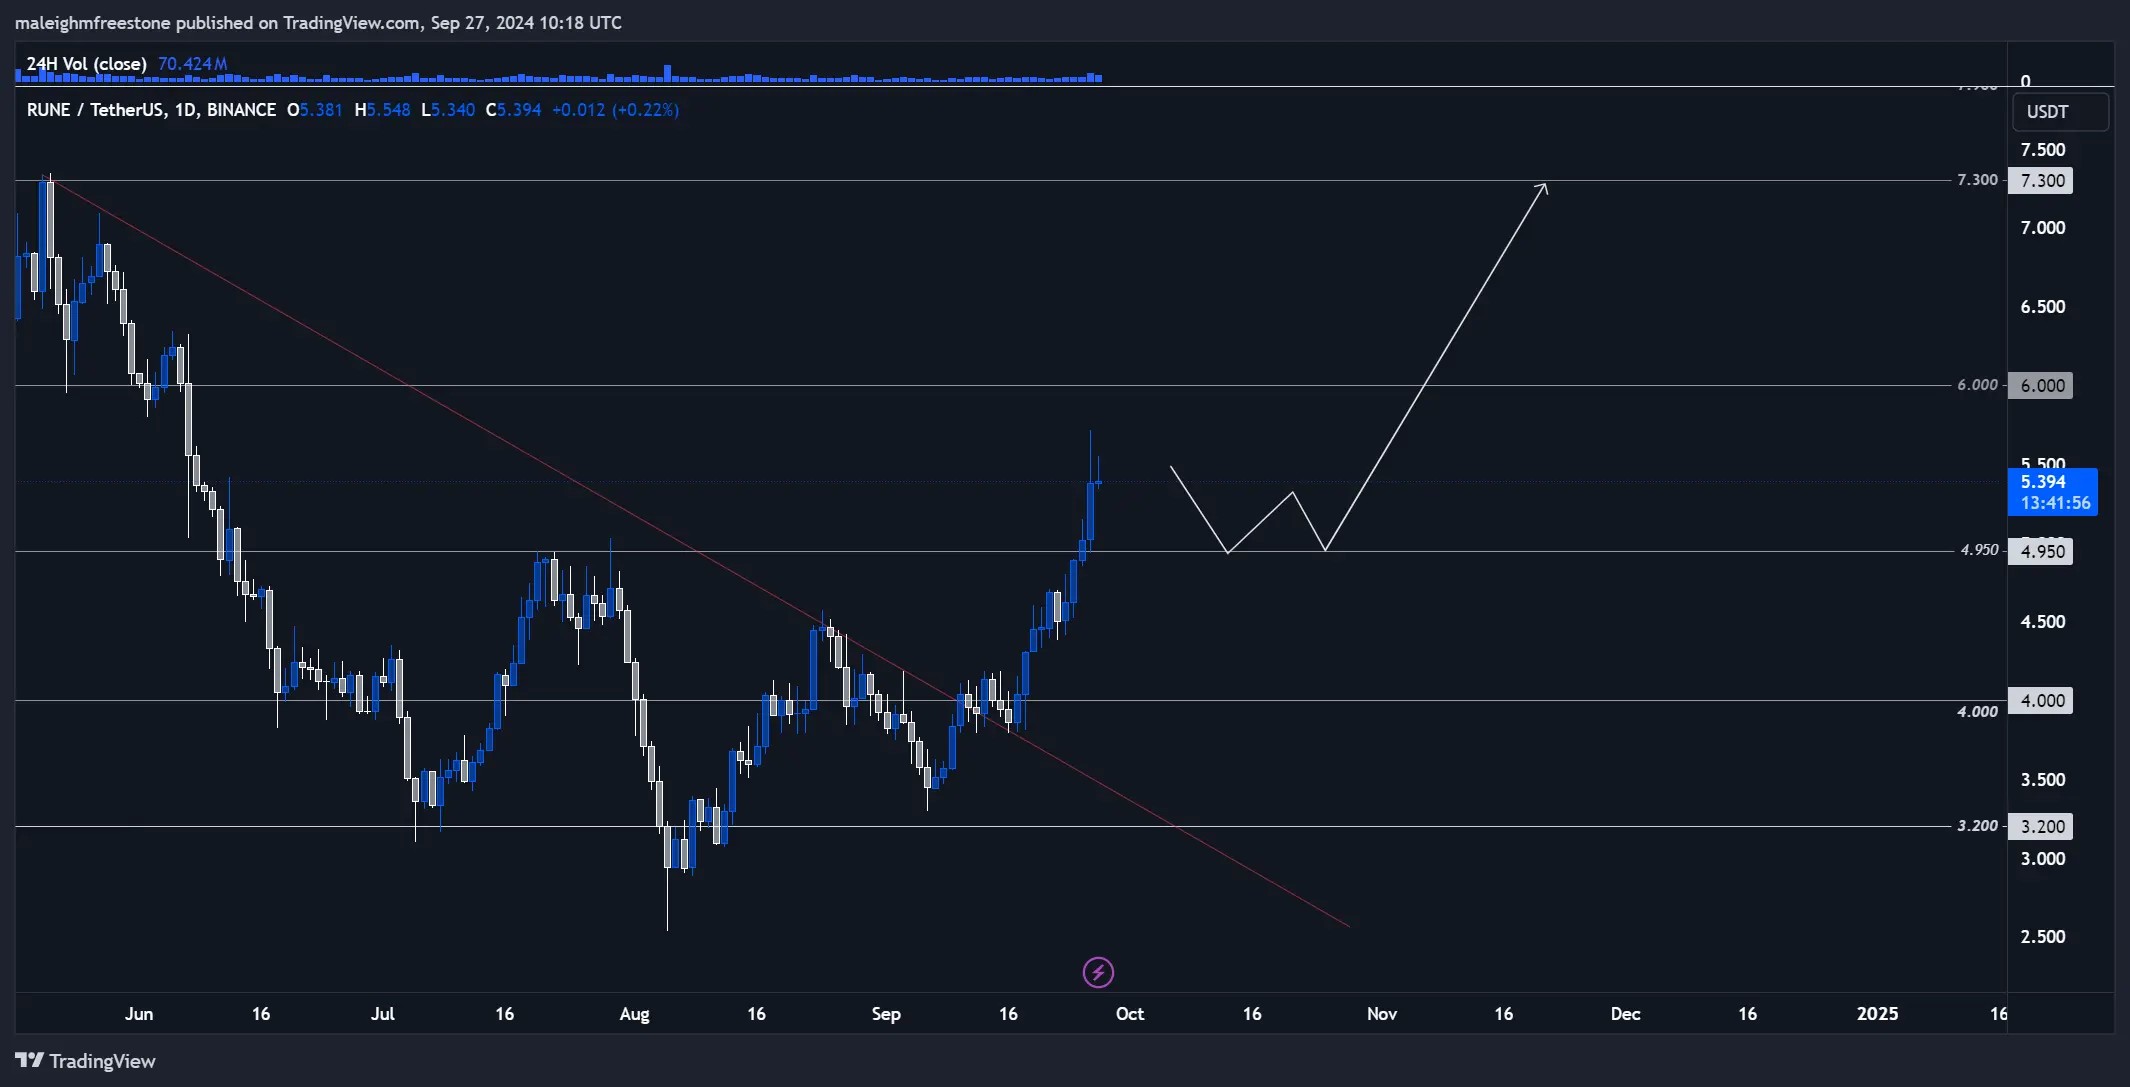
On the weekly timeframe, RUNE has seen a solid accumulation strategy between the $4 and $3.2 price points, which has now played out with around a 50% movement from the middle of that range. This price action has recently positioned RUNE as one of the top movers, aligning with historical price activity. March 2023: A significant 100% rally from around the $5 price point. April 2023: Following the March rally, there was a sharp sell-off, but we also saw a 50% bounce in April from similar price regions.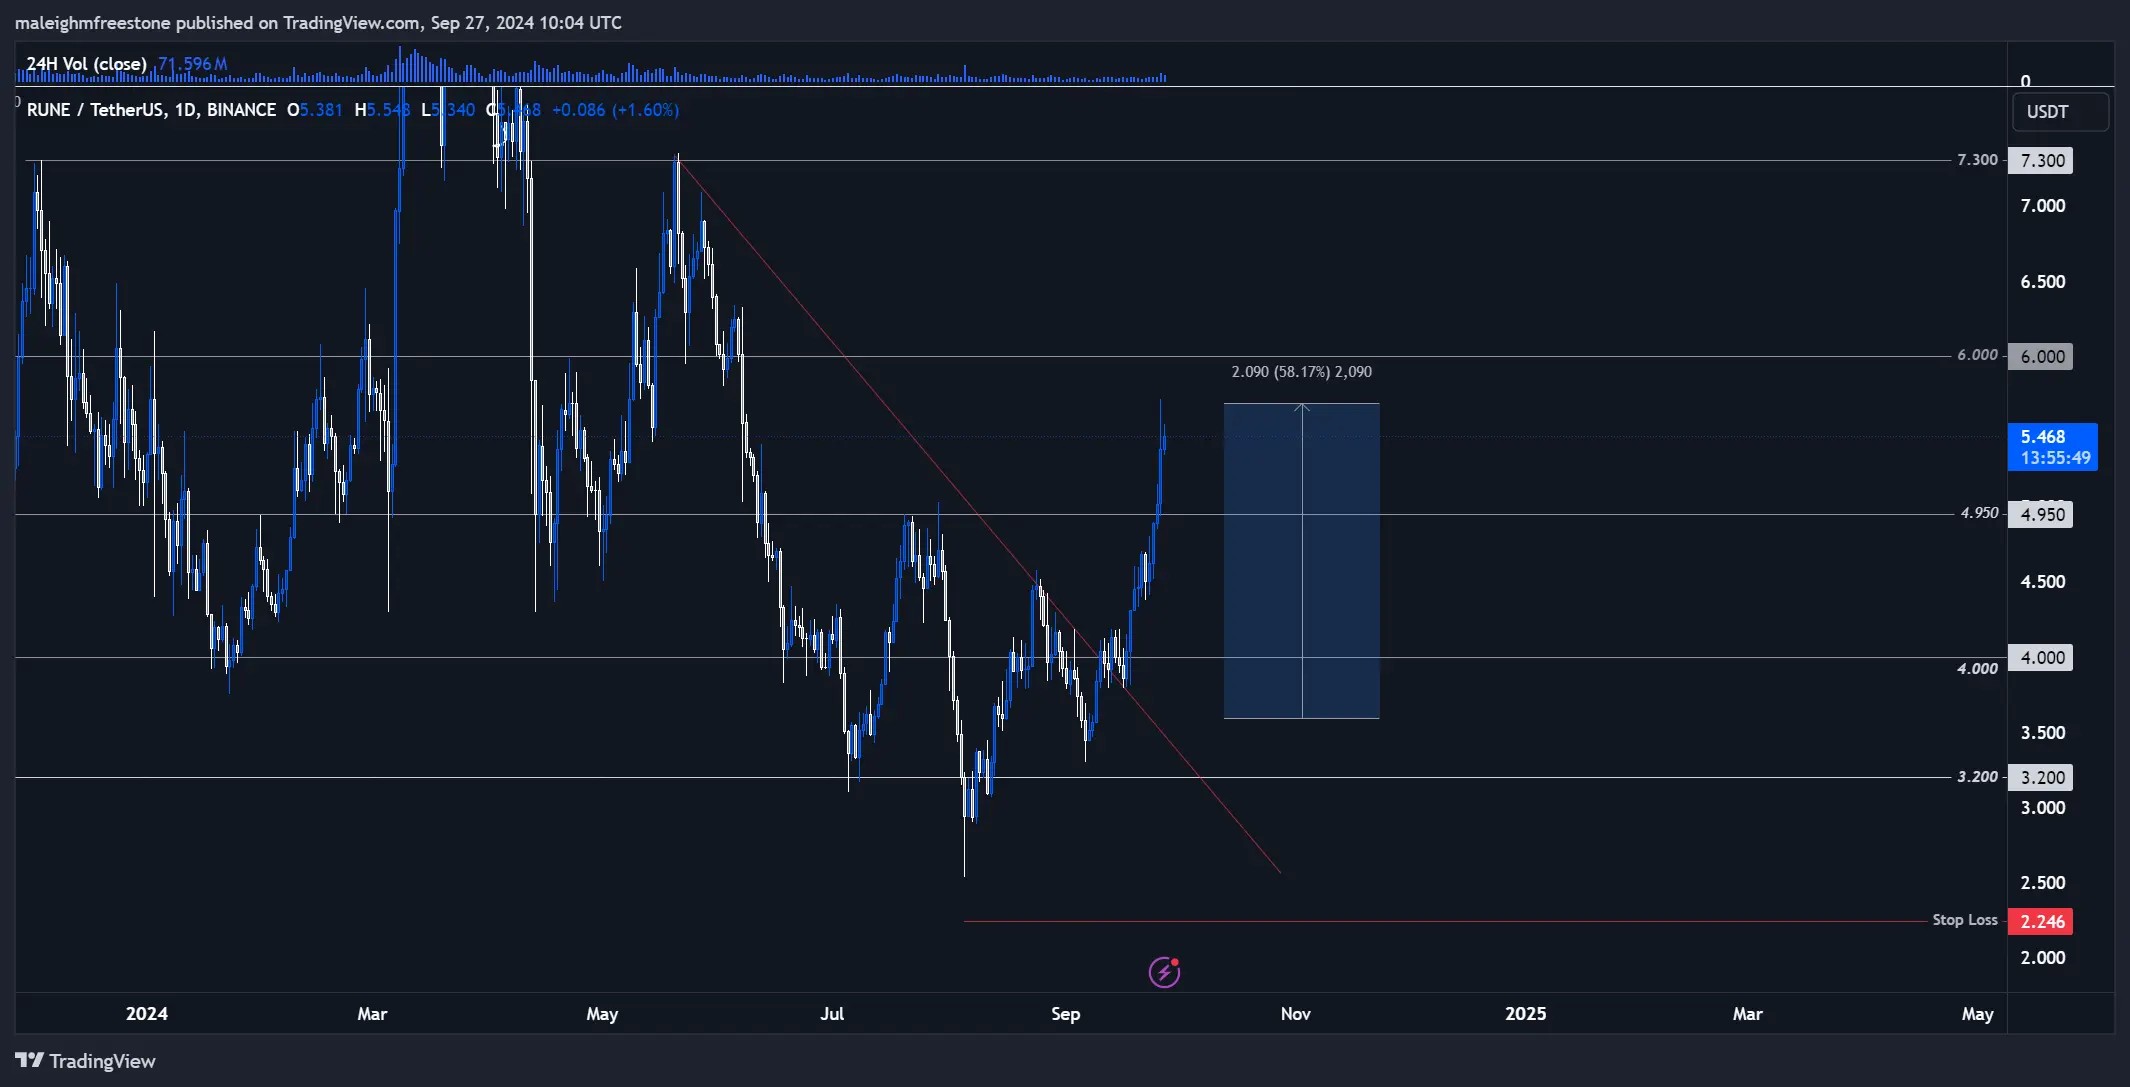
Key points to note
- Buying pressure between $4 and $5 is confirmed by the wicks observed in March and May, where price dipped intraday but closed above, showing strong buyer interest.
- The $5 level remains crucial, with historical support that could play a key role in determining the next leg of price action.

Current playbook
Hypothesis: RUNE is holding firm within its established accumulation zone, and with key support and buying pressure around $4 to $5, there's potential for a significant upside if we reclaim and consolidate above $5. We're watching for any indication of a 130% move from this region, based on historical market reactions.Key levels
- $4 to $5 Range: Continues to be the key accumulation zone. A breakout above $5 is essential for confirming a bullish shift.
- $5.7: Short liquidation levels lie just above this point, which could trigger a price squeeze if crossed.

Risk management
- Spot accumulation: Continue building within the $4 to $5 zone. The historical rallies from this region reinforce the long-term potential here, and spot accumulation offers protection from leveraged risk during price swings.
- Leverage strategy: If trading on leverage, positions should remain light (2x or 3x). Wait for confirmation of demand being shown at $5 before considering leverage entries. Stop losses should be set conservatively, preferably below $4, to avoid getting caught in a retracement to the $3.2 zone but we will update on this if we believe there may be a high quality play here.
Cryptonary's take
RUNE's recent price action has been promising, with strong support already breaking out above the key $5 level. This is a critical shift, as $5 has historically been a springboard for impressive rallies, and now the focus is on how demand responds at this price.With the breakout confirmed, we're looking to see sustained buying pressure and demand at or above $5 to validate further bullish momentum. If demand holds, there's a strong possibility of a significant push upward, potentially up to 130% from current levels based on past market cycles.
However, it remains essential to manage risk carefully, especially when considering leverage. Stay patient and monitor how the price behaves in the coming days, particularly around the $5 level, to confirm if this breakout can sustain and lead to higher levels.
This setup presents a solid opportunity for strategic accumulation, and if demand holds at $5, RUNE could deliver a substantial upside in the near term.
PENDLE
Market context
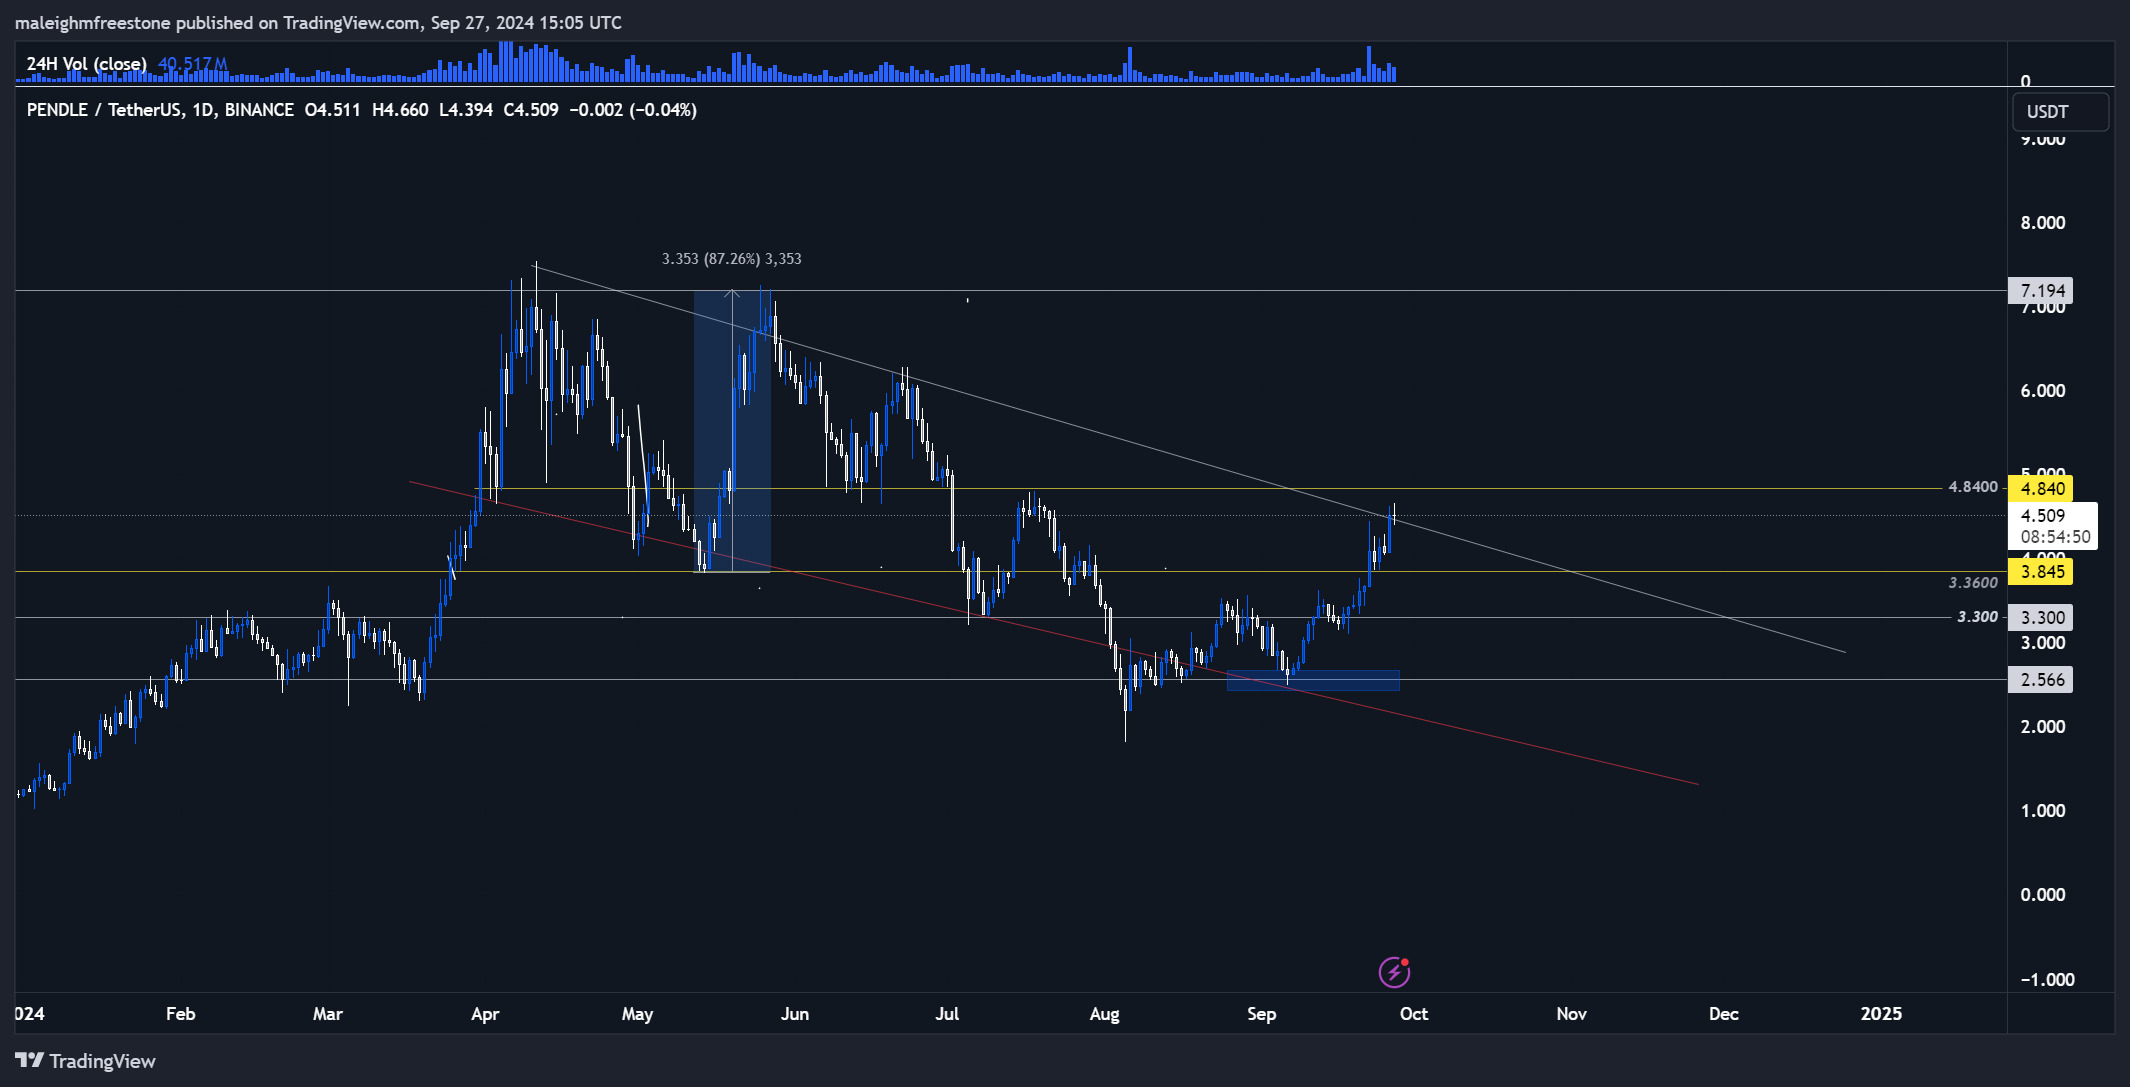
Pendle has been in a bearish downtrend, but it's shown some strong bullish bounces within that trend. Notably, in May, we saw an 88% bounce. Despite selling back down to around $2, we've recovered well with a solid bounce off the key level at $2.5. What we need to focus on now is the top of the bearish resistance channel. We've come up to test that level, and today, we whipped into it, which is exactly what we want to see. Validating this resistance tells us it's a significant level, and once we break it, we can hold a bullish conviction moving forward.Currently, there's been some selling into that resistance, which sits around $4.5. Just above that, we have a key level at $4.84, which acted as major support back in June, April, and May. It's been a battleground with deviations and heavy trading around that zone. If Pendle can break both the bearish trendline and reclaim $4.84, we could see acceleration toward all-time highs and potential bullish expansion from there.
Playbook
- Breakout Play: Wait for the breakout of the bearish trendline and reclaim $4.84. A retest and validation of demand at that level would provide a strong entry, and we can hold with conviction for further upside.
- Retracement Play: Alternatively, if we retrace, look to the $3.36 level, which has been a significant resistance point. It was the resistance that led to the 80% move back in May. A retrace to this level could provide another solid buying opportunity.
Cryptonary's take
Pendle is setting up nicely after some solid recovery from $2.5. The test of the $4.5 resistance and the key level at $4.84 are critical. If we break above these levels and confirm the breakout, there's potential for a strong move back toward all-time highs. We're keeping a close eye on this one, with clear plays either on the breakout or a potential retracement back to $3.36. Both setups could provide solid opportunities, but patience is key.Recommended from Cryptonary


