Save 23% ($351) & Get a Free 1-1 Call with our Team ⏰ : 0d 2h 59m 44s

Disclaimer: This is not financial or investment advice. You are responsible for any capital-related decisions you make, and only you are accountable for the results.
Dogecoin (DOGE):
Market context
Dogecoin has regained momentum, fueled by the Trump narrative and the Department of Efficiency, creating new demand and attention. Breaking out of its long-term bearish structure on DOGE/BTC, while Bitcoin remains one of the strongest-performing assets this cycle, is significant.Few assets have managed to reclaim their March 2022 sell-off levels, let alone trade above them. Dogecoin has done both, solidifying itself as a leader among hype-driven assets.
DOGE/BTC
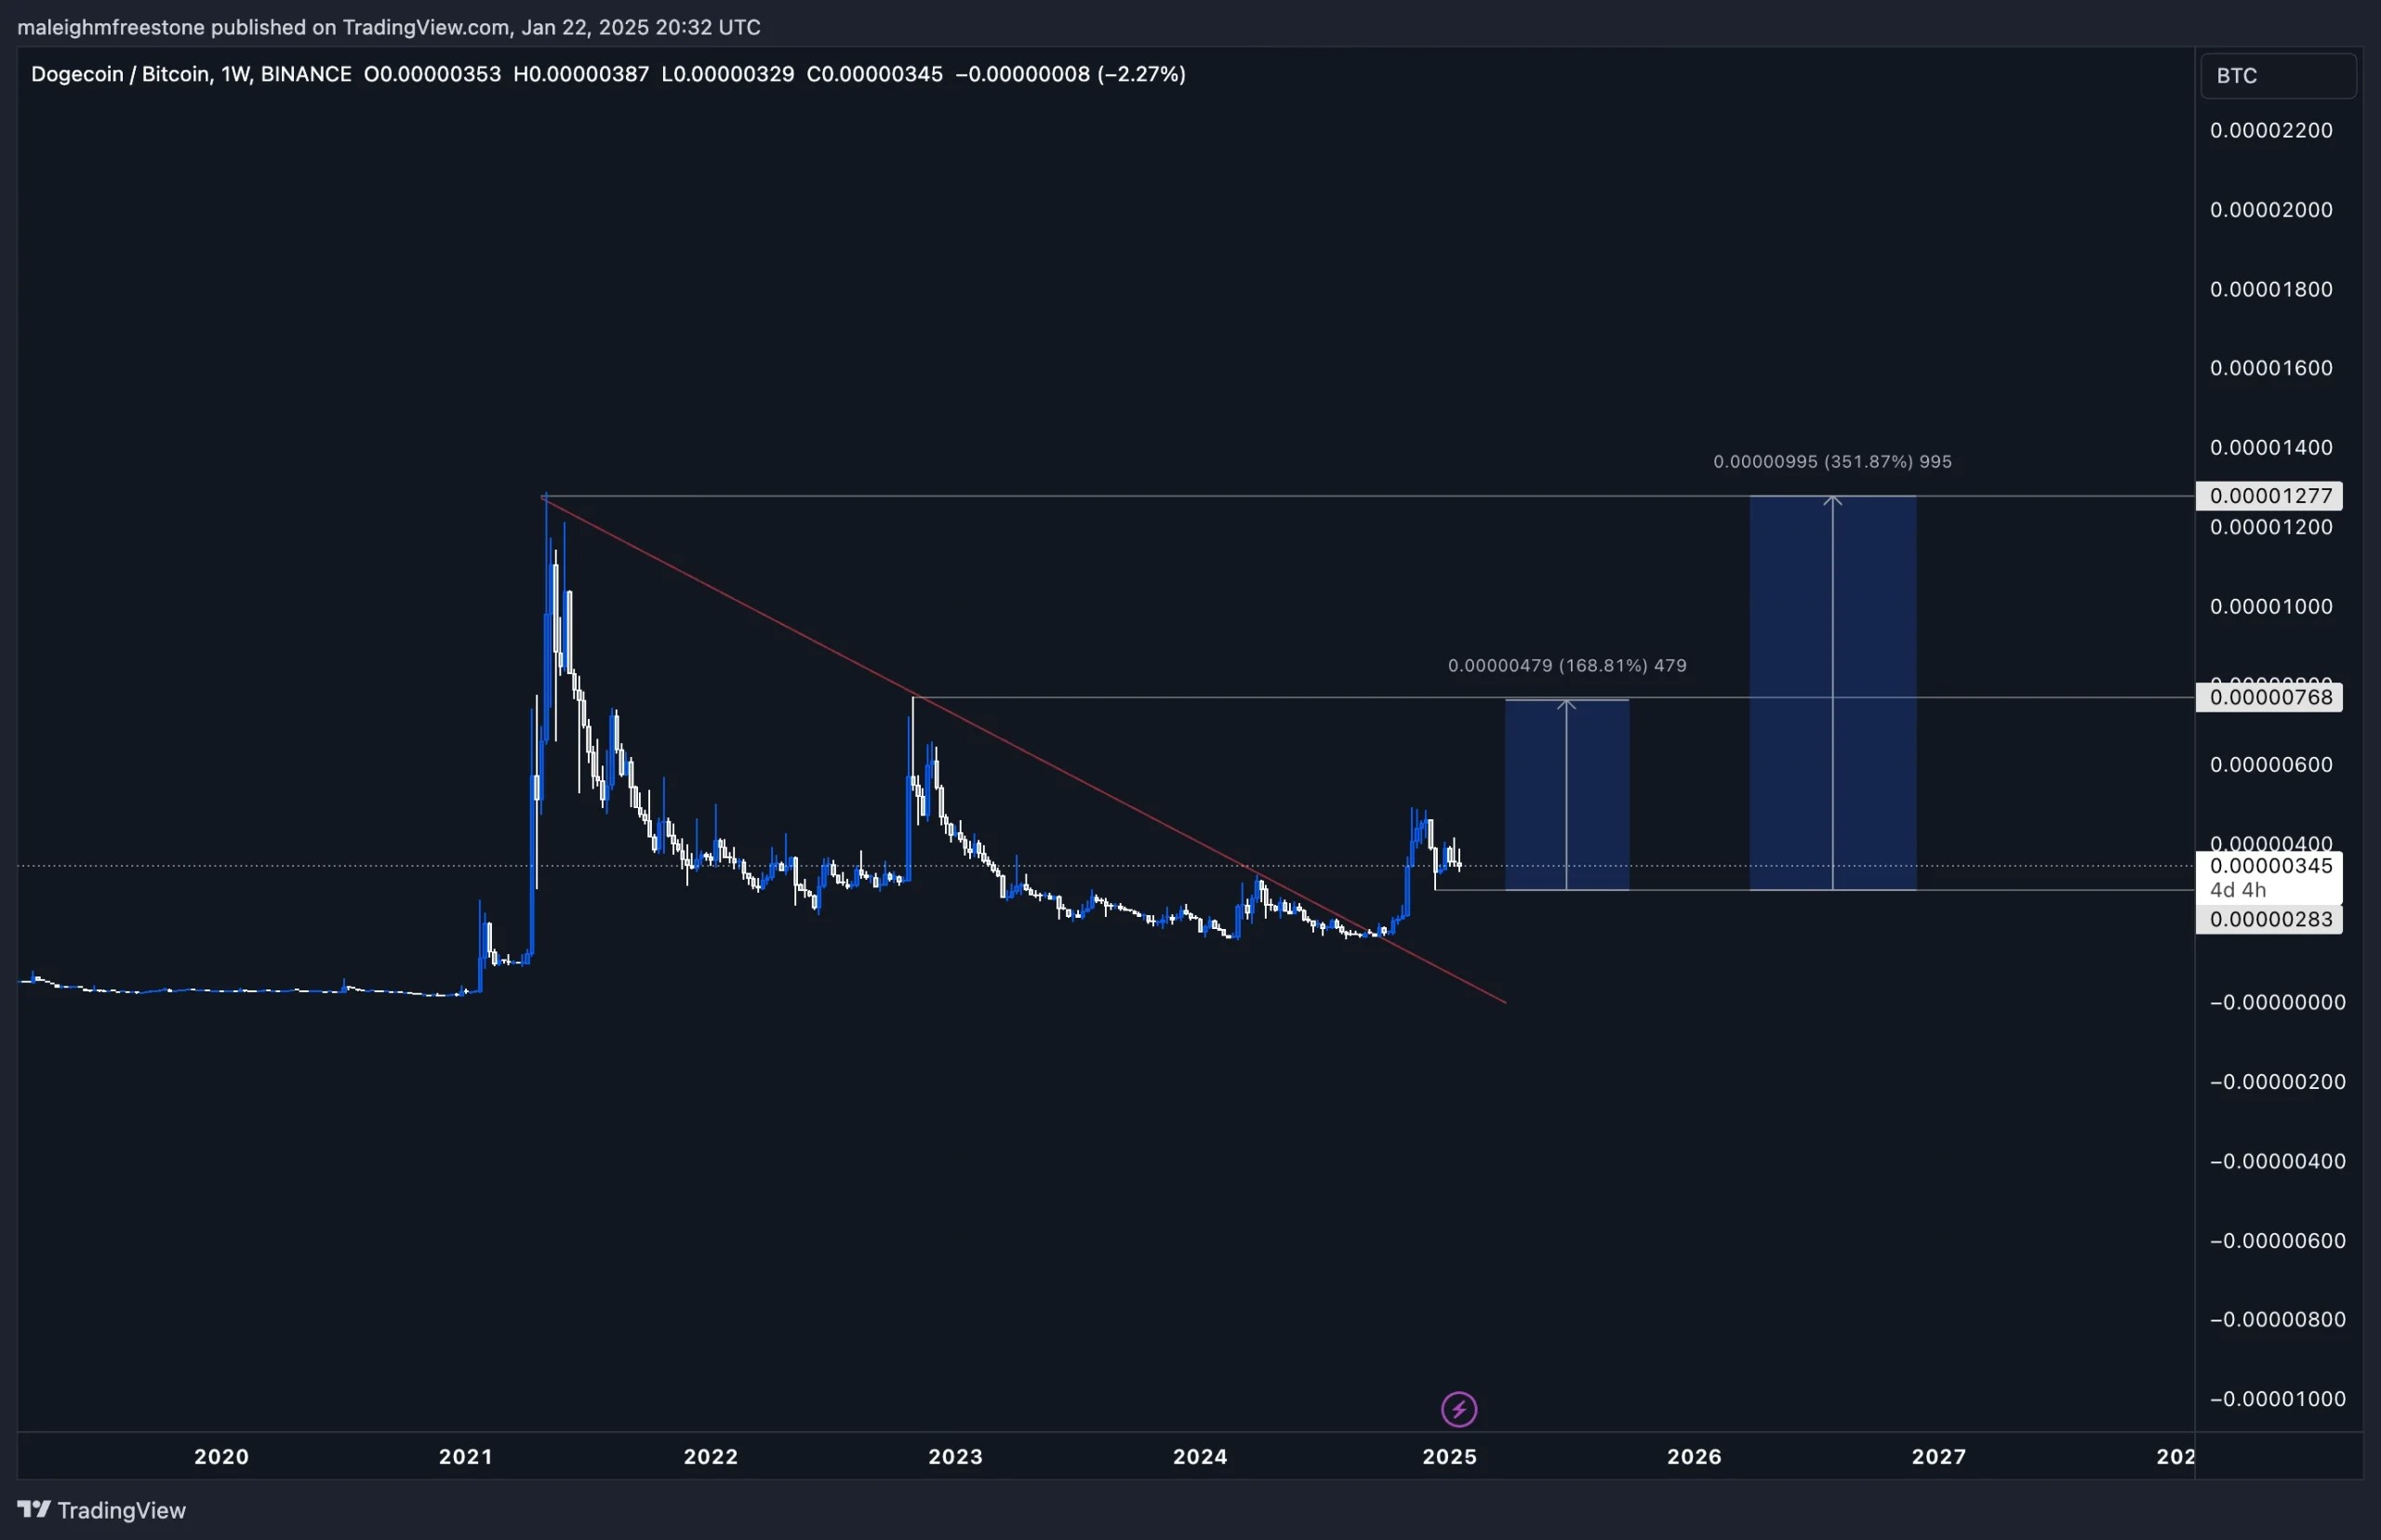
Looking at the DOGE/BTC chart from a macro perspective, Dogecoin has been in a clear downtrend since its peak in May 2021, followed by a series of lower highs:- October 31, 2022: A lower high formed.
- March 2024: Another lower high, reinforcing the bearish trend.
We are now targeting the October 2022 high, as it serves as the next logical level for DOGE/BTC to test. Could DOGE/BTC reach its all-time high again? Potentially, as the cycle progresses, retail capital returns to the market. However, competing directly with BTC for capital this cycle will be tough, so keep expectations realistic while watching for continued strength.
DOGE/USD
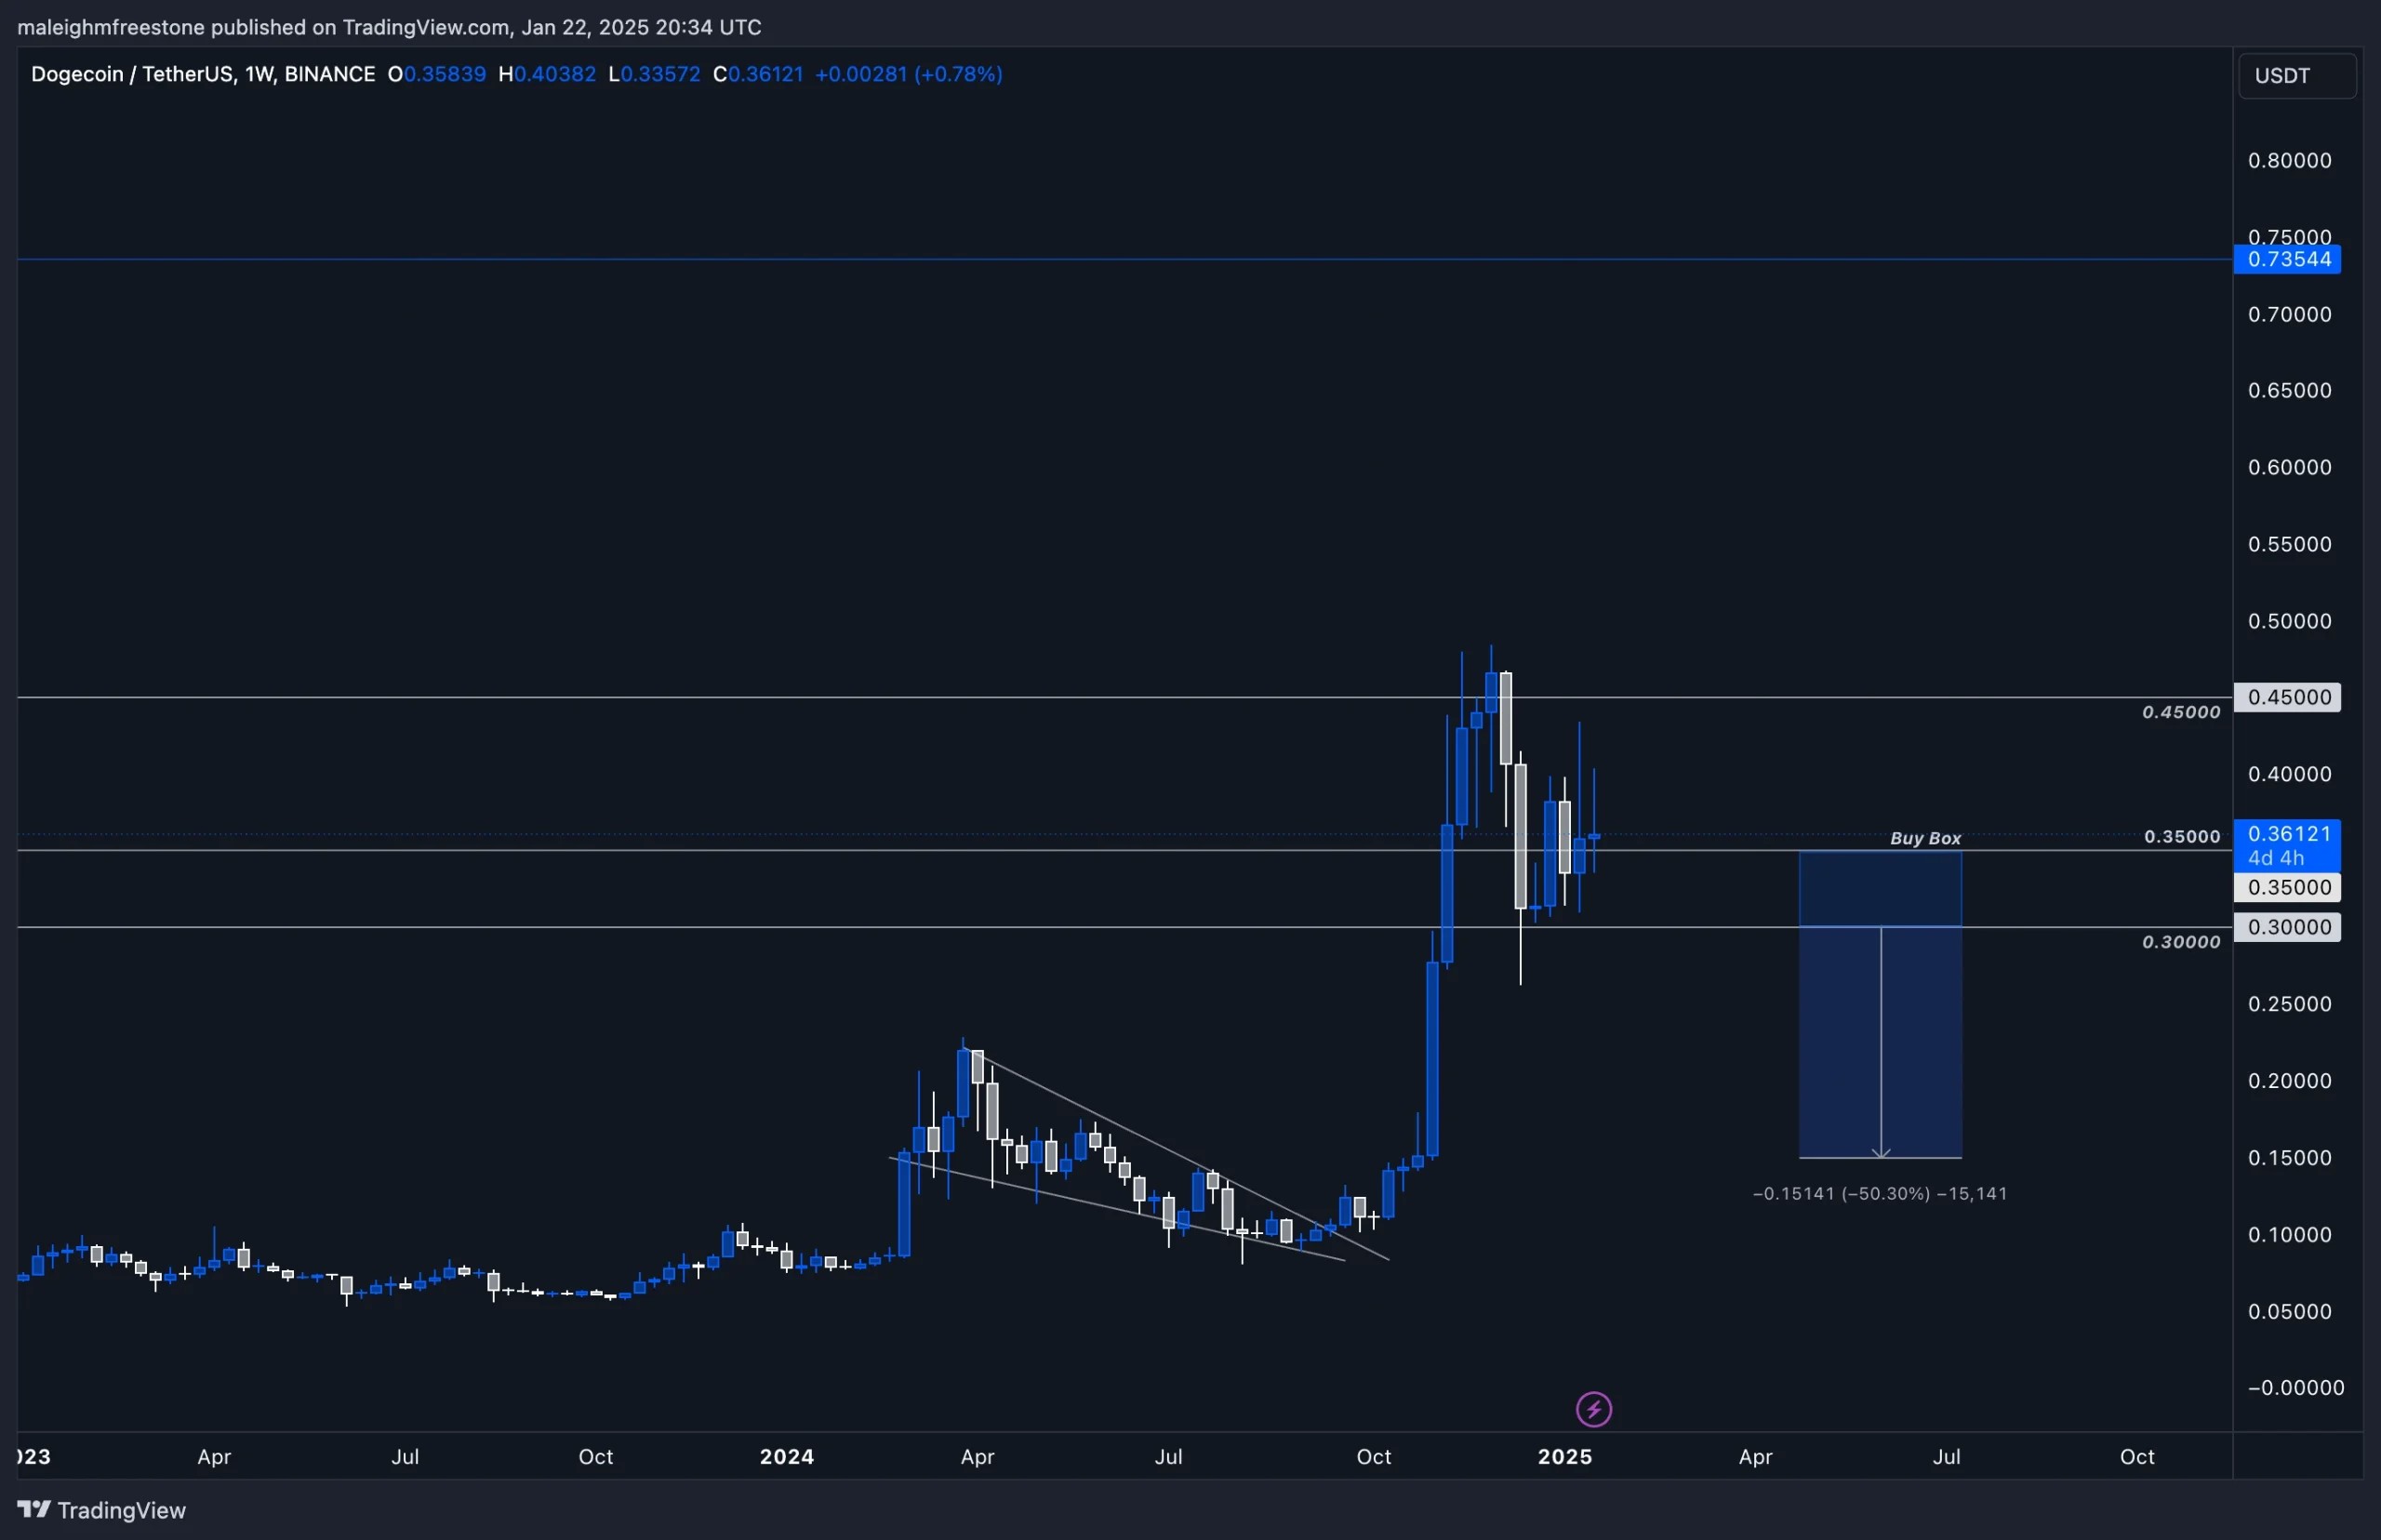
Switching to DOGE/USD, we see a clear accumulation zone between $0.30 and $0.35. This area has consistently attracted aggressive buying, particularly during the surge from October 7th to November 25th, 2024, when demand picked up significantly.- Key Support: $0.30-$0.35 remains the primary accumulation area.
- Upside Potential: The immediate upside target is $0.43, with a mid-term target of $0.75, which aligns with the all-time high.
Open Interest
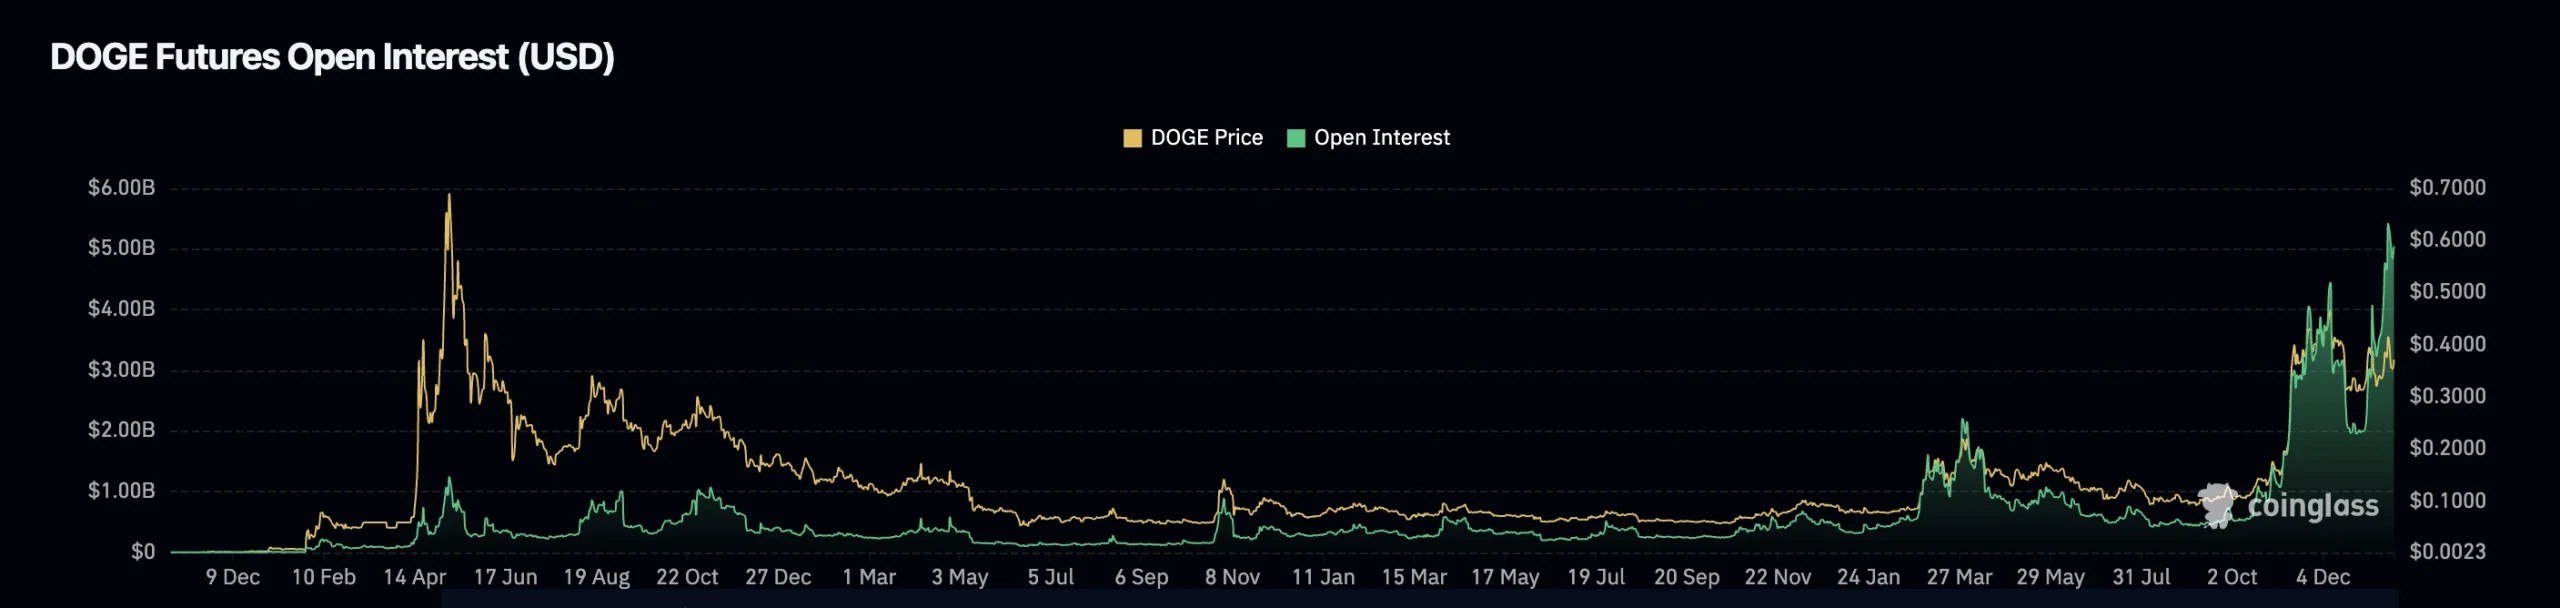
Open interest in Dogecoin has ramped up significantly, particularly over the last few months into 2025. When looking at the open interest chart dating back to 2021, this is the highest level we've seen by a mile, reflecting strong demand for leveraged positions on Dogecoin.This increase in open interest, combined with aggressive buying in the spot market, highlights renewed interest in Dogecoin as a speculative asset. Although funding rates remain flat for now, the heightened open interest suggests that traders are positioning for significant moves, either to the upside or downside.
Playbook
Spot accumulation
- Build positions in the $0.30-$0.35 buy zone, which has proven itself to be a strong level of demand.
Low-leverage strategy
- Utilize 2x or 3x leverage from around $0.30 for controlled exposure. This allows for a relatively low-risk approach while taking advantage of the clear accumulation zone.
Upside targets
- DOGE/USD: Watch for $0.43 as the next key level and $0.75 as the mid-term target.
- DOGE/BTC: Focus on the October 2022 high as the next key resistance level.
Cryptonary's take
Dogecoin is an asset that demands respect in this cycle. Despite BTC's strength, DOGE has broken out of its bearish DOGE/BTC structure, showing resilience and renewed attention from retail traders. The combination of the Department of Efficiency narrative, accessibility, and aggressive buying makes it a standout among hype-driven tokens.While the market continues to front-run narratives, Dogecoin remains well-positioned to capitalize on retail capital and sentiment-driven demand. Stick to the $0.30-$0.35 buy zone, monitor BTC's dominance, and keep an eye on DOGE's ability to attract continued interest through its accessibility and narrative-driven appeal.
Fetch.ai
Overview
Fetch.ai (FET) is currently trading at $1.21, consolidating above the 200 EMA on the 3-day time frame, which is positioned at $1.17. This EMA has consistently acted as a significant support level for FET, as observed since August. The price has been oscillating between a well-defined range of $1.1 (support) and $1.6 (resistance), occasionally experiencing breakouts or breakdowns from this range.FET is currently rebounding from the $1.17 support area and shows signs of stabilization within the range. However, the market appears indecisive, with a clear move contingent on whether FET can sustain above the 200 EMA and challenge the upper resistance levels.
Analysis
Current price action
- Support levels: The $1.1 support zone, coupled with the 200 EMA, has proven critical for FET, enabling repeated bounces and providing a strong base. If this area holds, FET could mount another rally within its current range.
- Resistance levels:
- Immediate resistance lies at $1.6, a level that has capped previous upward attempts.
- A breakout above $1.6 could lead to a retest of $2.21, the high reached in late November and early December 2024.
- Beyond that, $3.47, the all-time high (ATH), remains a significant longer-term target.
Historical price movements
- August 2024: FET dropped below the $1.1 support, briefly touching $0.79, before rebounding sharply.
- November-December 2024: Price surged above the range to test $2.21, but a rejection led to the current retracement back into the range.
- FET's tendency to dip below and break above its range highlights the potential for liquidity grabs, making it essential for traders to remain cautious.
Key levels
Support
- 200 EMA (3-Day): Positioned at $1.17, acts as a critical dynamic support.
- $1.1: Main range support.
- $0.79: Deeper support if the range breaks on the downside.
- $0.535: A more extreme support, indicating potential capitulation.
Resistance
- $1.6: Immediate resistance.
- $2.21: Medium-term resistance.
- $3.47 (ATH): Long-term resistance.
Potential scenarios
- Bullish scenario:
- If FET consolidates above the 200 EMA and breaks $1.6, a rally to $2.21 is likely. Sustained momentum above $2.21 could pave the way toward its $3.47 ATH.
- Bearish scenario:
- A failure to hold the $1.1 support and the 200 EMA could lead to a decline toward $0.79 or even $0.535 in the event of significant bearish momentum.

Cryptonary's take
Fetch.ai ($FET) presents an interesting setup as it hovers above critical support zones. The 200 EMA on the 3-day time frame has historically been a strong base, but with the current market uncertainty, breaking below this level could lead to deeper corrections. On the flip side, reclaiming and sustaining above $1.6 could open the door for bullish continuation to $2.21 and beyond.In these scenarios, patience is key. Monitoring FET's reaction at the $1.6 resistance or the $1.1 support zone will be crucial for the next directional move.
Recommended from Cryptonary


