Save 23% ($351) & Get a Free 1-1 Call with our Team ⏰ : 0d 2h 59m 43s
DOGE, RUNE, LINK, OP: Levels signalling accumulation opportunities
As the crypto market recalibrates, DOGE consolidates near $0.35, RUNE defends $3.5, LINK steadies above $20.74, and OP navigates its $1.6-$1.8 zone. Let’s explore key levels and what’s next for these assets.

Disclaimer: This is not financial or investment advice. You are responsible for any capital-related decisions you make, and only you are accountable for the results.
DOGE:
Market context
DOGE remains a strong asset within its narrative, continuing to hold significance around our previously identified key levels. The initial $0.35 buy box saw a deviation, with the price dipping into the $0.30 region before reclaiming $0.35 on January 3rd. This reclaim marked a short-term bullish shift, but since then, we’ve begun to see a sell-off back into this key range.The broader market context this week isn’t overly macro-heavy, but there is data to keep an eye on, and we are beginning to see direction emerge after a mild sell-off across the board. DOGE remains resilient, and this pullback is far from concerning. Instead, it presents clear levels to focus on for accumulation and positioning.
The key takeaway here is that DOGE continues to consolidate around reliable support levels. Price action reflects a healthy reset, setting the stage for a potential move higher.

Price Action
$0.35 level:
The price was reclaimed at $0.35 on January 3rd after a deviation below, signalling buying pressure in this zone. However, the current sell-off has pushed us back into this region, presenting an opportunity to accumulate. If we hold $0.35, it could form a clean inverted head and shoulders pattern, which is bullish.$0.30 level:
Our secondary buy box remains at $0.30, a level that has shown strong historical demand and acted as a significant floor during the last pullback. If the price moves lower, this level offers another solid opportunity to build positions. A move down to $0.30 could also form a double-bottom structure, adding to the case for a bullish continuation.DOGE’s current price action reflects a classic consolidation phase, with both levels ($0.35 and $0.30) expected to hold as key support zones.
Playbook
Spot accumulation:
- Primary buy zone: $0.35 – Accumulate on pullbacks into this level, particularly as it aligns with the reclaim and current retest.
- Secondary buy zone: $0.30 – Strong historical support. If the price dips further, this level offers another opportunity for spot-building.
Upside levels:
- $0.43: The next key resistance to target on a breakout.
- $0.63: Mid-term target reflecting DOGE’s potential for momentum-driven upside as part of its bullish narrative.
Cryptonary’s take
DOGE’s pullback back into the $0.35 region is a natural and healthy development, allowing for further accumulation at key support levels. The deviation below $0.35 into $0.30 during the previous sell-off demonstrated the importance of these levels, with both zones offering solid opportunities to build positions.DOGE’s ability to reclaim $0.35 and its resilience at these levels reinforce its bullish narrative. While some short-term selling pressure is expected, it’s nothing negative within the broader structure. Holding $0.35 would confirm an inverted head and shoulders pattern, while a dip to $0.30 could present a double-bottom opportunity.
The focus remains on these two accumulation zones, with upside targets of $0.43 and $0.63 still intact. Stick to the plan, manage your risk, and keep your eyes on these key levels.
RUNE:
Market context
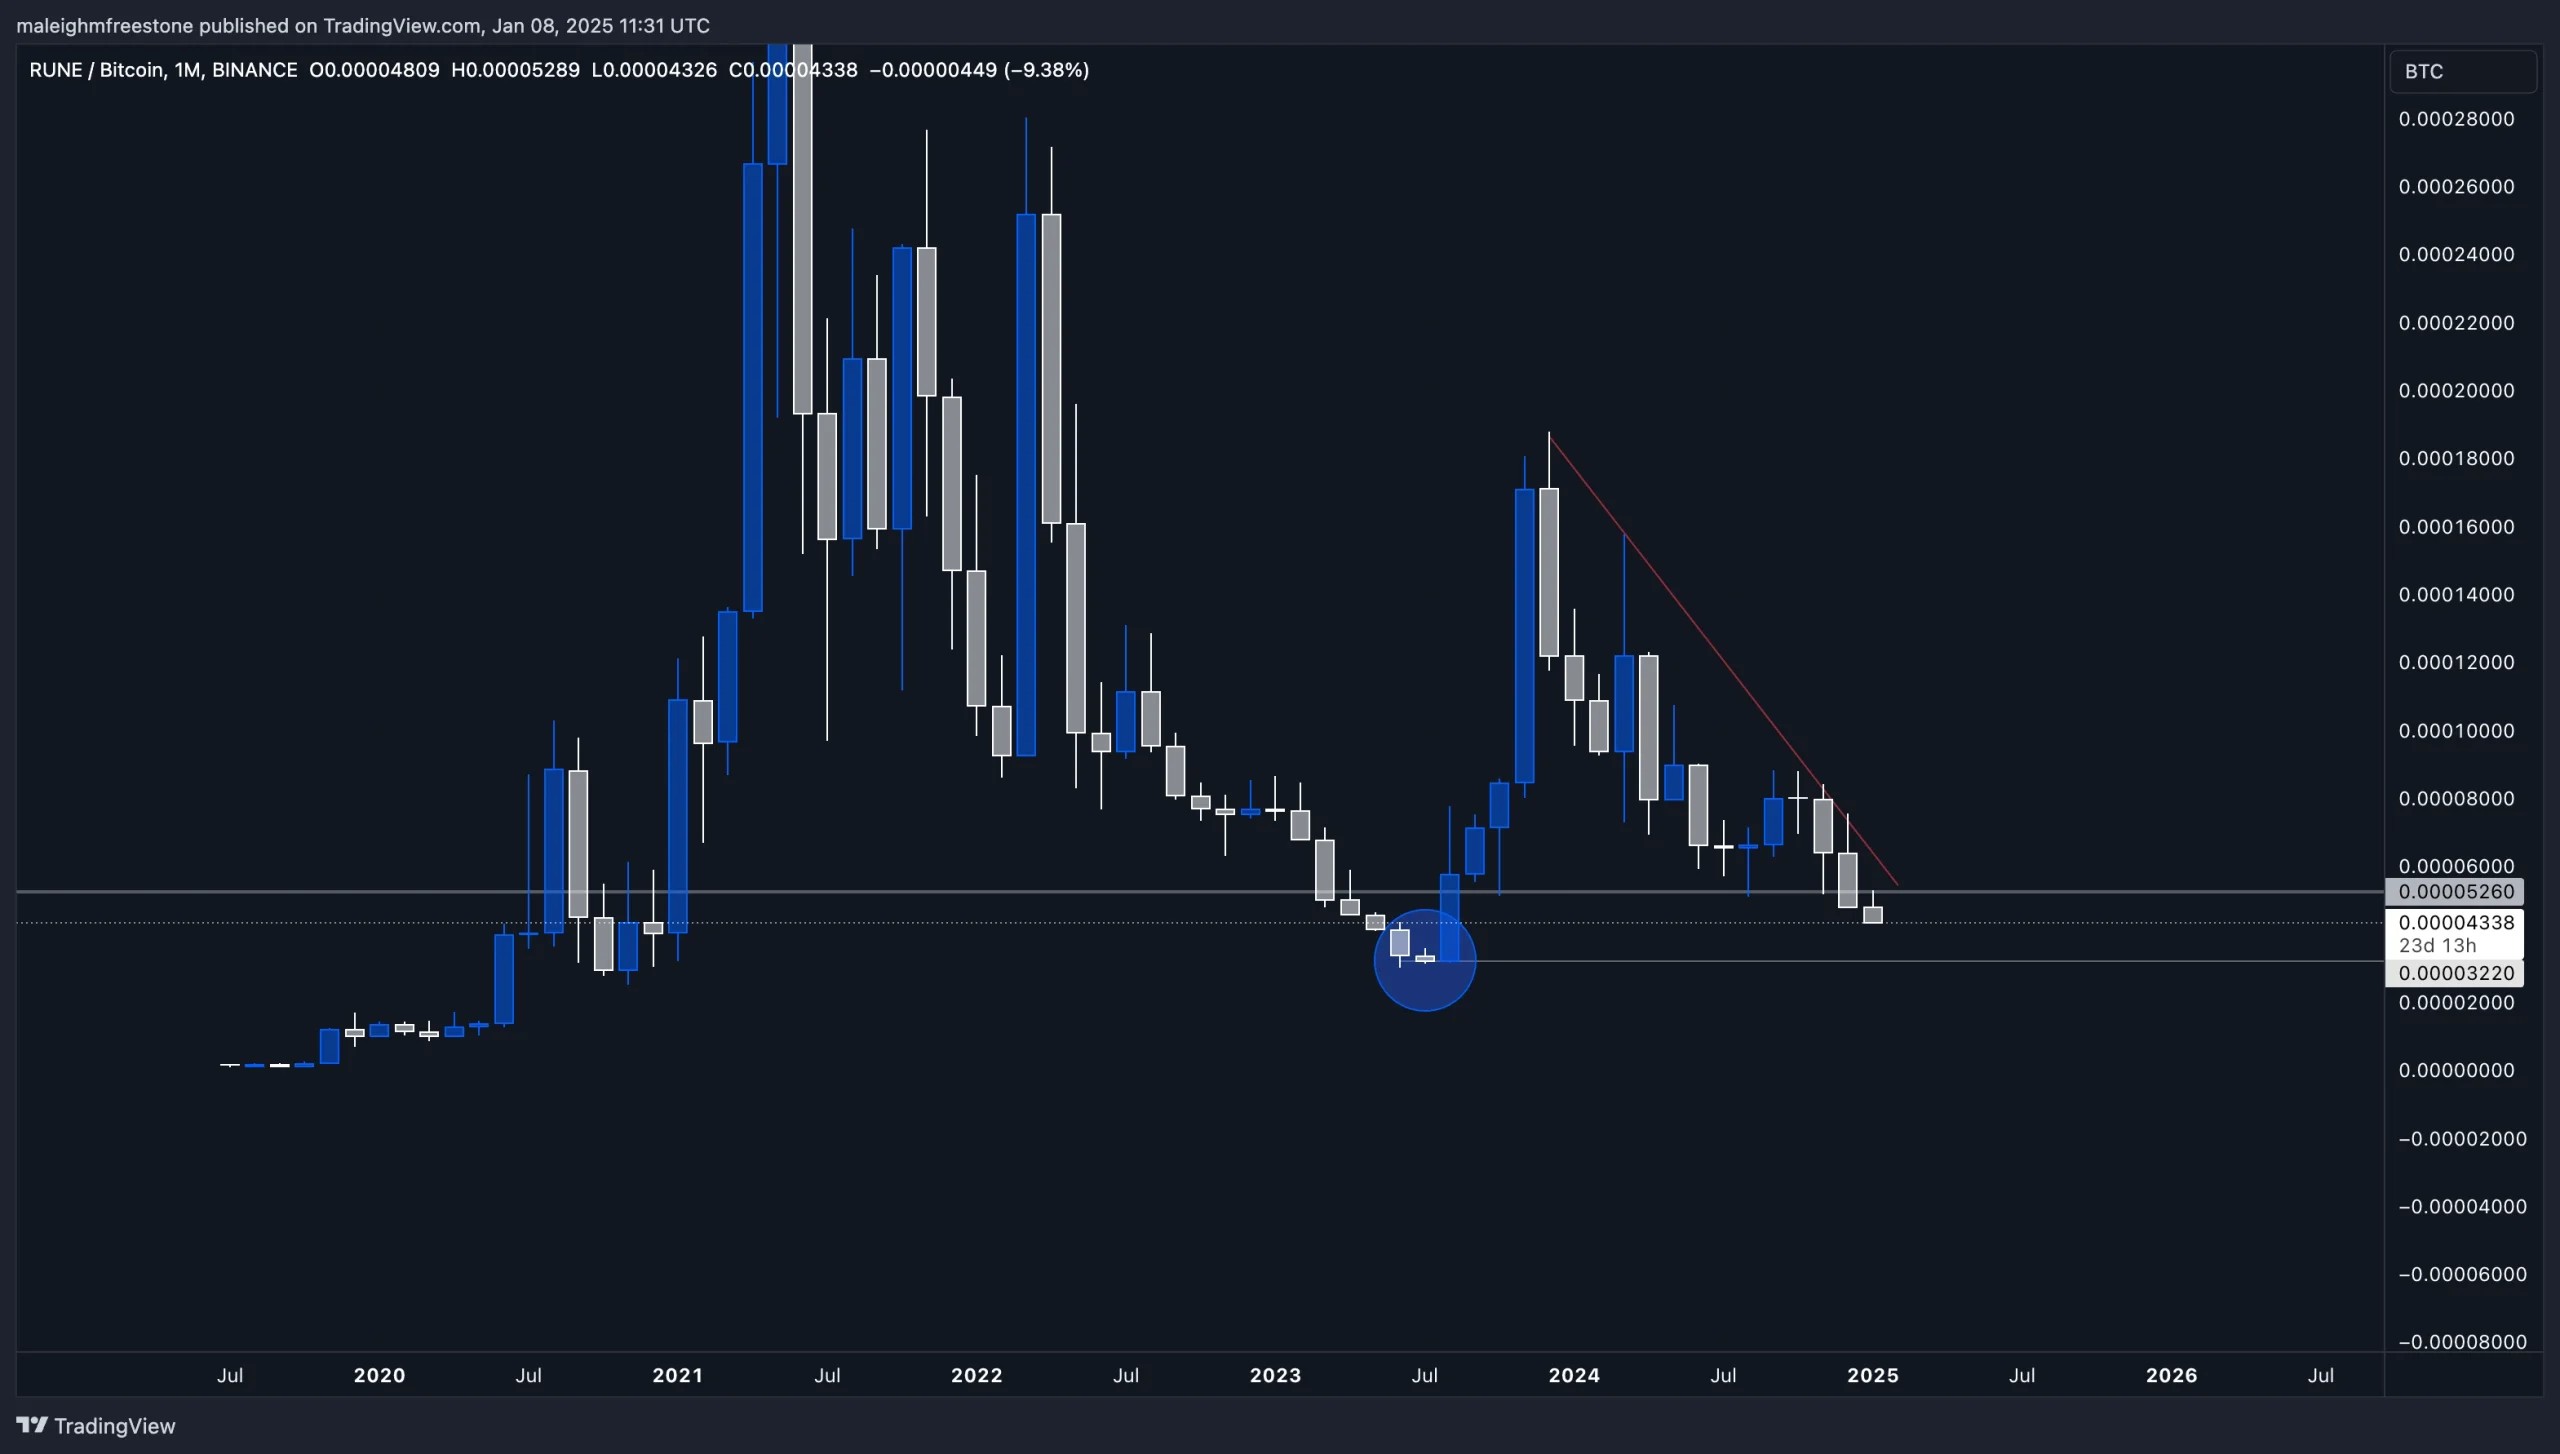
Let’s start with Rune/BTC, where we’ve seen an interesting breakdown of the wedge pattern we previously highlighted. Price has now come back into what we’re calling the “scene of the crime” level, circled in blue on the chart. This level holds significant historical importance:- January 2021: Rune/BTC launched a 1,000% move from this exact price point.
- July 2023: This was where Rune/BTC bottomed out and found support, marking another key inflexion point.
Switching over to the RUNE/USD chart, the narrative aligns:
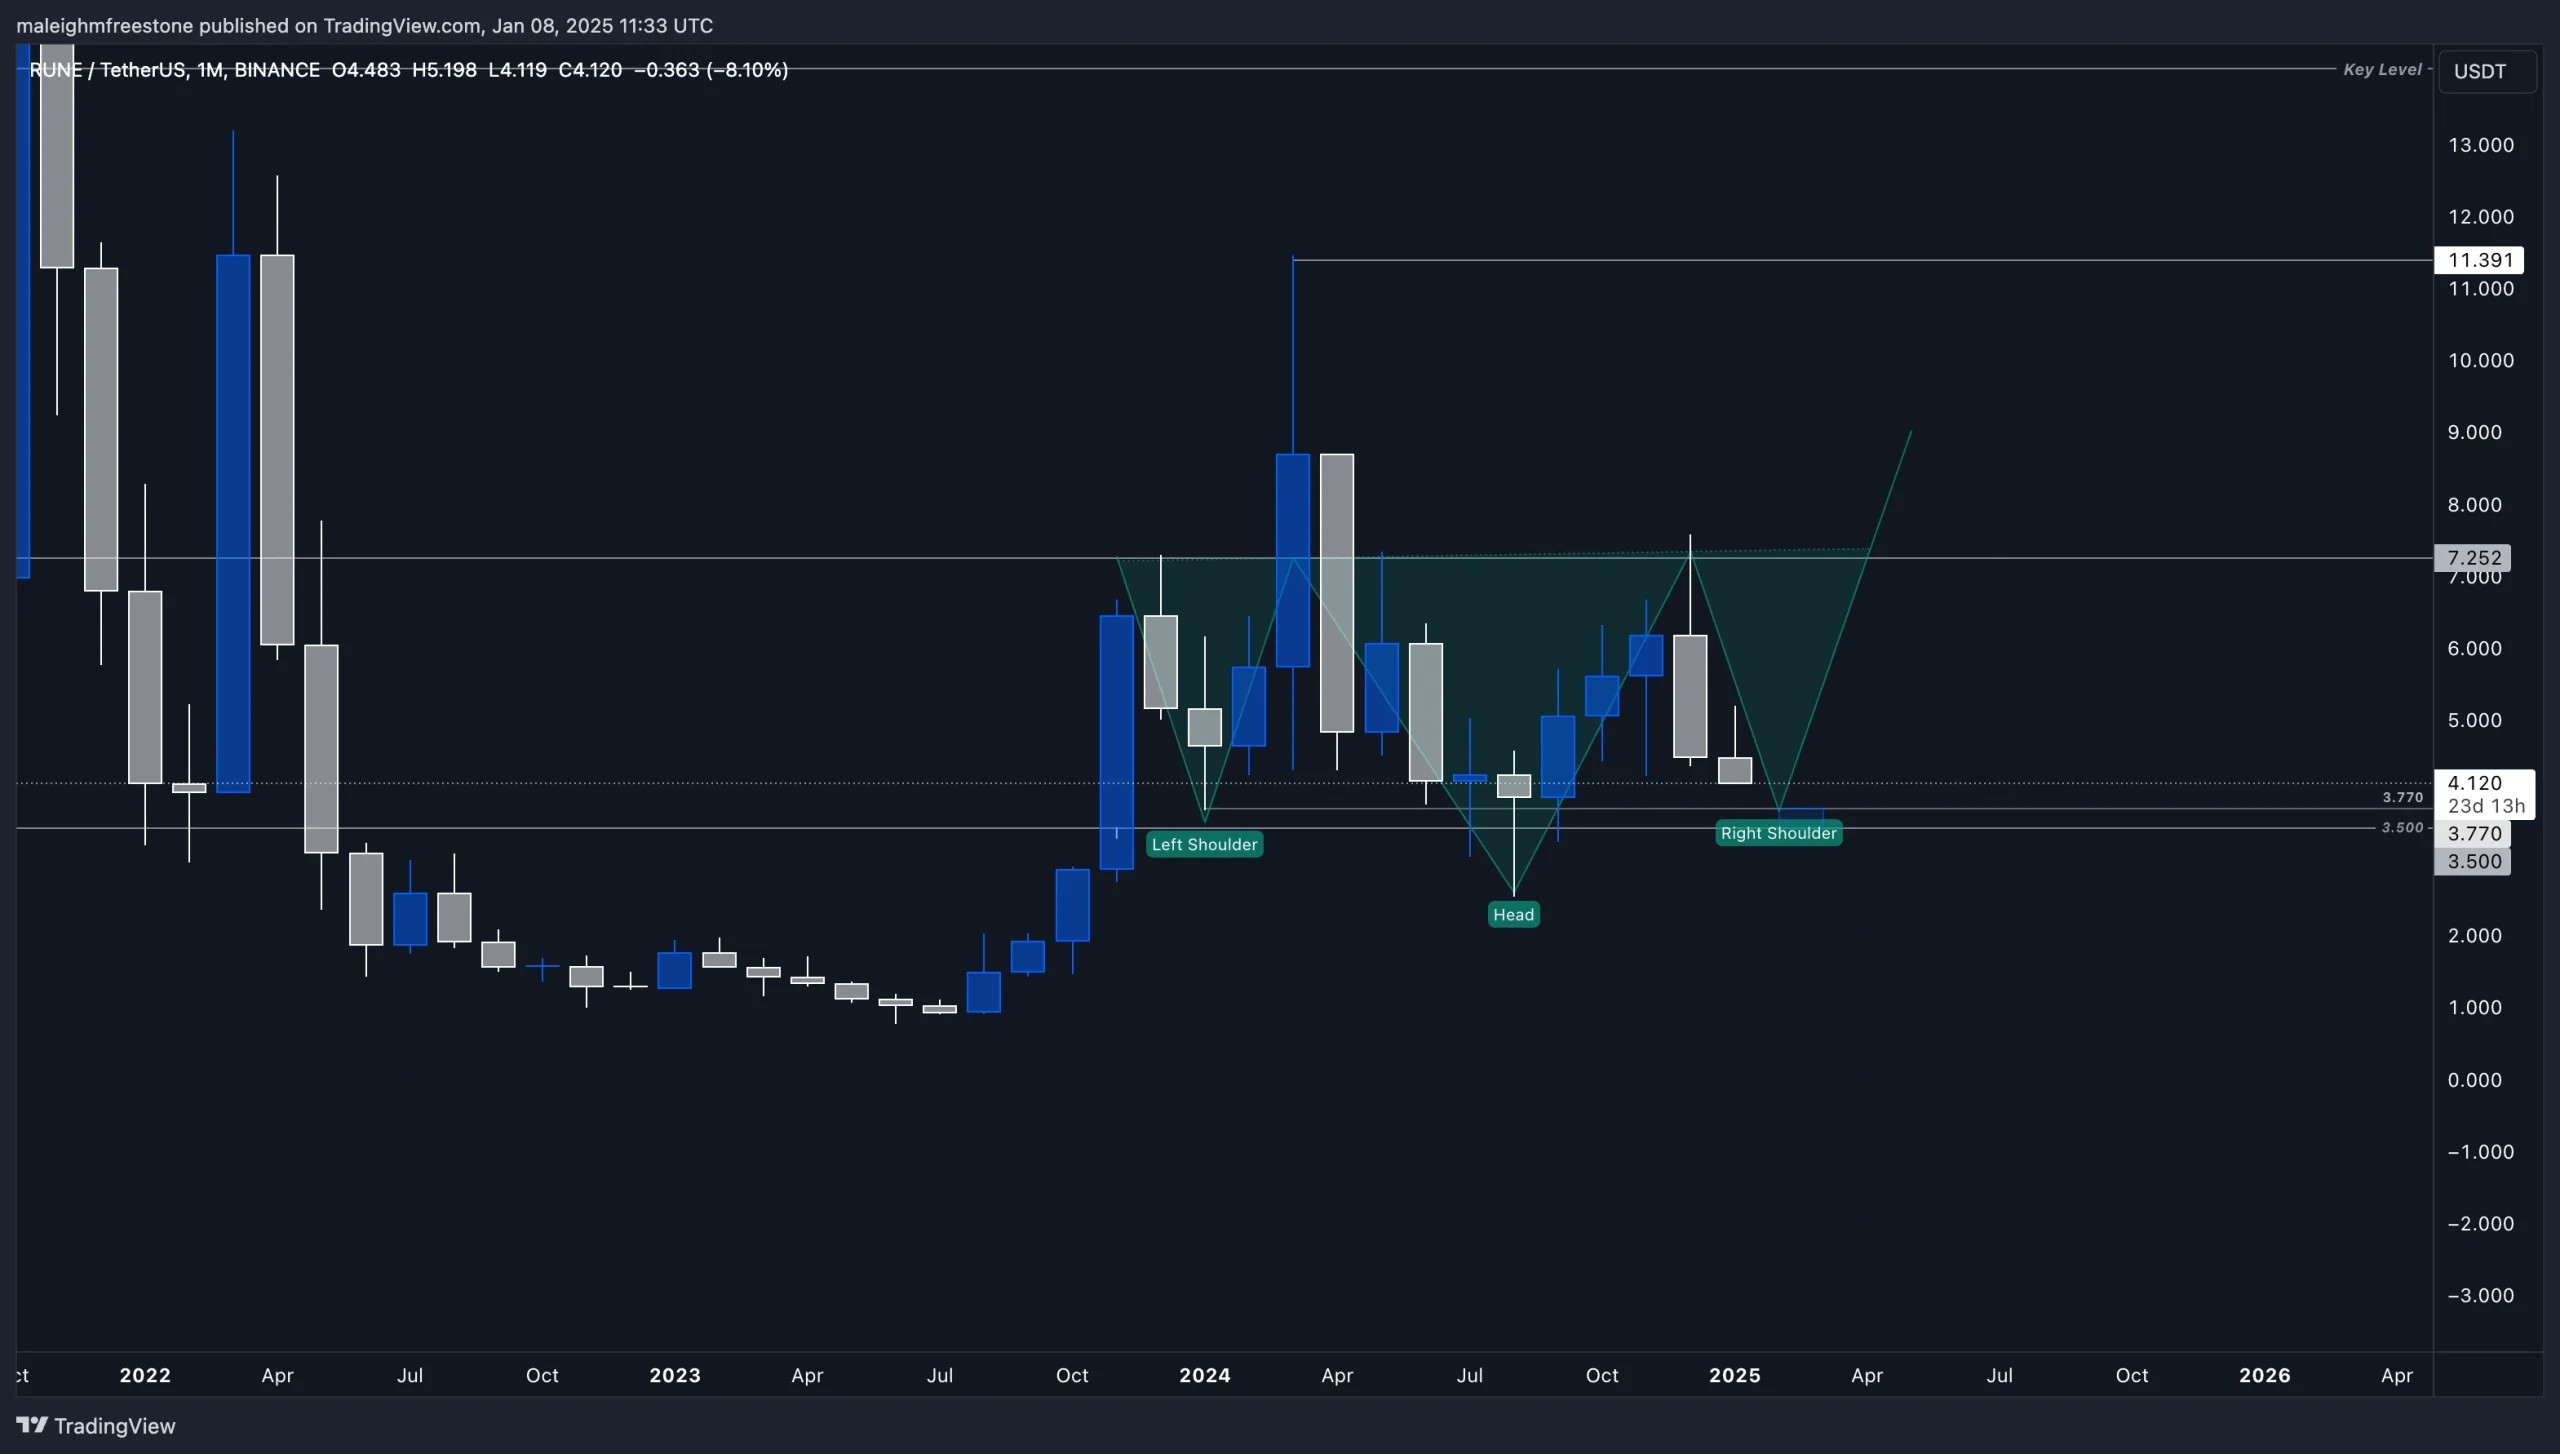
- Price is retracing back into the $3.7 to $3.5 range, a level with major significance.
- In January 2024, this level acted as the scene of the crime, launching a rally that printed highs into $11.
- Throughout June, July, August, and September, this price zone held further support.
- We saw a significant stab through this region before forming an inverted head and shoulders pattern on the monthly chart.
Price action
RUNE/BTC:
The scene of the crime level, highlighted in blue on the chart, is a historically significant price zone for RUNE/BTC. It’s the level where RUNE launched its most notable rallies, including the massive 1,000% move in January 2021 and the key bottoming in July 2023.Currently, RUNE/BTC has broken below the wedge pattern we previously discussed, and after retesting this breakdown level, the chart now suggests that the price may continue to trade lower into this key support zone. This area represents a potential accumulation opportunity for those looking at the mid-to-long-term perspective.
RUNE/USD:
On the USD chart, the $3.7 to $3.5 range is emerging as a critical accumulation zone. This price level has consistently served as strong support, with multiple historical rallies originating from this zone. Notably, in January 2024, this level acted as a springboard for a rally that printed highs at $11.Throughout June, July, and September, the range held firm, despite a significant stab through, forming an inverted head and shoulders pattern. Now, it looks as though RUNE/USD may be coming back down to form the right shoulder of this bullish setup. This structural alignment offers an optimistic outlook for accumulation and potential upside.
Playbook
RUNE/BTC strategy:
- Spot accumulation: Use the retest and further declines into the scene of the crime level to build positions, as this is historically where RuneBTC bottoms and rallies.
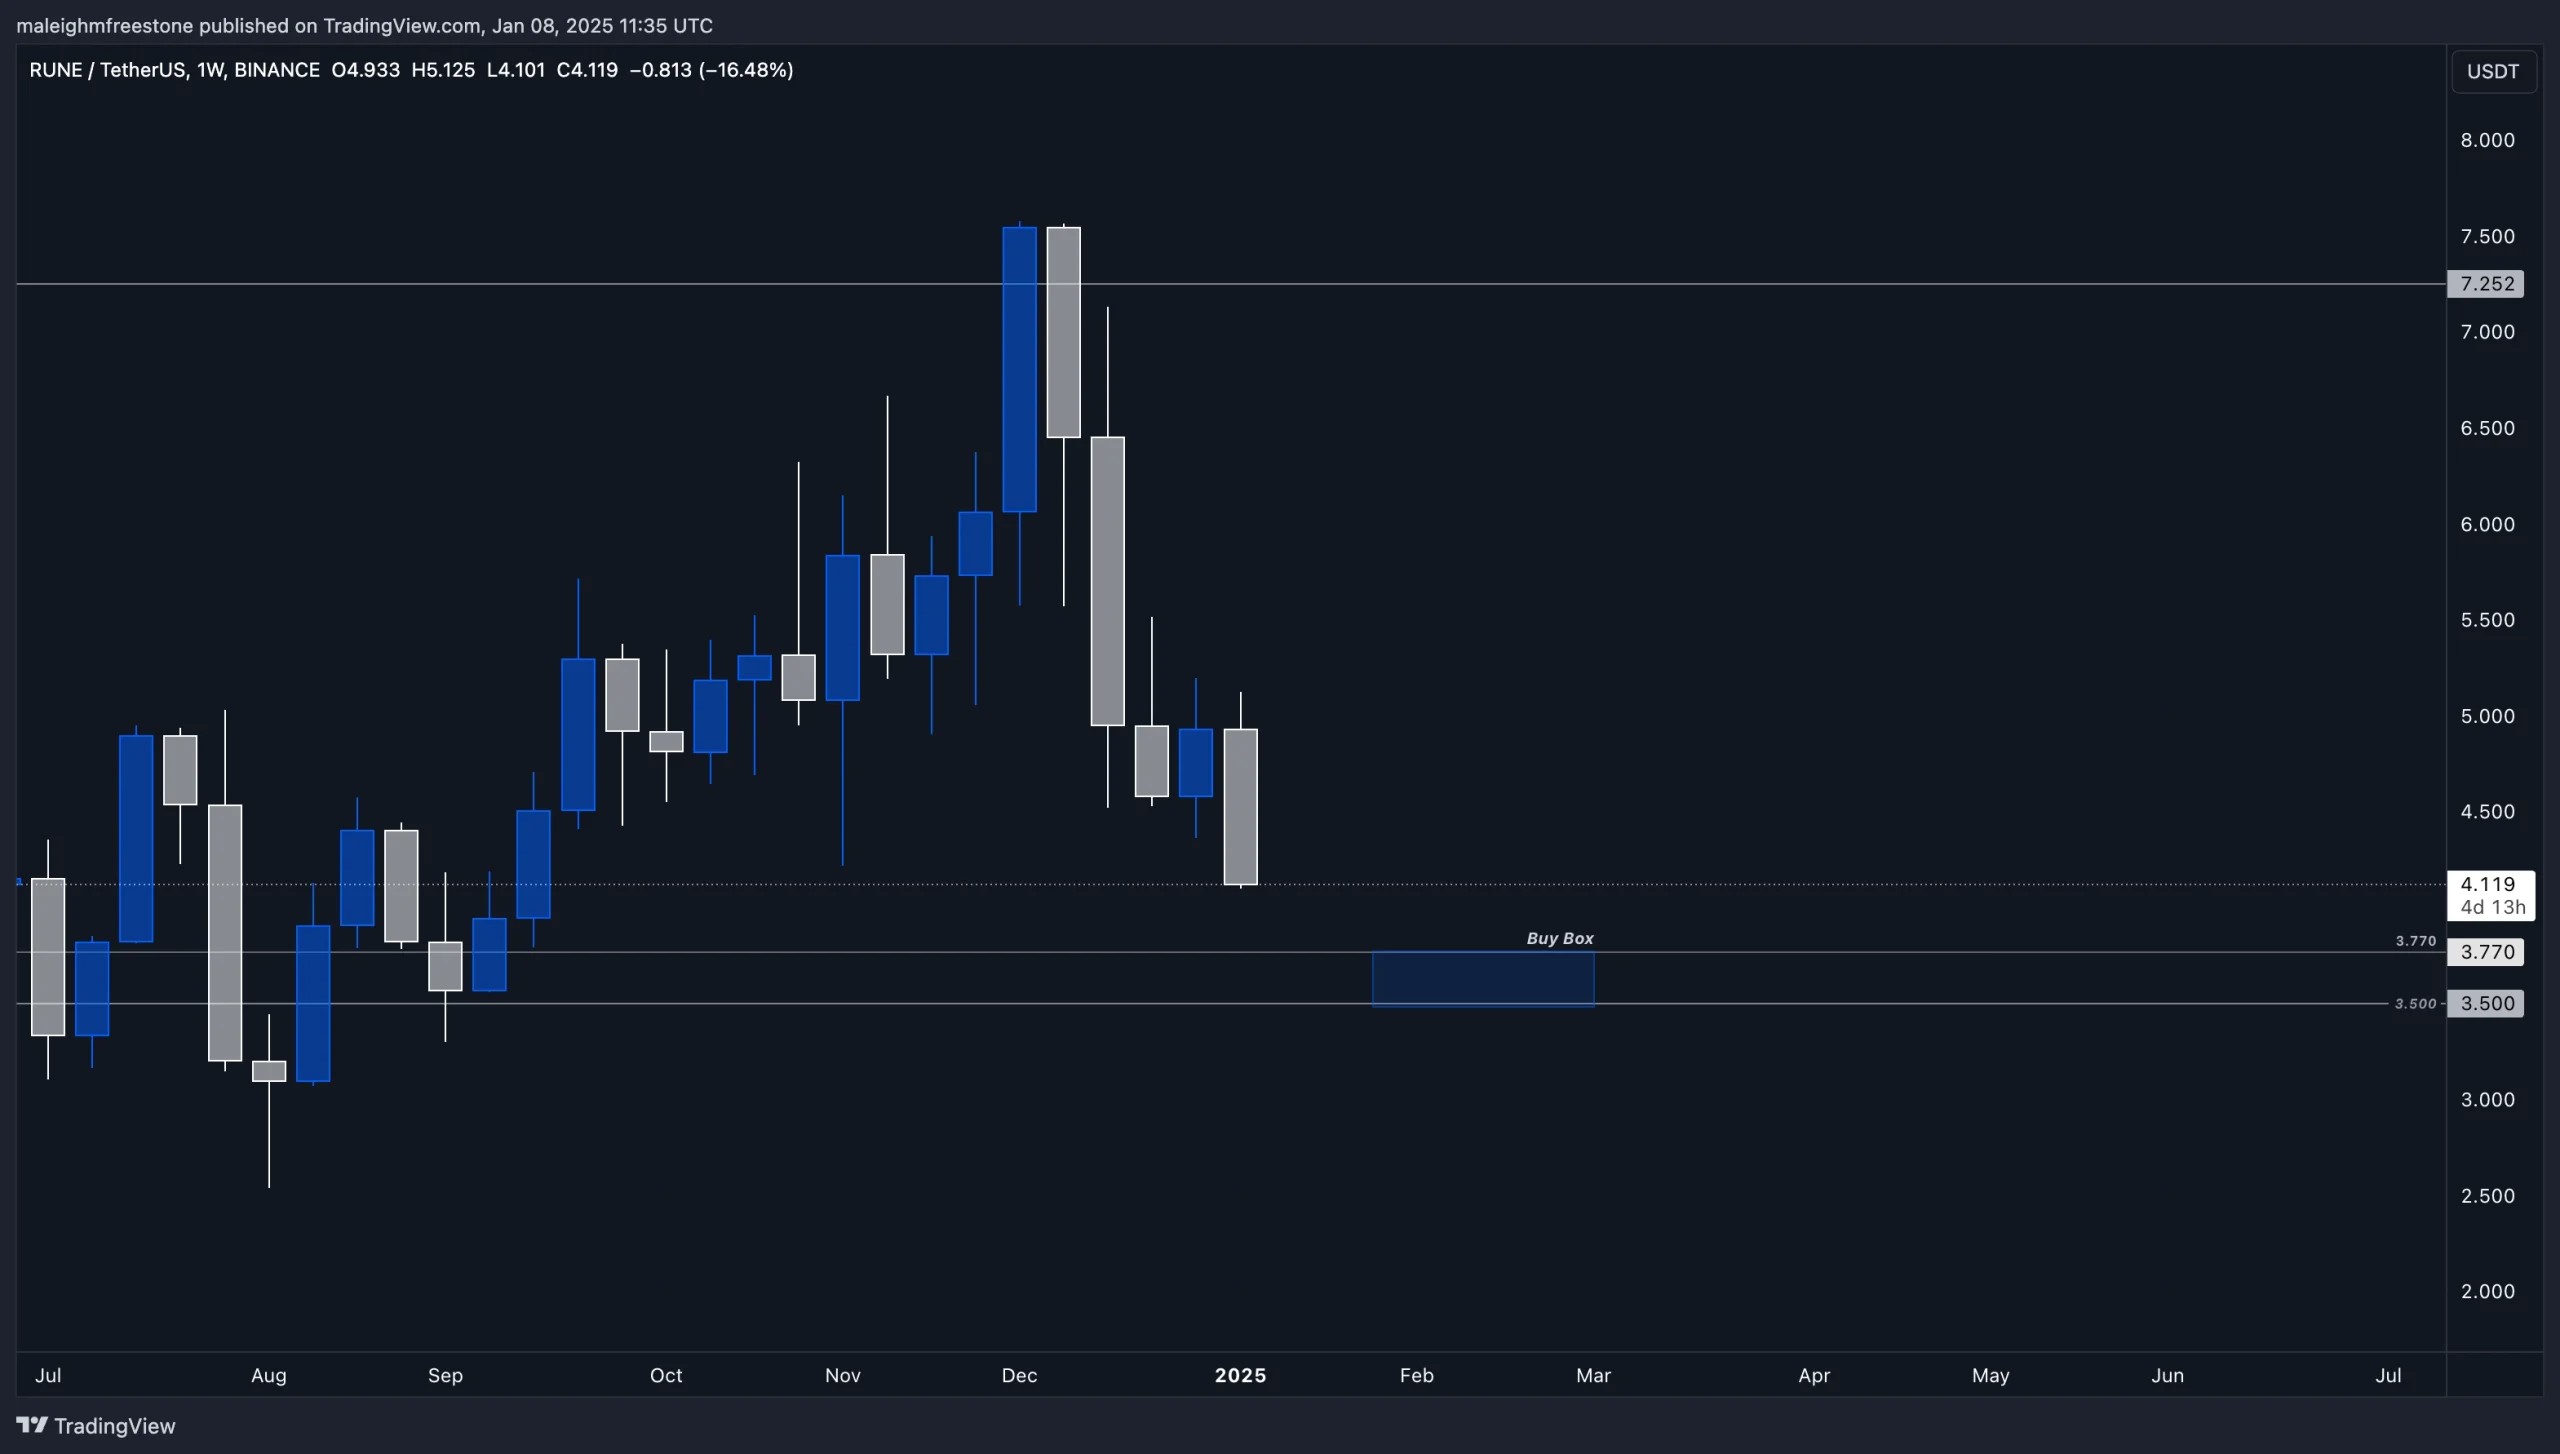
RUNE/USD Strategy:
- Primary Buy Box: The $3.7 to $3.5 range remains the ideal accumulation zone.
- Inverted Head and Shoulders Setup: Watch for the formation of the right shoulder and confirmation of support in this range.
Cryptonary’s take
RUNE continues to demonstrate strong historical respect for key levels. RUNE/BTC is heading back to its scene of the crime level, a zone that has previously launched massive rallies and bottomed price action. Meanwhile, RUNE/USD remains structurally intact, with $3.7 to $3.5 acting as a reliable support zone for accumulation.While the broader market sentiment remains uncertain, RUNE’s behaviour suggests we could be approaching a bottoming process. This aligns nicely with the potential for a market-wide shift in the coming weeks or months. The focus remains on responsible accumulation at these key levels, especially for long-term positioning.
Stay disciplined, and as always, stick to the levels.
LINK:
Overview
Chainlink ($LINK) is currently trading at $20.71, holding around the key $20.74 support zone on the daily time frame. This level has been critical for maintaining the bullish structure in recent price action.While Chainlink faces resistance overhead, the current consolidation suggests the potential for a decisive move in the coming days.
Analysis
Support levels
- $20.74: The immediate support zone where $LINK is currently trading, offering stability for the asset.
- $19.16: A deeper support level, providing another layer of defence should the price dip further.
- $16.54 - $16.6 Area: This confluence of the 200 EMA on the daily time frame ($16.62) and a strong historical support zone adds significant weight to this level. It acts as a robust safety net in the event of a deeper pullback.
Resistance levels
- $22.87: The first major resistance level for $LINK to overcome, signalling renewed bullish momentum.
- Above $22.87: Breaking this resistance opens the path for further upside, with additional levels to be monitored as momentum builds.
Price structure
Chainlink is consolidating above the $20.74 support, with a well-defined range between $19.16 (support) and $22.87 (resistance). A break in either direction will dictate the short-term trajectory of the asset.If $LINK loses the $19.16 support, it is likely to test the $16.54 - $16.6 zone, where strong demand is expected due to the confluence with the 200 EMA.

Cryptonary's take
Chainlink ($LINK) is navigating a critical price range, holding above $20.74 while facing resistance at $22.87. The asset remains technically sound, with strong support levels below and opportunities for bullish continuation if resistance levels are broken.For now, $LINK’s ability to hold above $20.74 will determine its immediate trajectory. A break above $22.87 could lead to significant upside, while a loss of $19.16 would bring the $16.54 - $16.6 zone into focus as a key accumulation area.
Chainlink remains a stable asset to monitor in the current market environment, with both support and resistance zones clearly defined for actionable insights.
Optimism ($OP):
Overview
Optimism ($OP) is currently trading at $1.82, once again testing its daily demand zone marked by a blue box between $1.6 and $1.8. This zone has acted as strong support for $OP in previous retracements, and its retest indicates significant buyer interest at this level.The asset recently made a local high of $2.19 on January 6th but has since retraced and broken below the 200 EMA on the daily timeframe, which is positioned at $1.96. The 200 EMA now acts as a medium-term resistance for $OP.
Analysis
Support levels
- $1.818: A strong support area within the daily demand zone. $OP is attempting to hold above this level after its recent pullback.
- Daily Demand Zone ($1.6 - $1.8): This blue box has consistently provided support and remains a critical accumulation area for $OP during market retracements.
Resistance levels
- $1.96 (200 EMA): Having broken below the 200 EMA, this level now serves as a significant resistance. A reclaim of this level will be pivotal for $OP’s bullish continuation.
- $2.19: The local high and the next resistance level to monitor after reclaiming the 200 EMA.
Price structure
$OP is moving within a well-defined range, with its daily demand zone acting as a base for potential reversals. If the price holds above $1.818, it sets the stage for recovery, with the first hurdle being the 200 EMA at $1.96. A break above this level would signal renewed bullish momentum.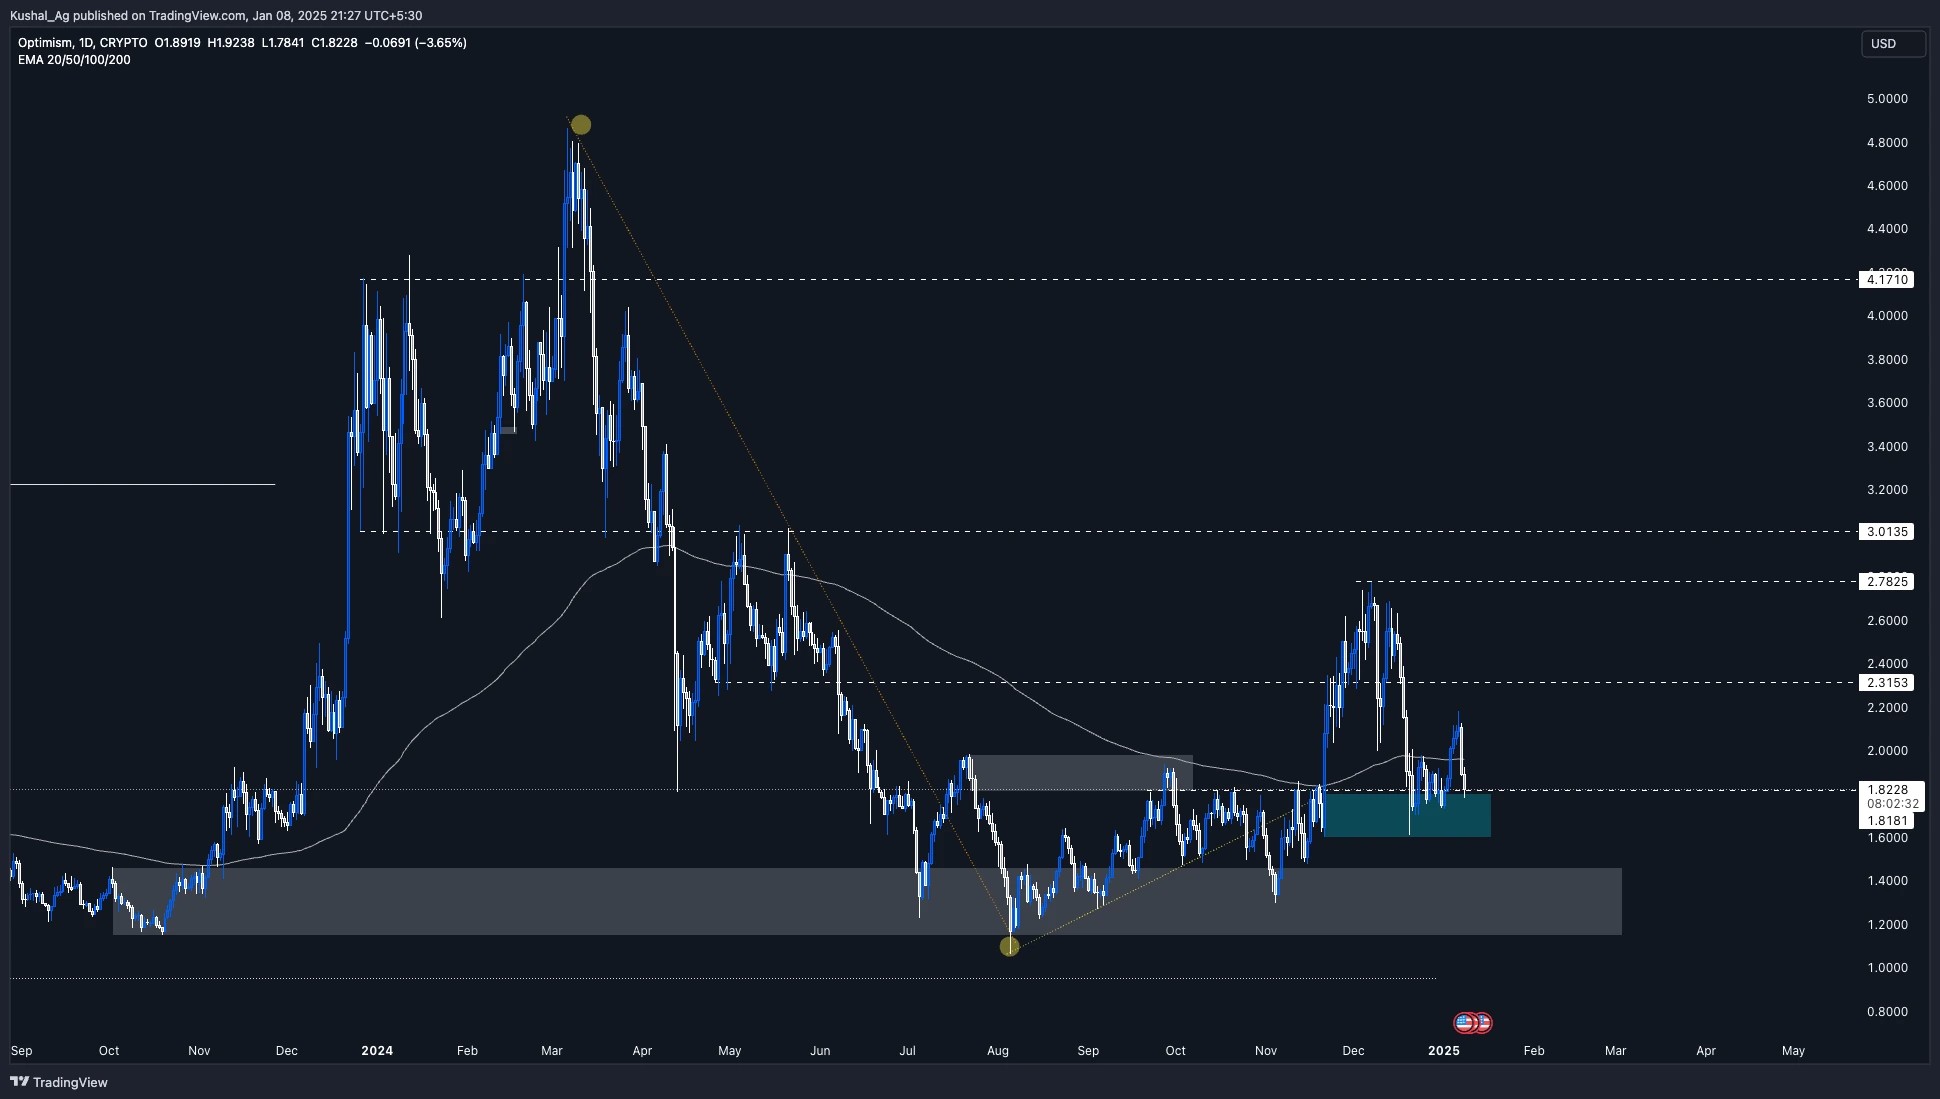
Cryptonary's take
Optimism ($OP) is testing its daily demand zone ($1.6 - $1.8) once again. While the break below the 200 EMA is a short-term bearish signal, the zone provides a solid foundation for buyers to step in.If $OP can hold above $1.818 and reclaim the 200 EMA at $1.96, it could regain bullish momentum, targeting $2.19 in the medium term. For now, the focus remains on whether the daily demand zone continues to hold, which would signal strength and provide opportunities for accumulation.
Optimism remains a technically significant asset, with its ability to reclaim the 200 EMA being a key factor in determining its next directional move.
Recommended from Cryptonary


