Save 23% ($351) & Get a Free 1-1 Call with our Team ⏰ : 0d 2h 59m 44s
Downside or more gains? | Mar 27th
The crypto market was rather slow last week, closing as a Doji (short body, long wicks) on the weekly timeframe. We’re confident the market will experience a pullback before heading to higher prices, and the charts reflect this sentiment! However, that doesn't change our target of $30,000+ in the short-term. The market is bullish, but it needs to take a step back, so it can take two steps forward after.

Friends, let’s dive in!
TLDR
- The Total Market Cap tested $1.18T as resistance last week, but failed to close above it. This further increases the odds of a pullback to $1.03T.
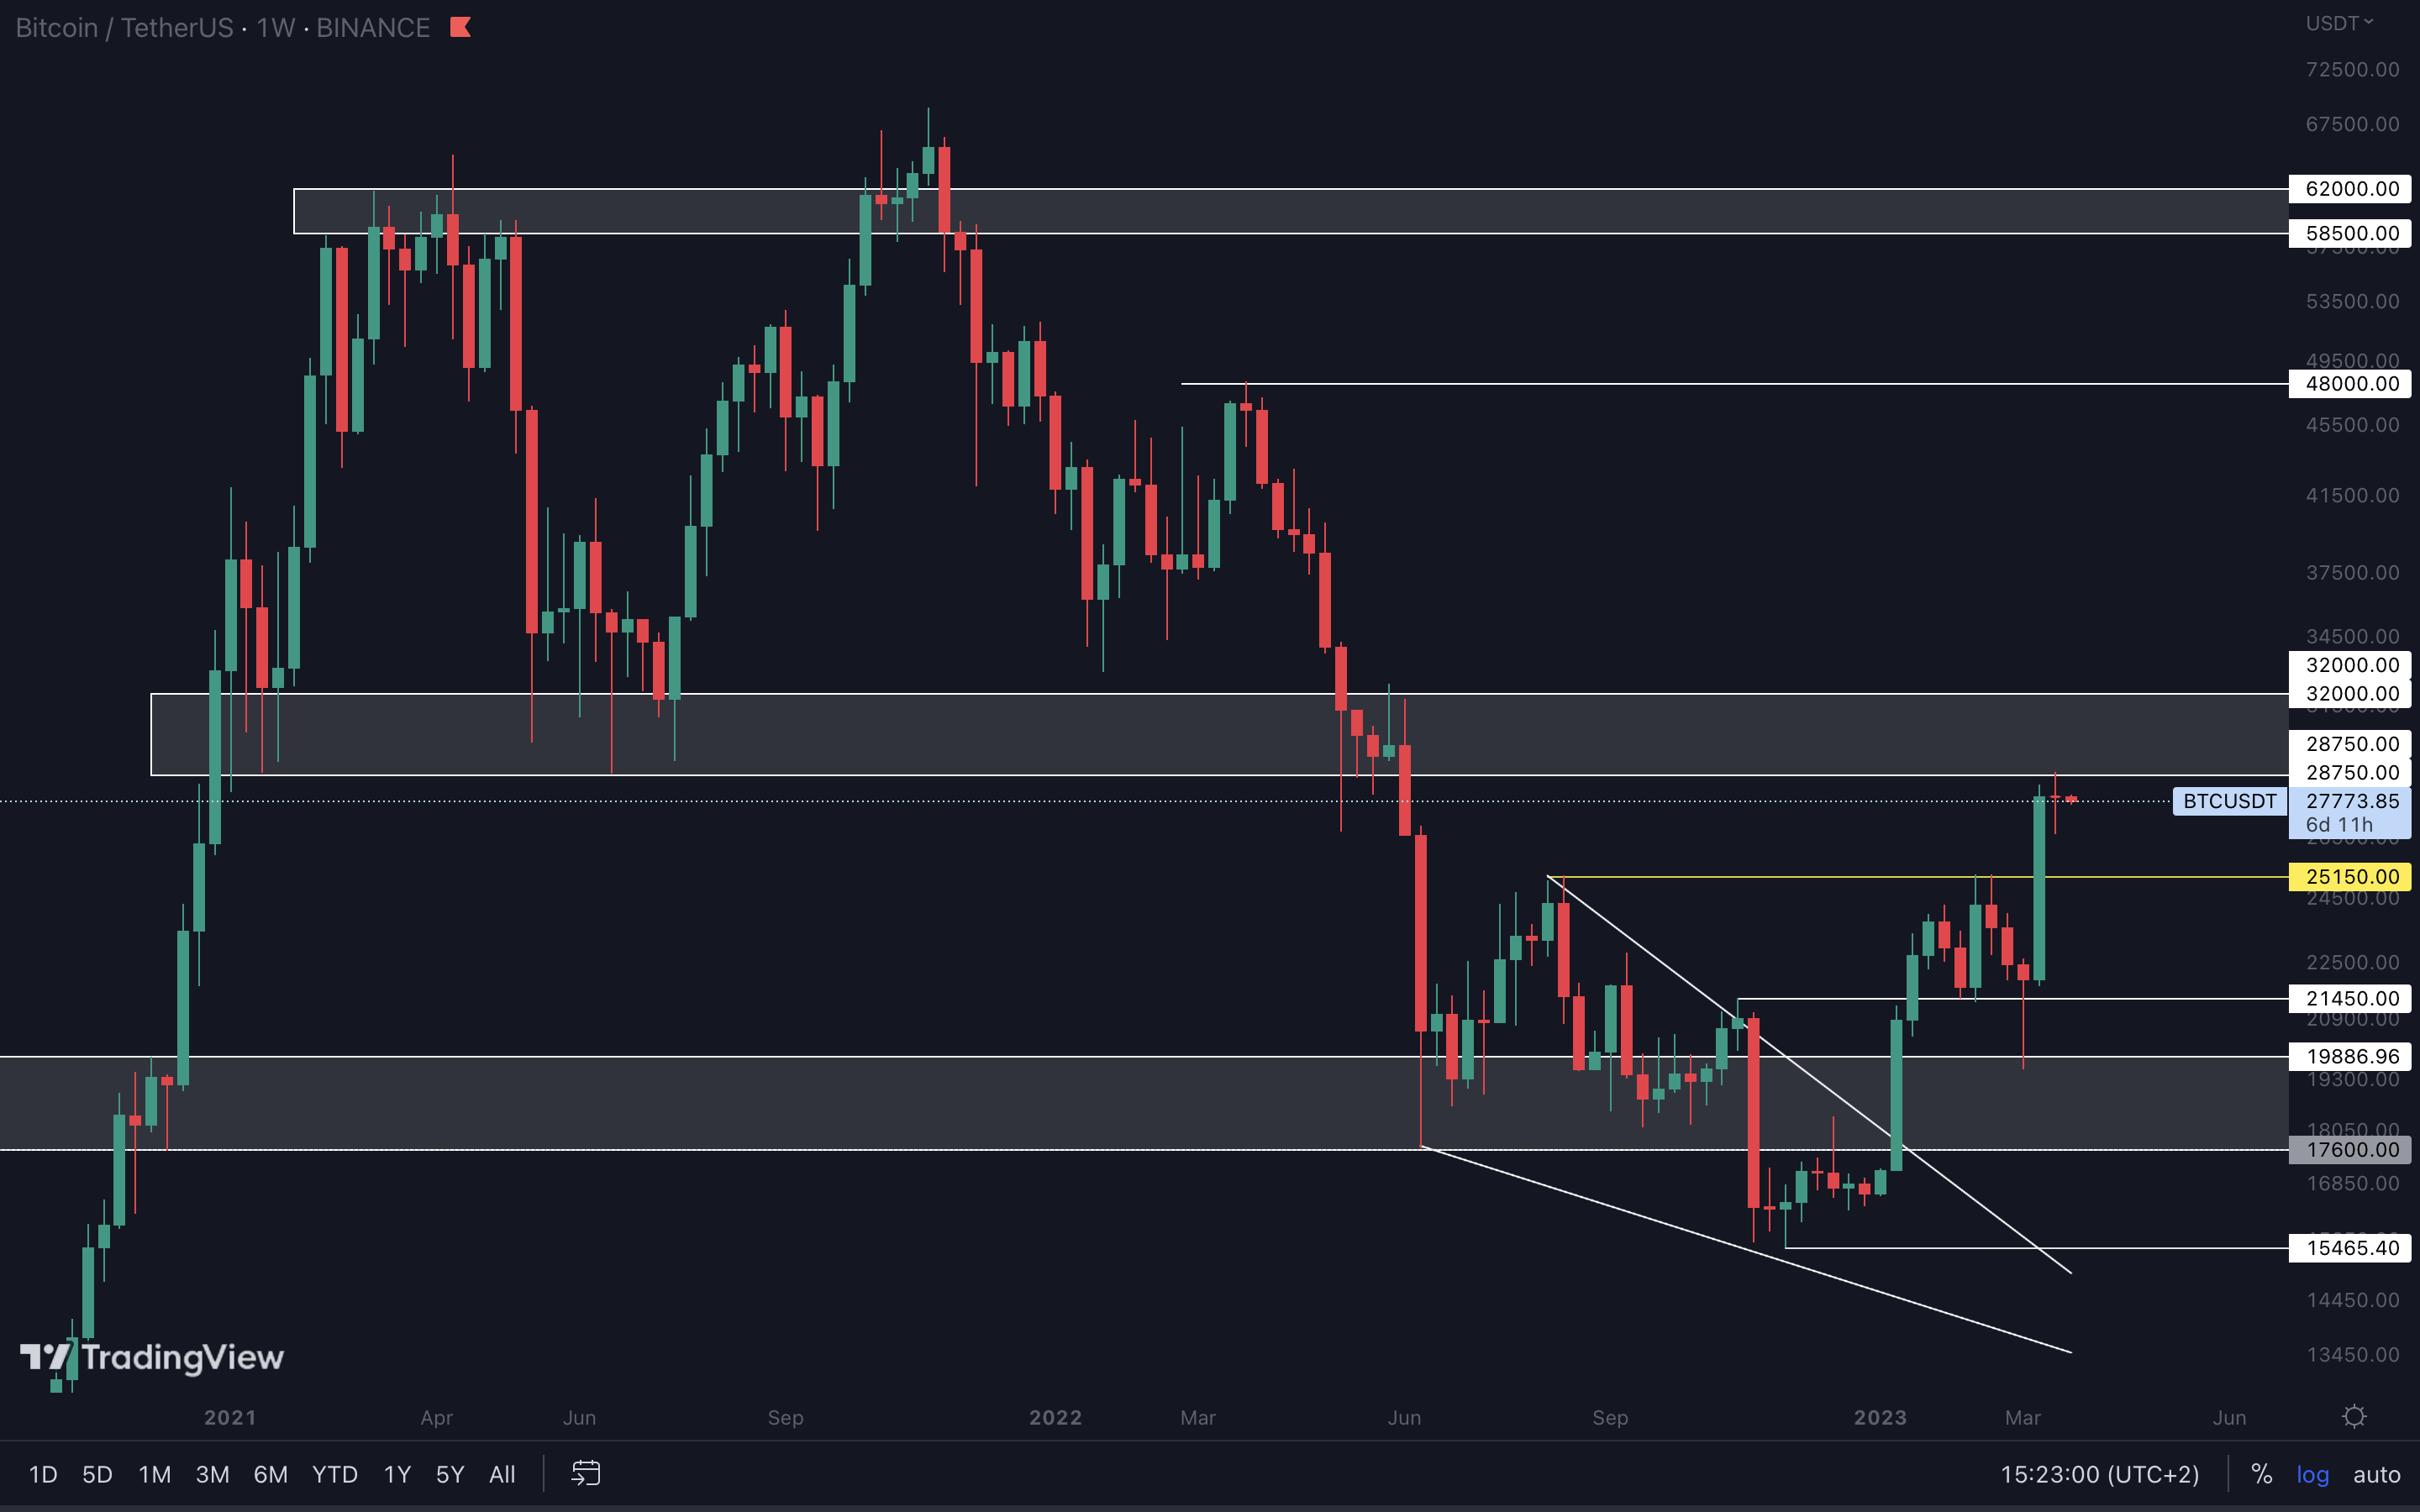
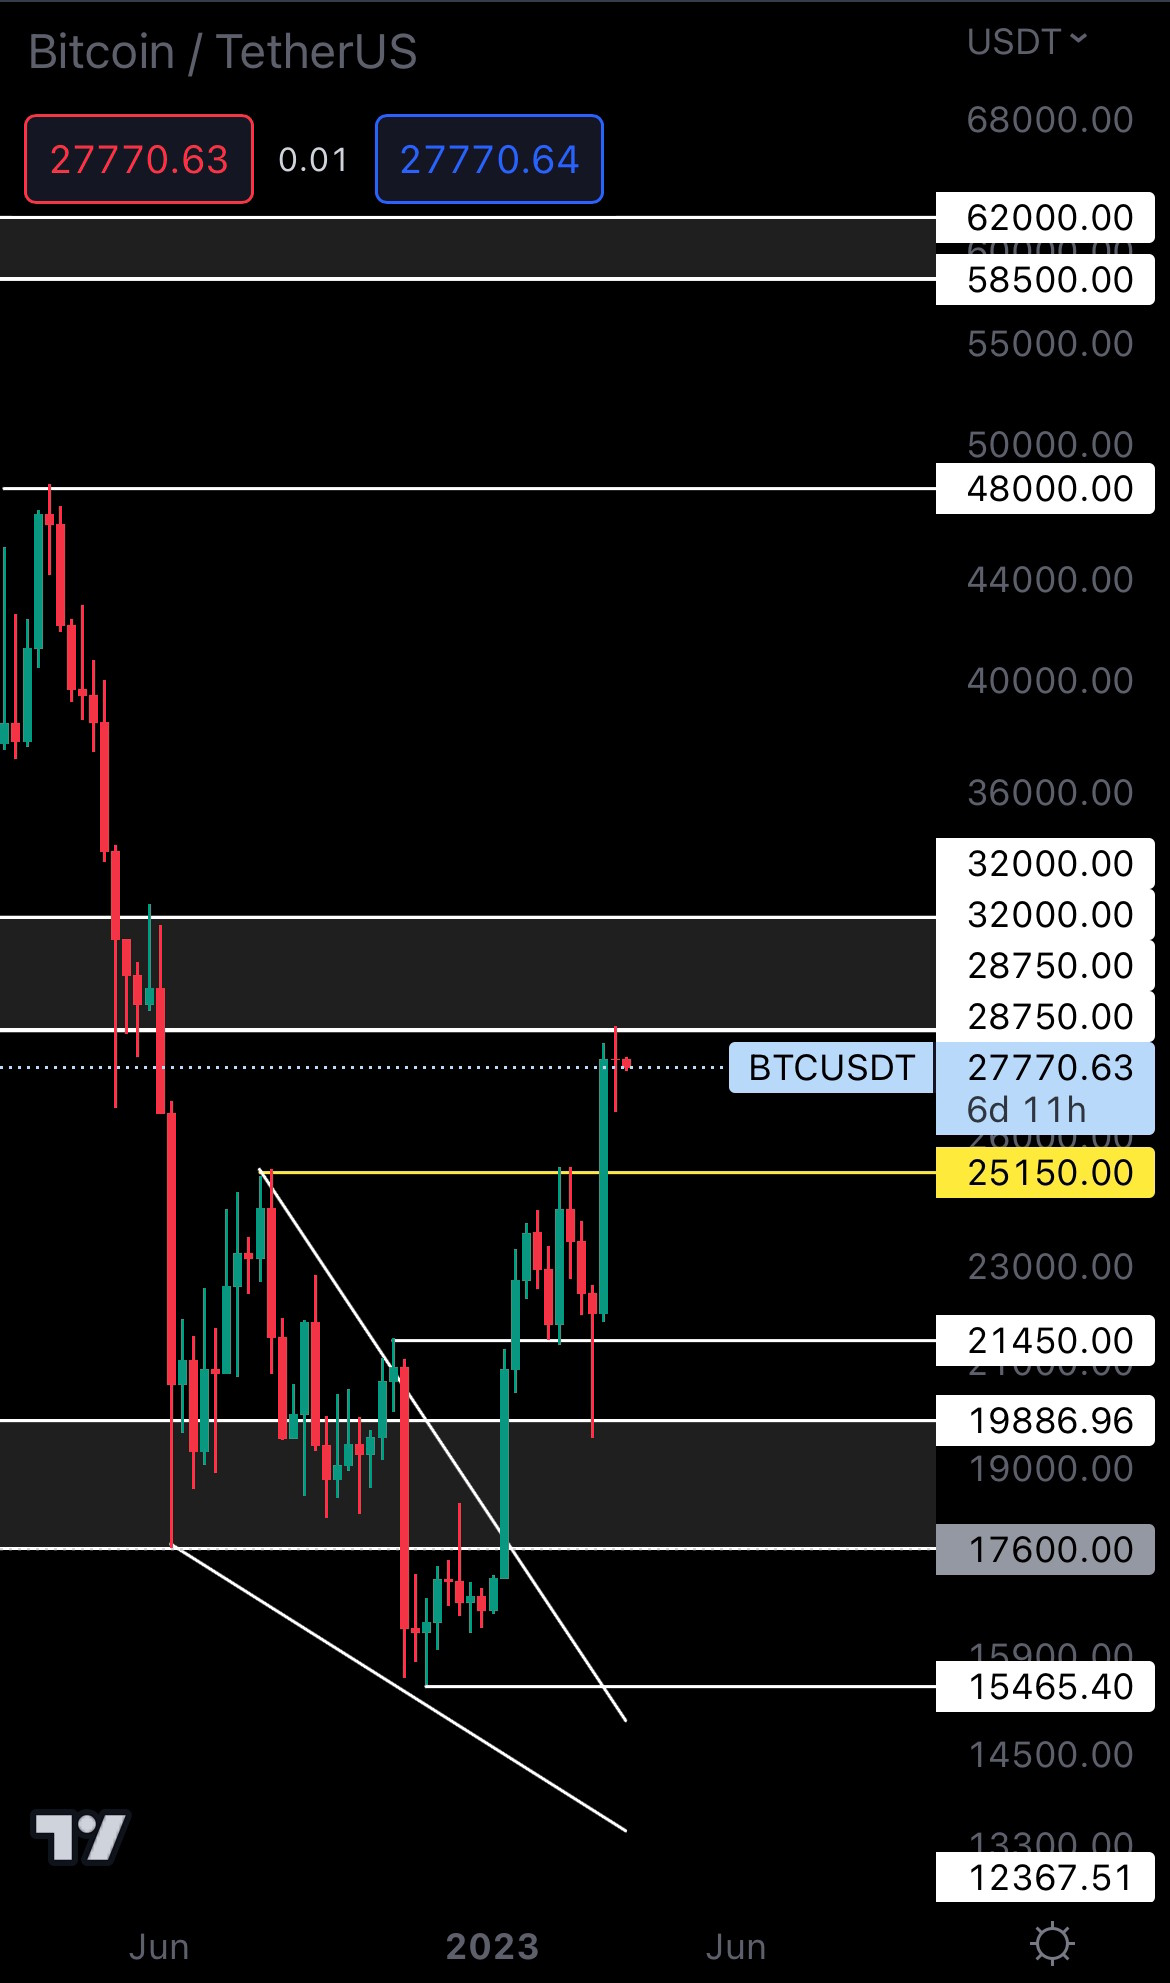
- Bitcoin was unable to break $28,750. Until it breaks this level, more downside can be expected.
- Ether closed last week’s candle above $1740, keeping the door open for $2000. However, this is not in line with BTC at resistance, so losing $1740 as support could be an easy task for Ether.
- RUNE closed under $1.43 on the weekly timeframe. From a technical standpoint, it’s now heading to $1.25.
- $2.50 was lost as support for SNX. Unless this level is reclaimed, we’re on track for $2.15.
- DYDX closed under support ($2.50). A weekly closure above it is necessary to prevent further downside.
- SYN, OP and THOR all lost their support levels last week. Downside can be expected.
Disclaimer: Not financial or investment advice. You are responsible for any capital-related decisions you make, and only you are accountable for the results.
Total Market Cap (Weekly)
The Total Market Cap index represents the entire cryptocurrency market. We track this index to understand where the market is now and predict where it will likely go next.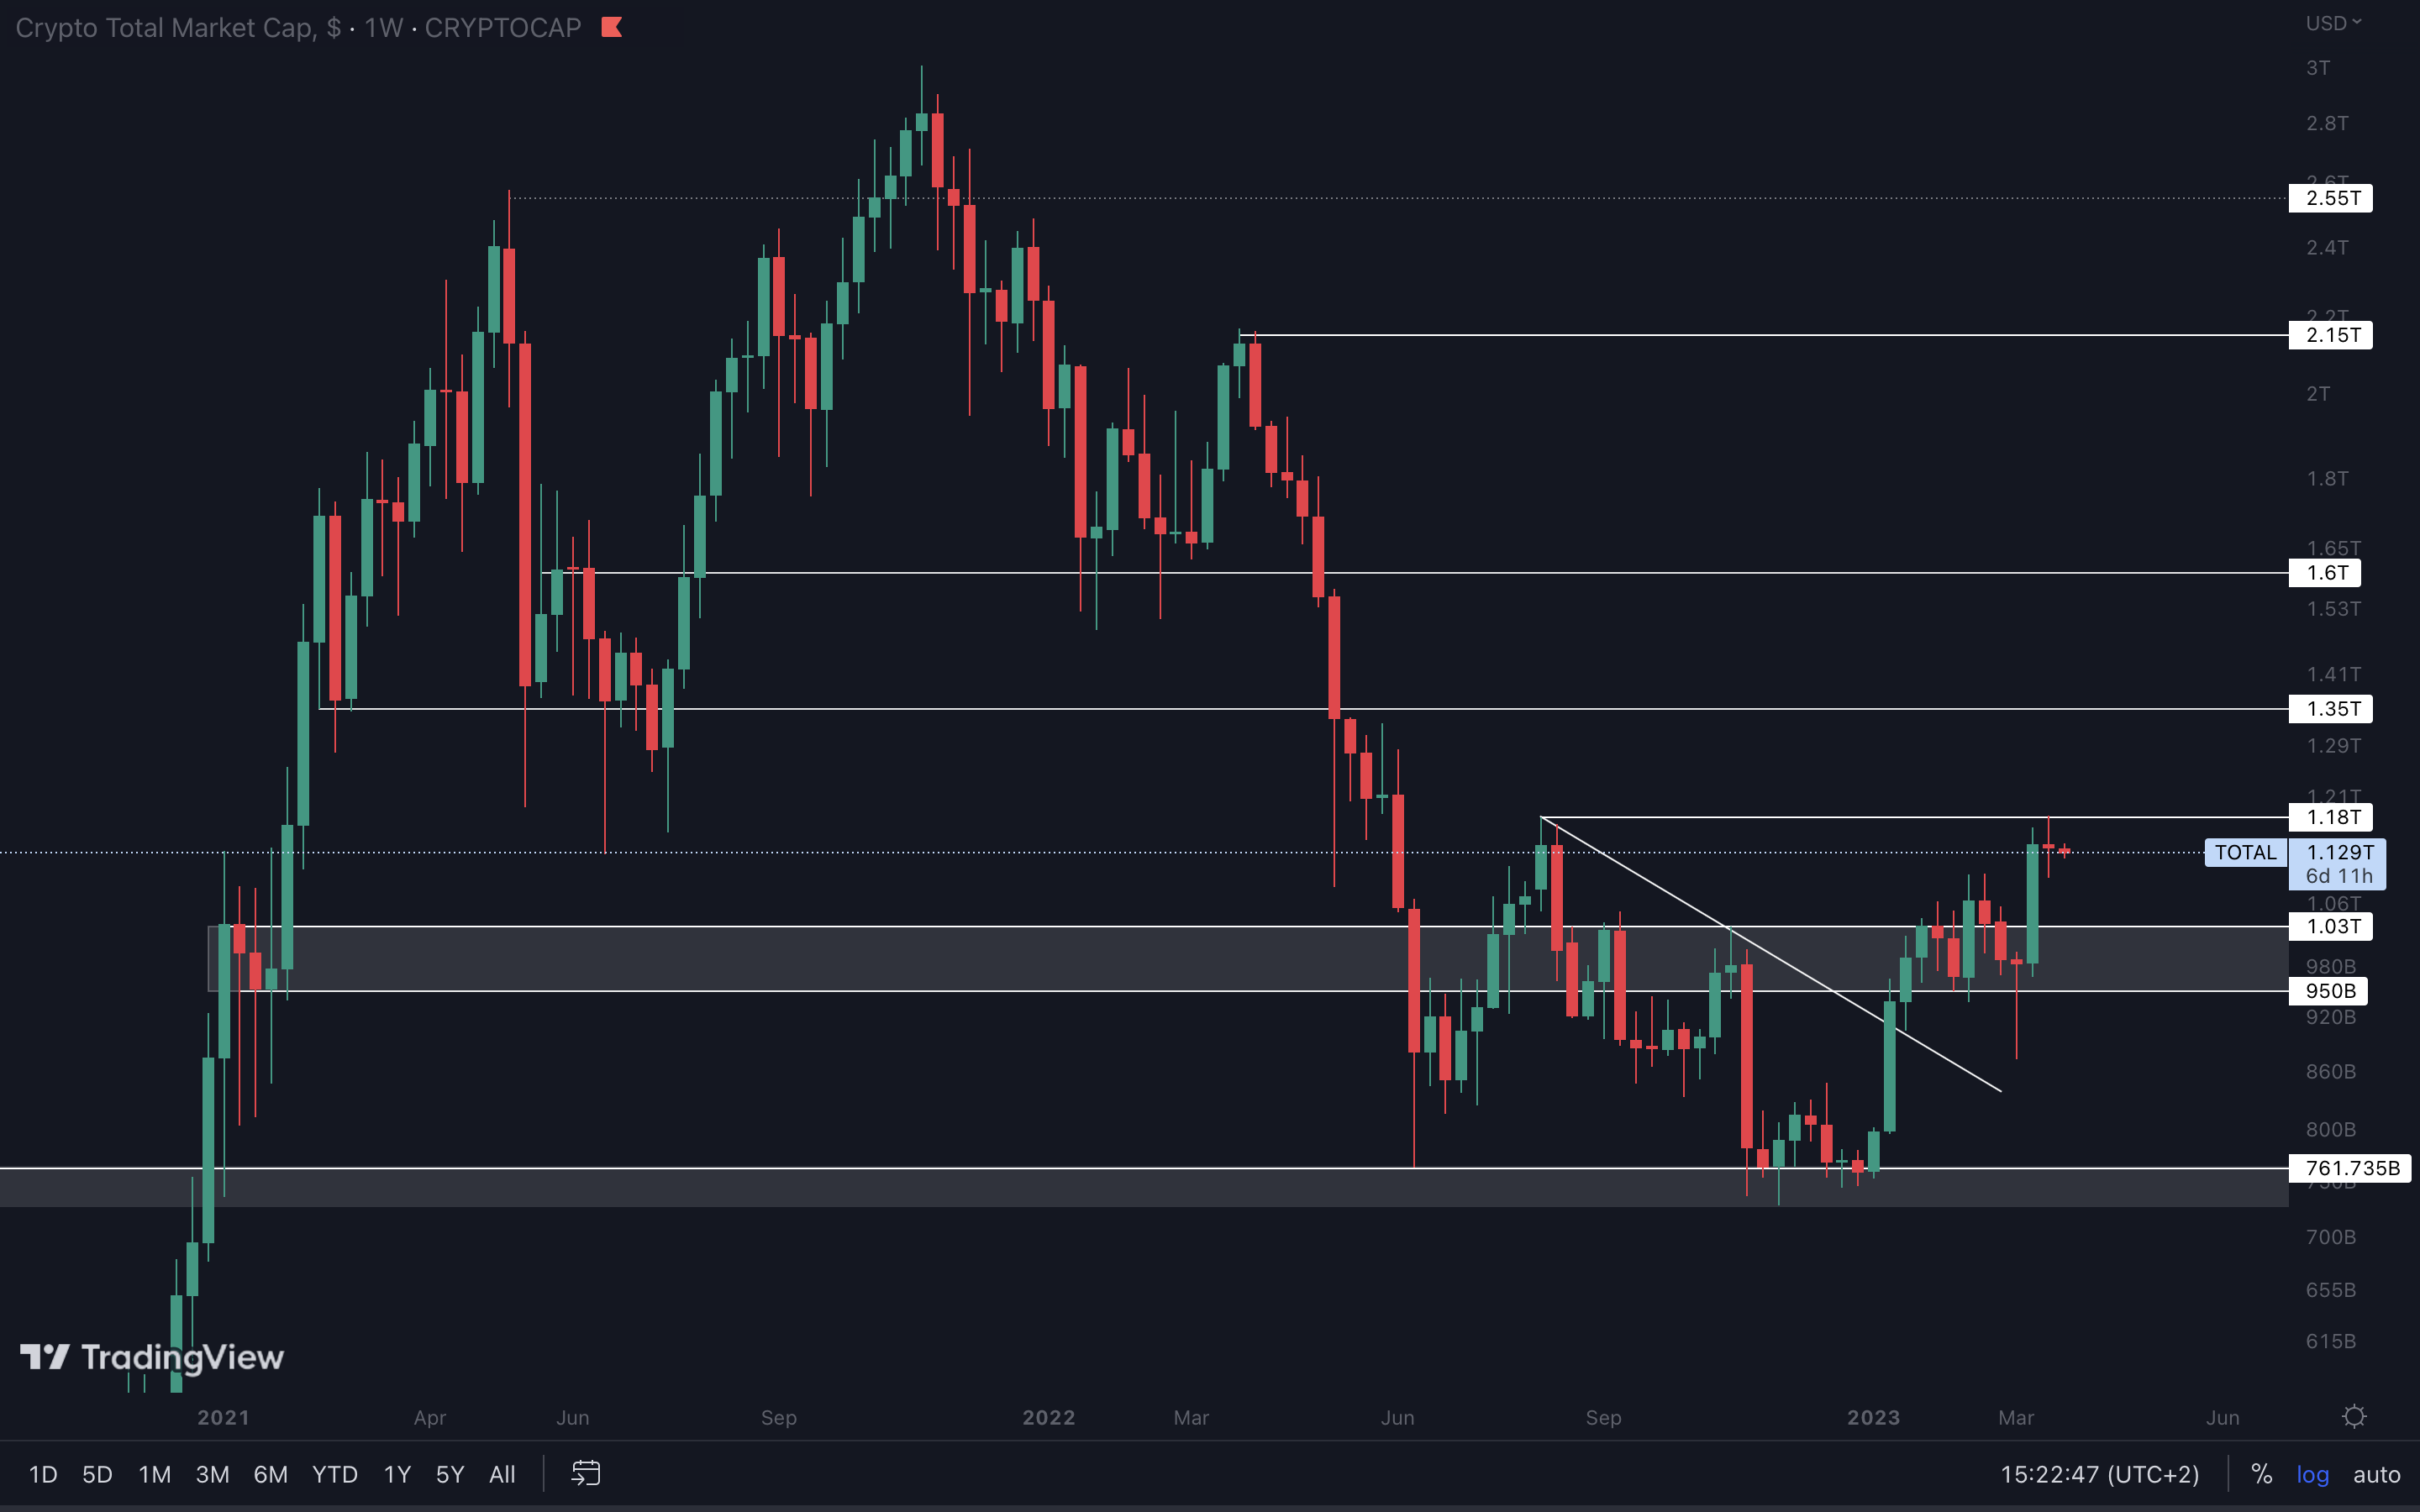
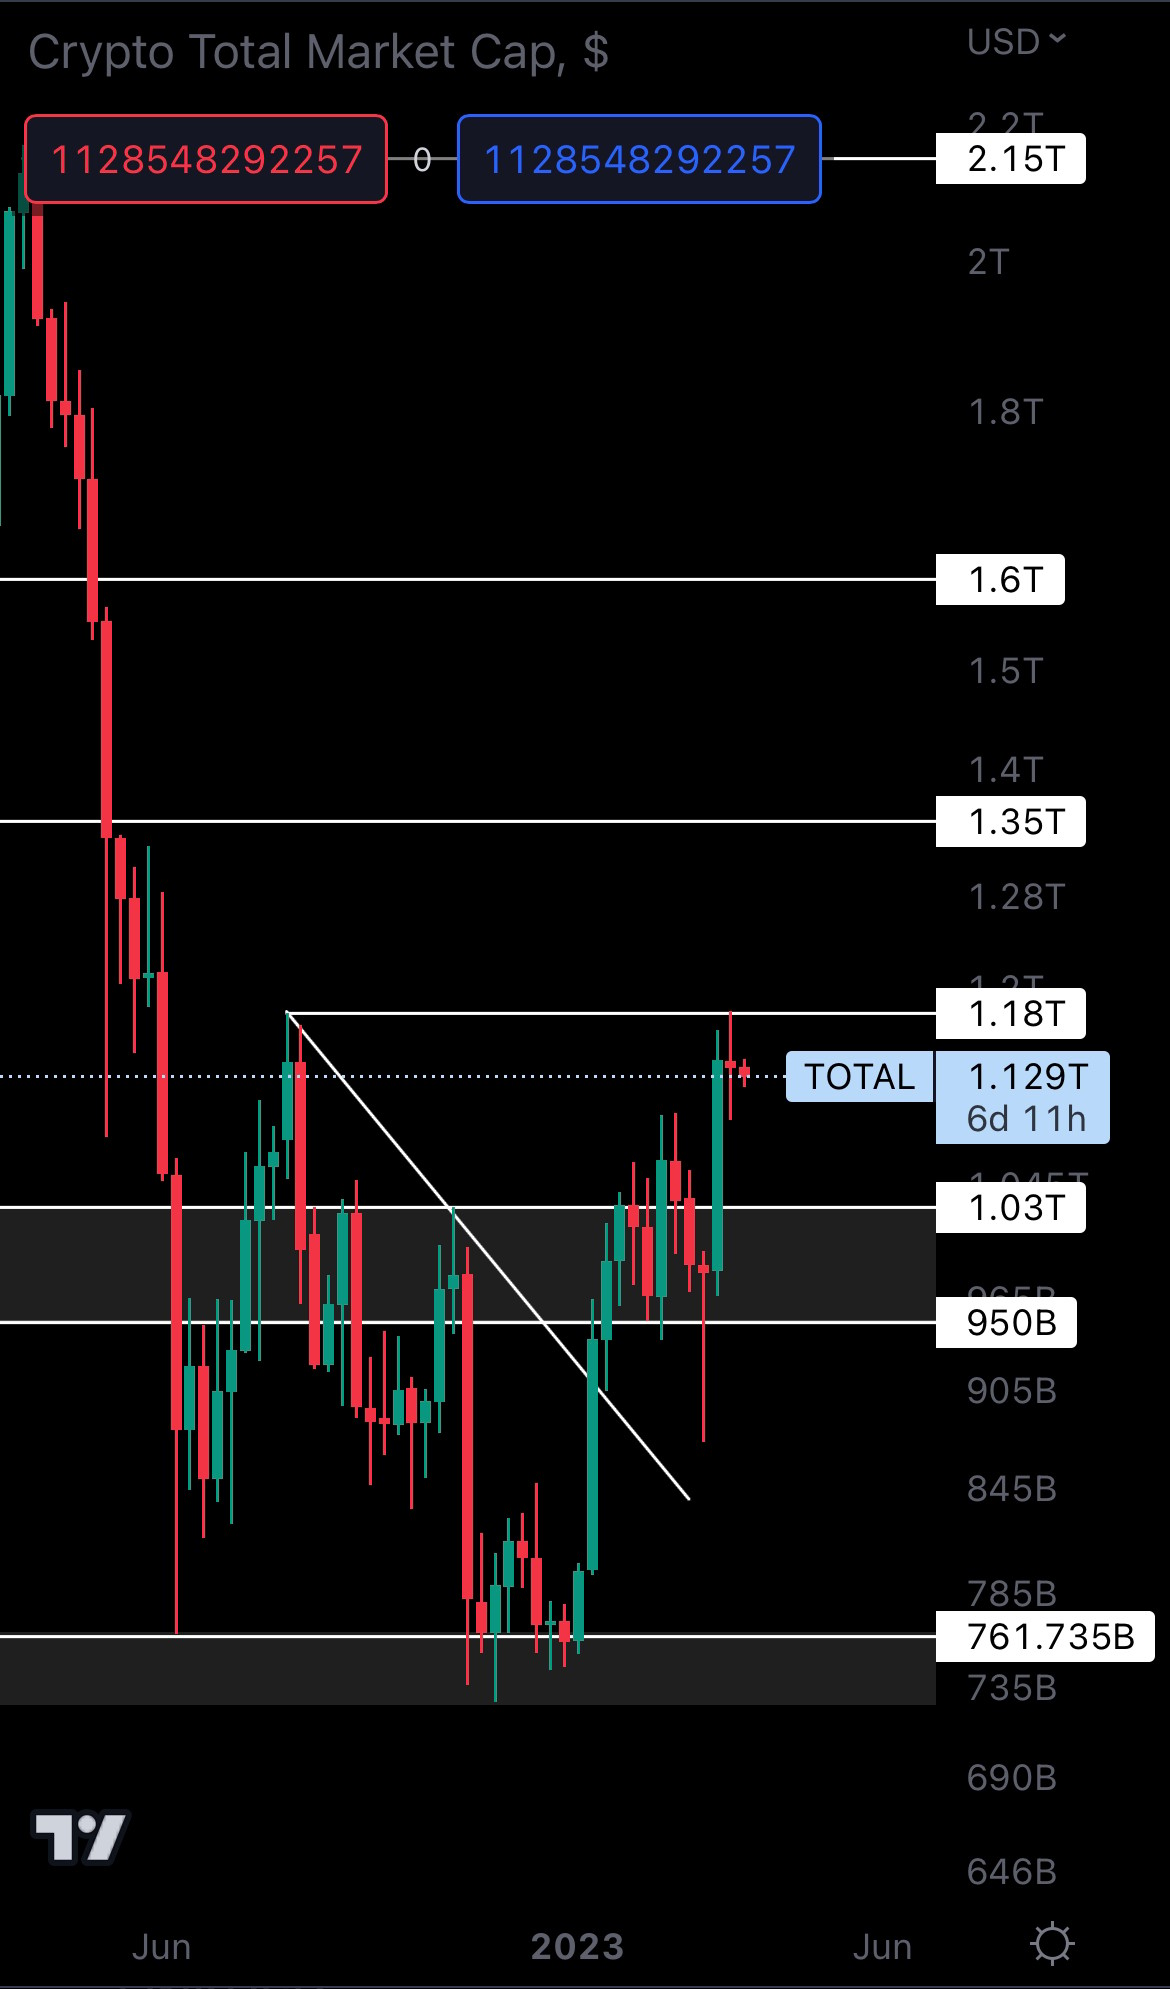
The market had a slow week, forming a Doji candle under resistance. Both buying and selling pressure reached a consolidation phase, which is common after a move like we saw two weeks ago. Now, the Total Market Cap index is under resistance. The longer we stay under, the bigger the odds of a pullback. For downside to be invalidated, we’ll have to see a weekly closure above $1.18T, which would open the door for $1.35T. We remain confident that the market will head to $1.03T before heading higher. This would be the healthier scenario as it would make room for more upside, and increase the odds of reaching higher levels like $1.35T.
Altcoins Market Cap (Weekly)
The Altcoins Market Cap index represents the entire evaluation of the altcoins market (all coins other than BTC).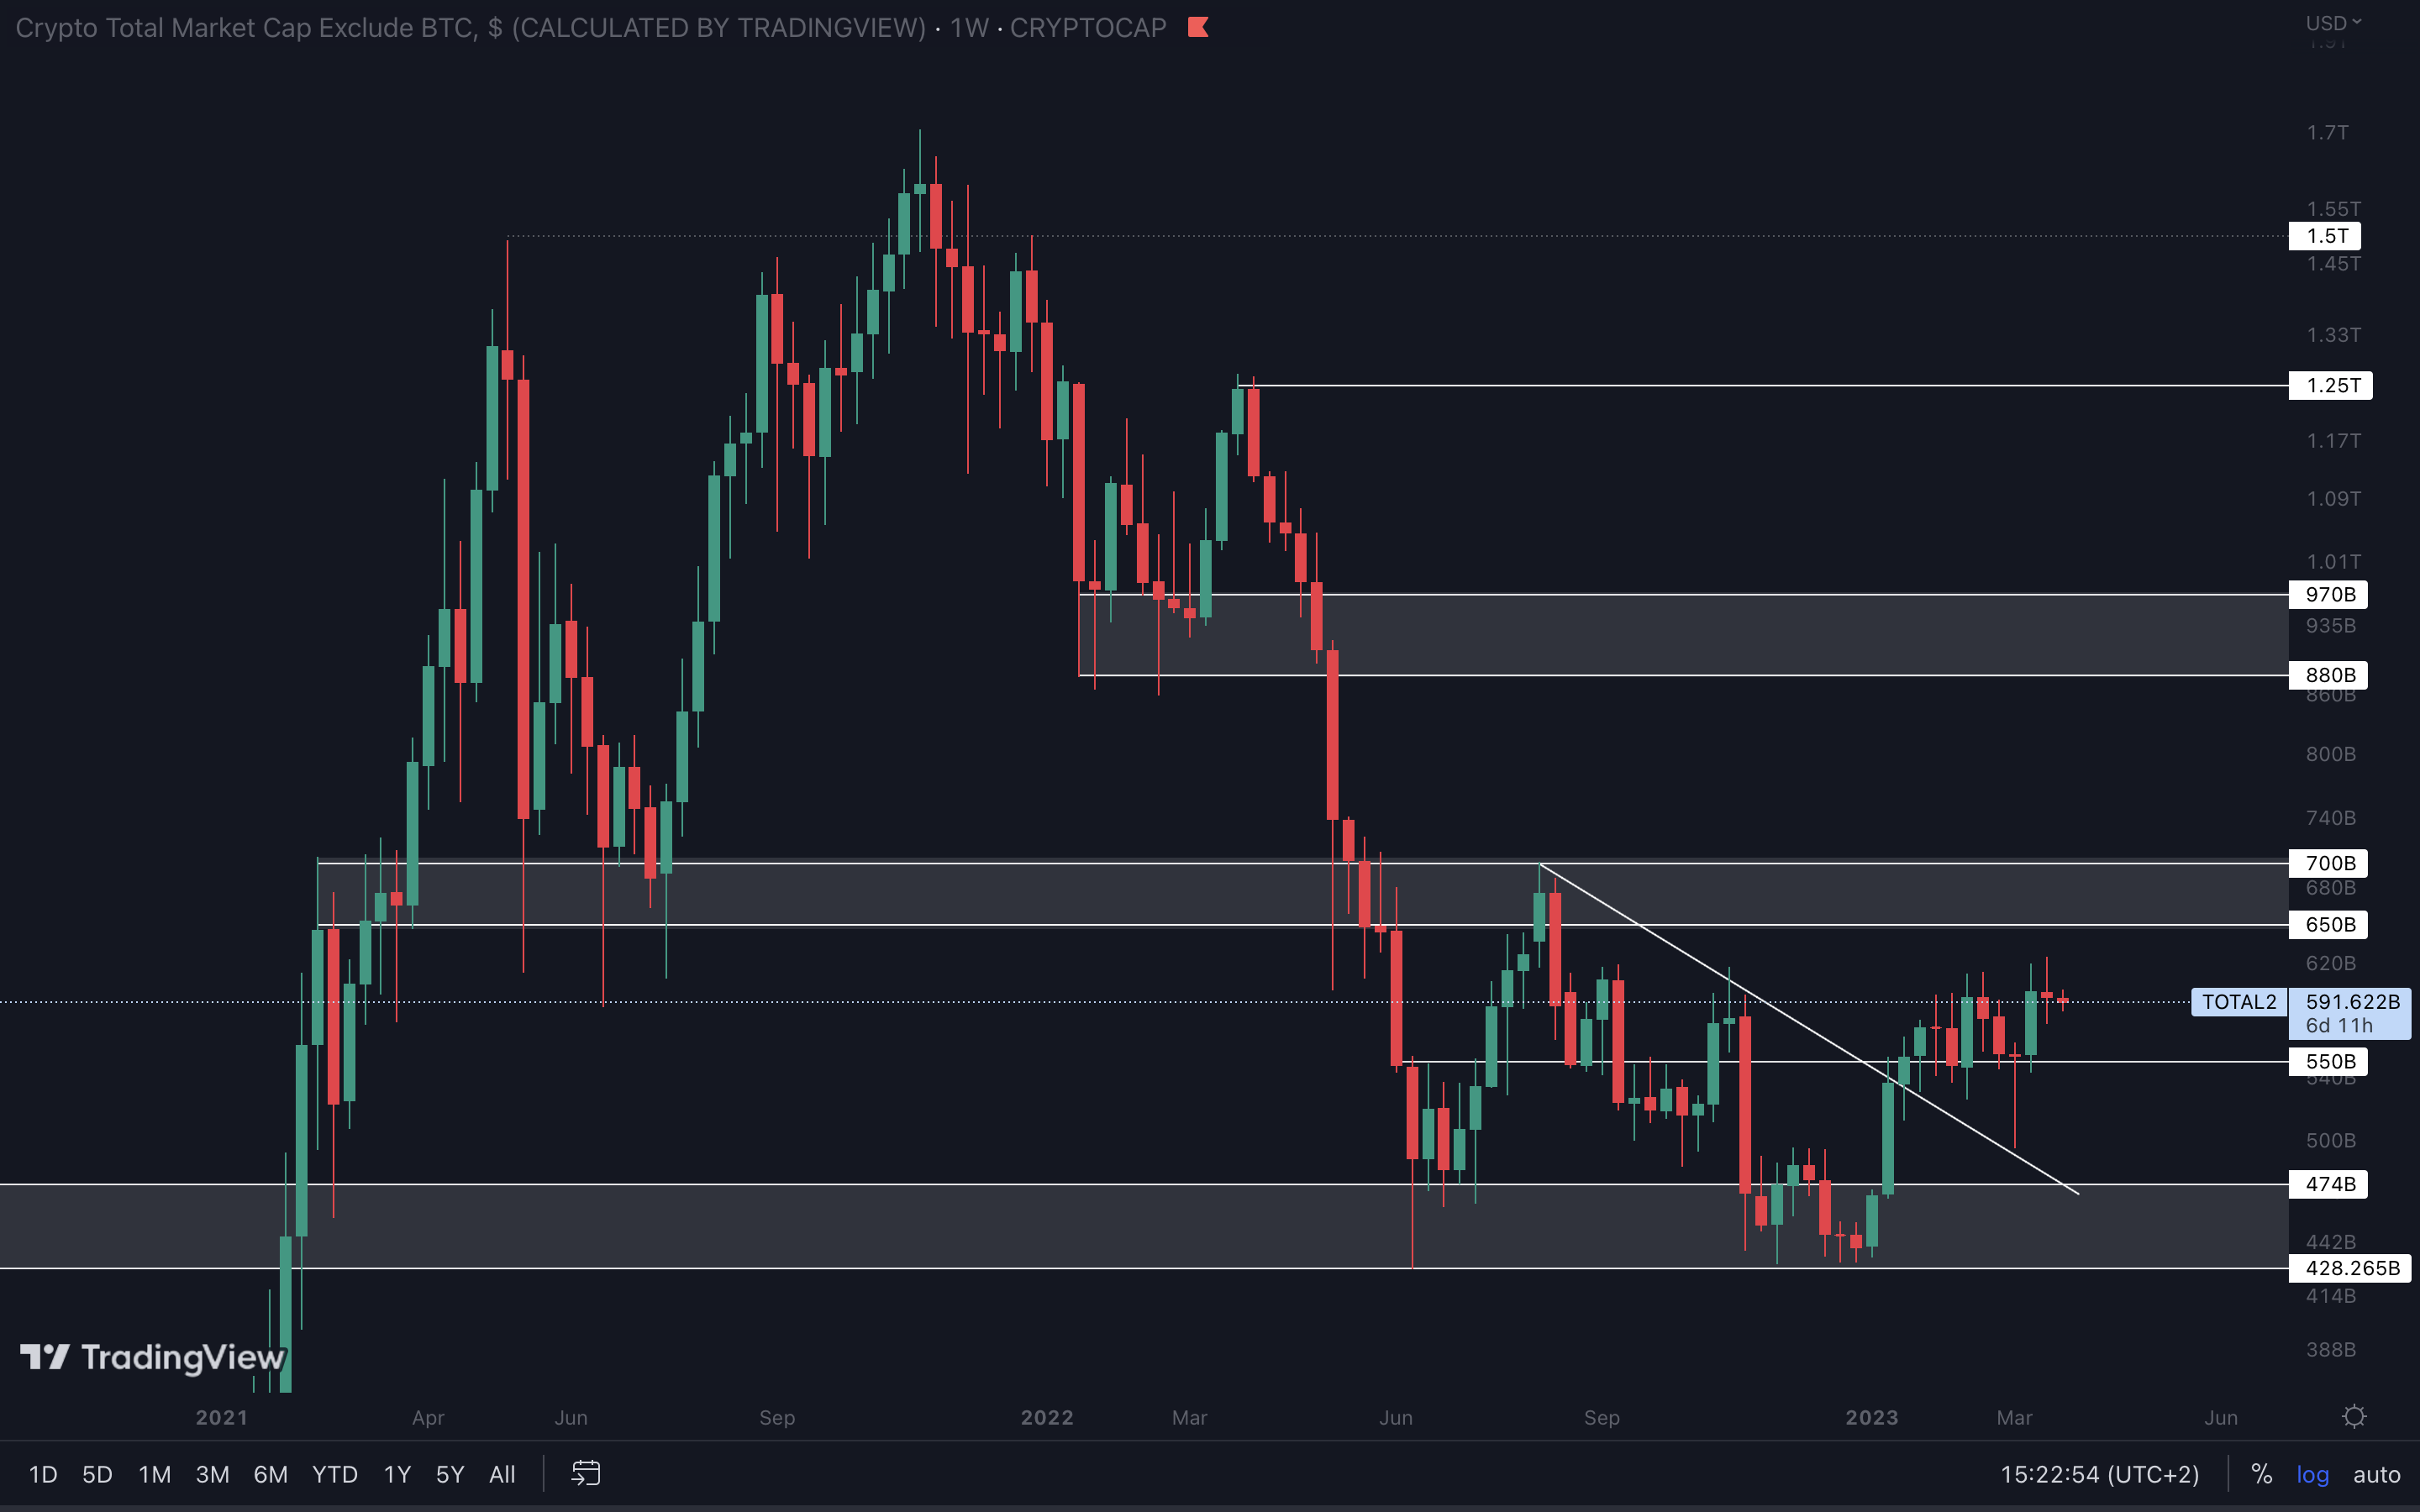
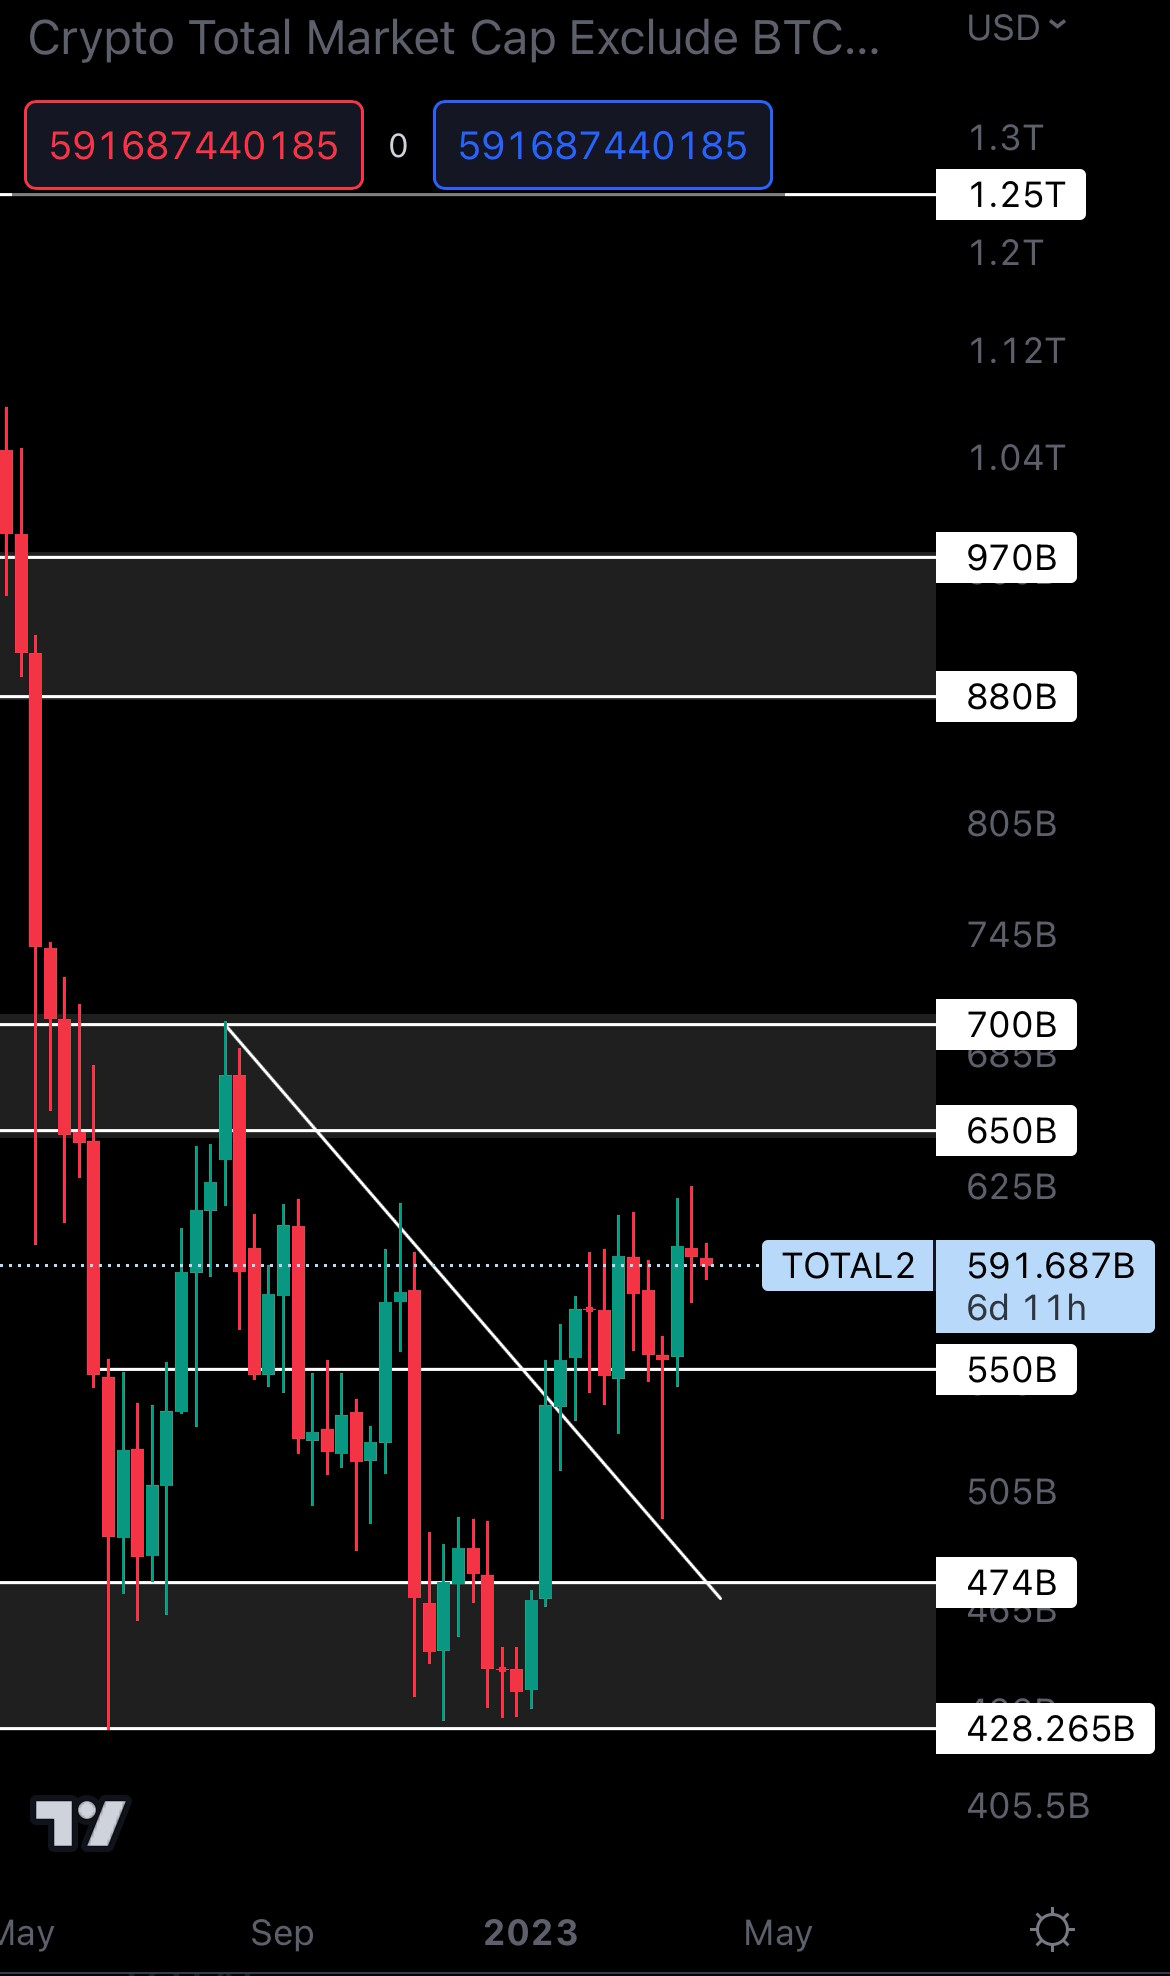
The Altcoins MCap is mirroring the Total MCap, so we should expect the altcoins market to retrace back to support ($550B) or at least head towards it. If the Total MCap breaks above $1.18T, the Altcoins MCap will continue to rise to the $650B - $700B resistance area.
Cryptonary's Watchlist
BTC | Bitcoin (Weekly)
ETH | Ethereum (Weekly)
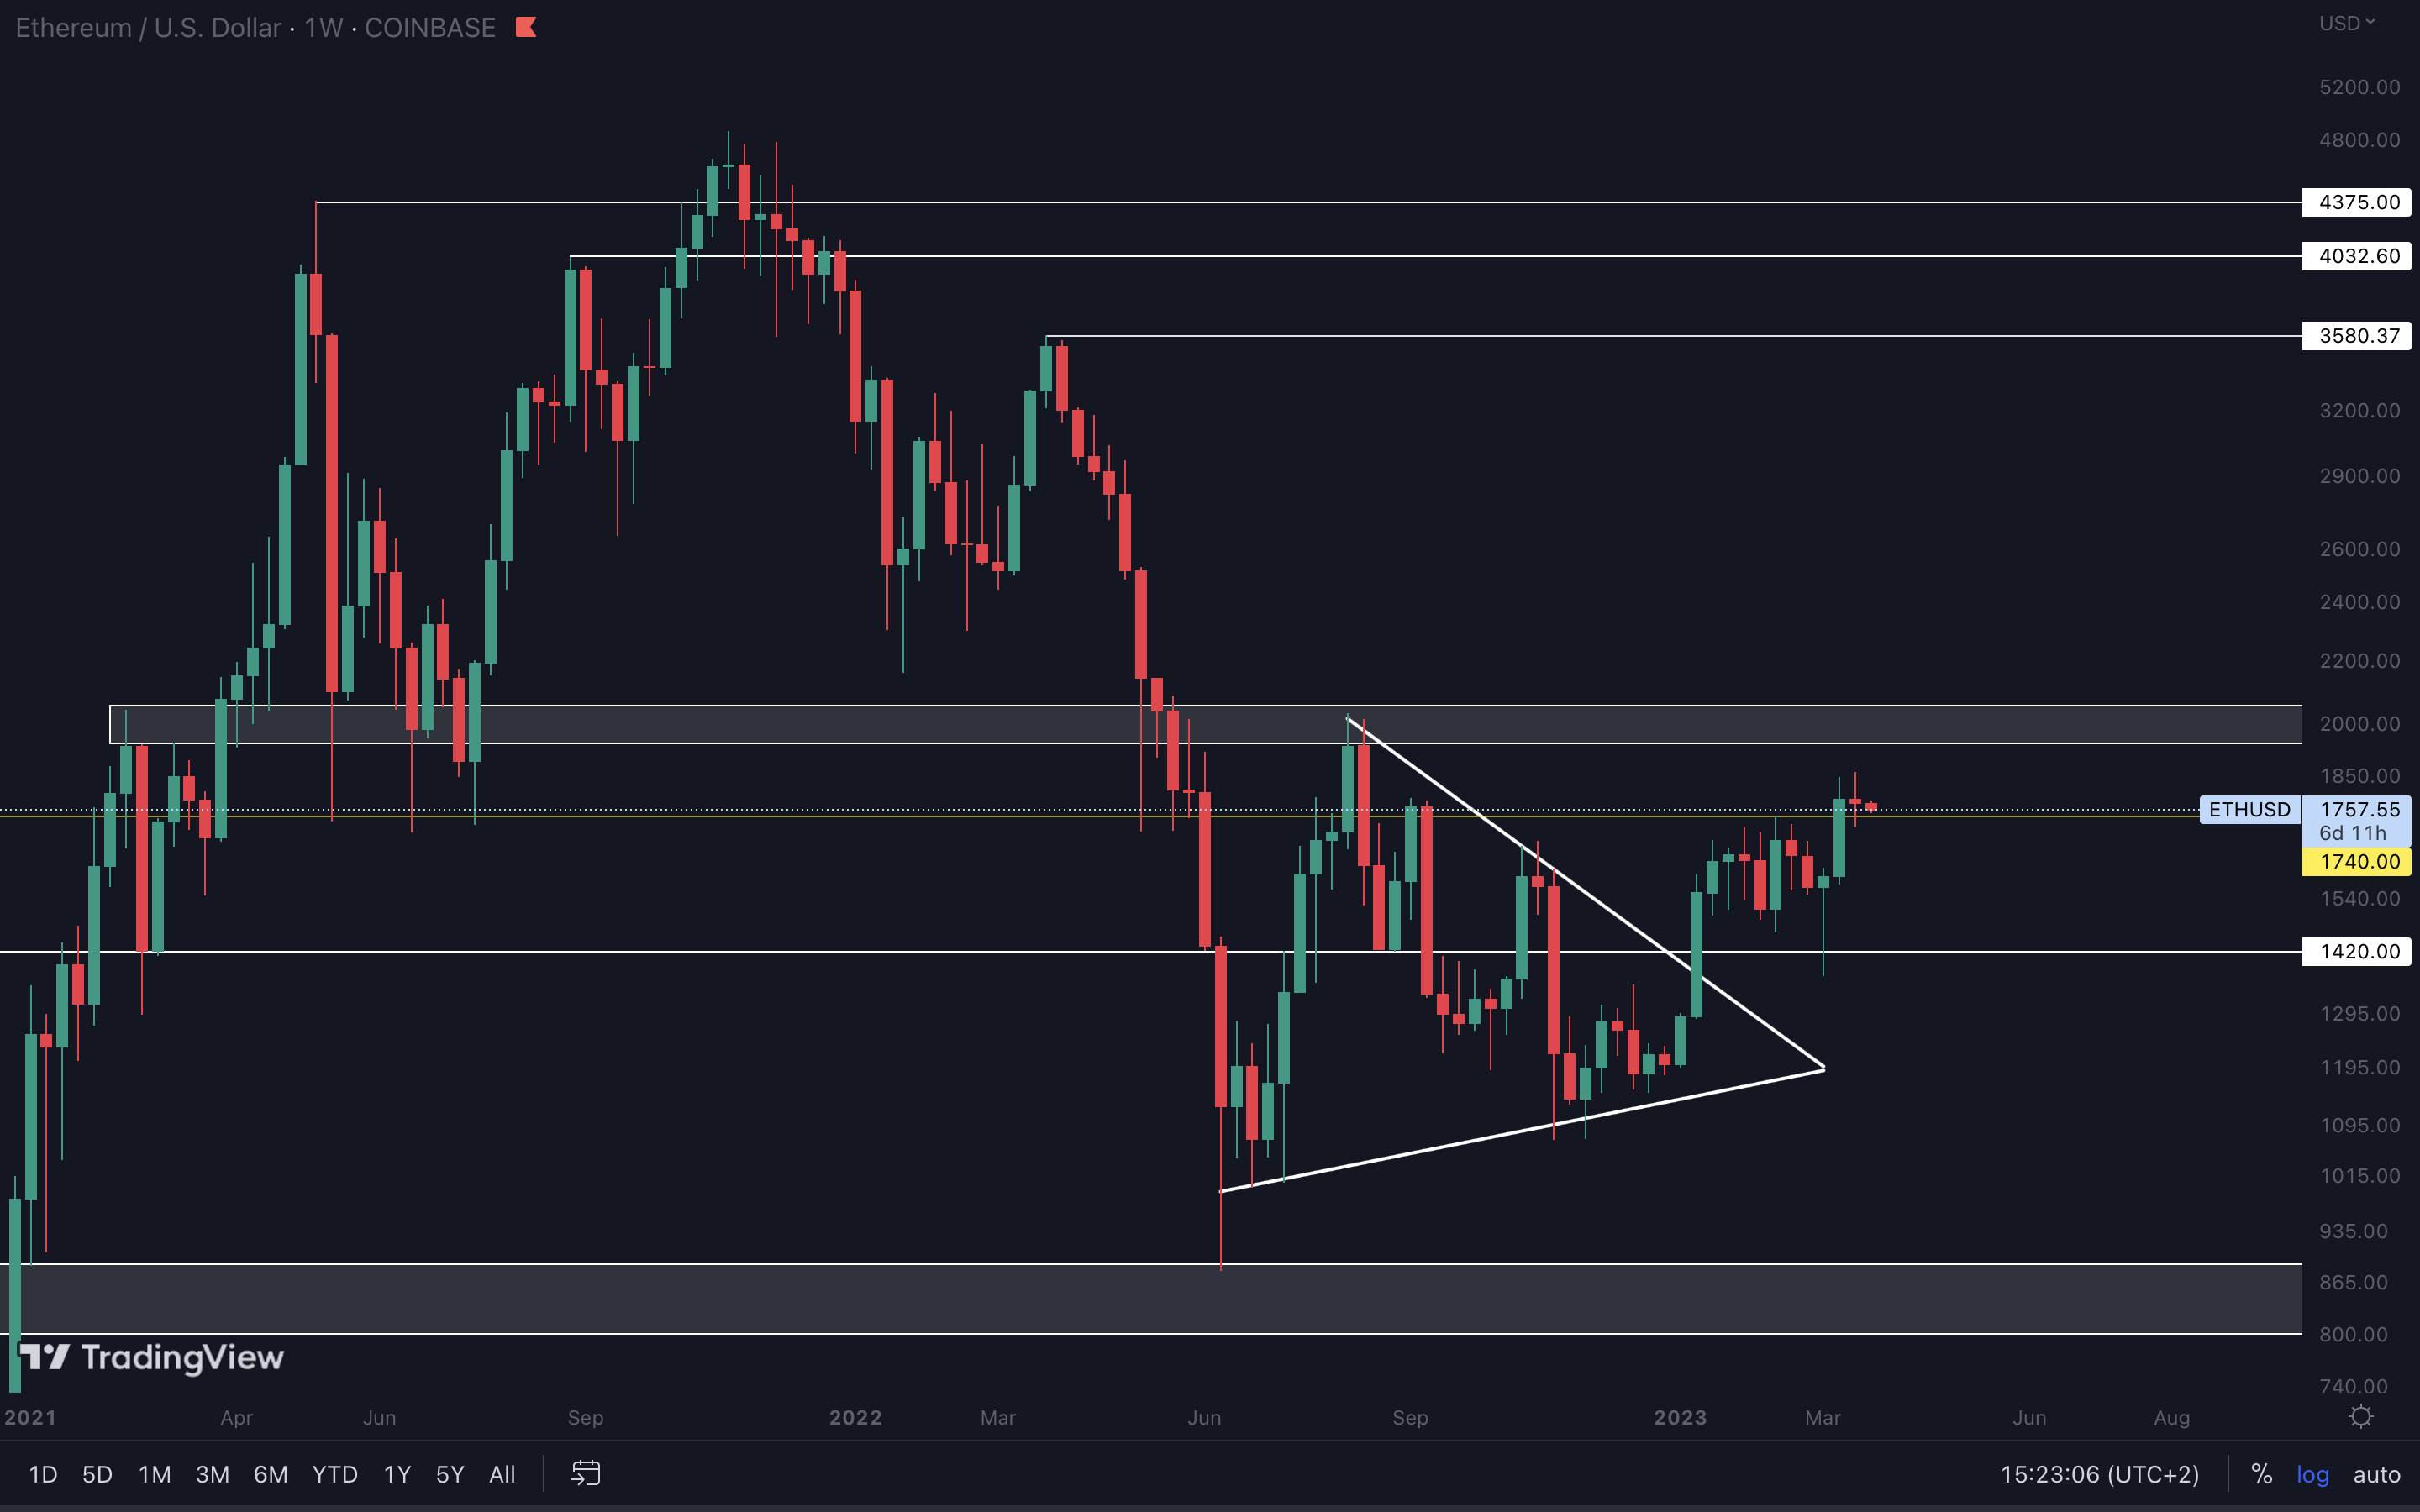
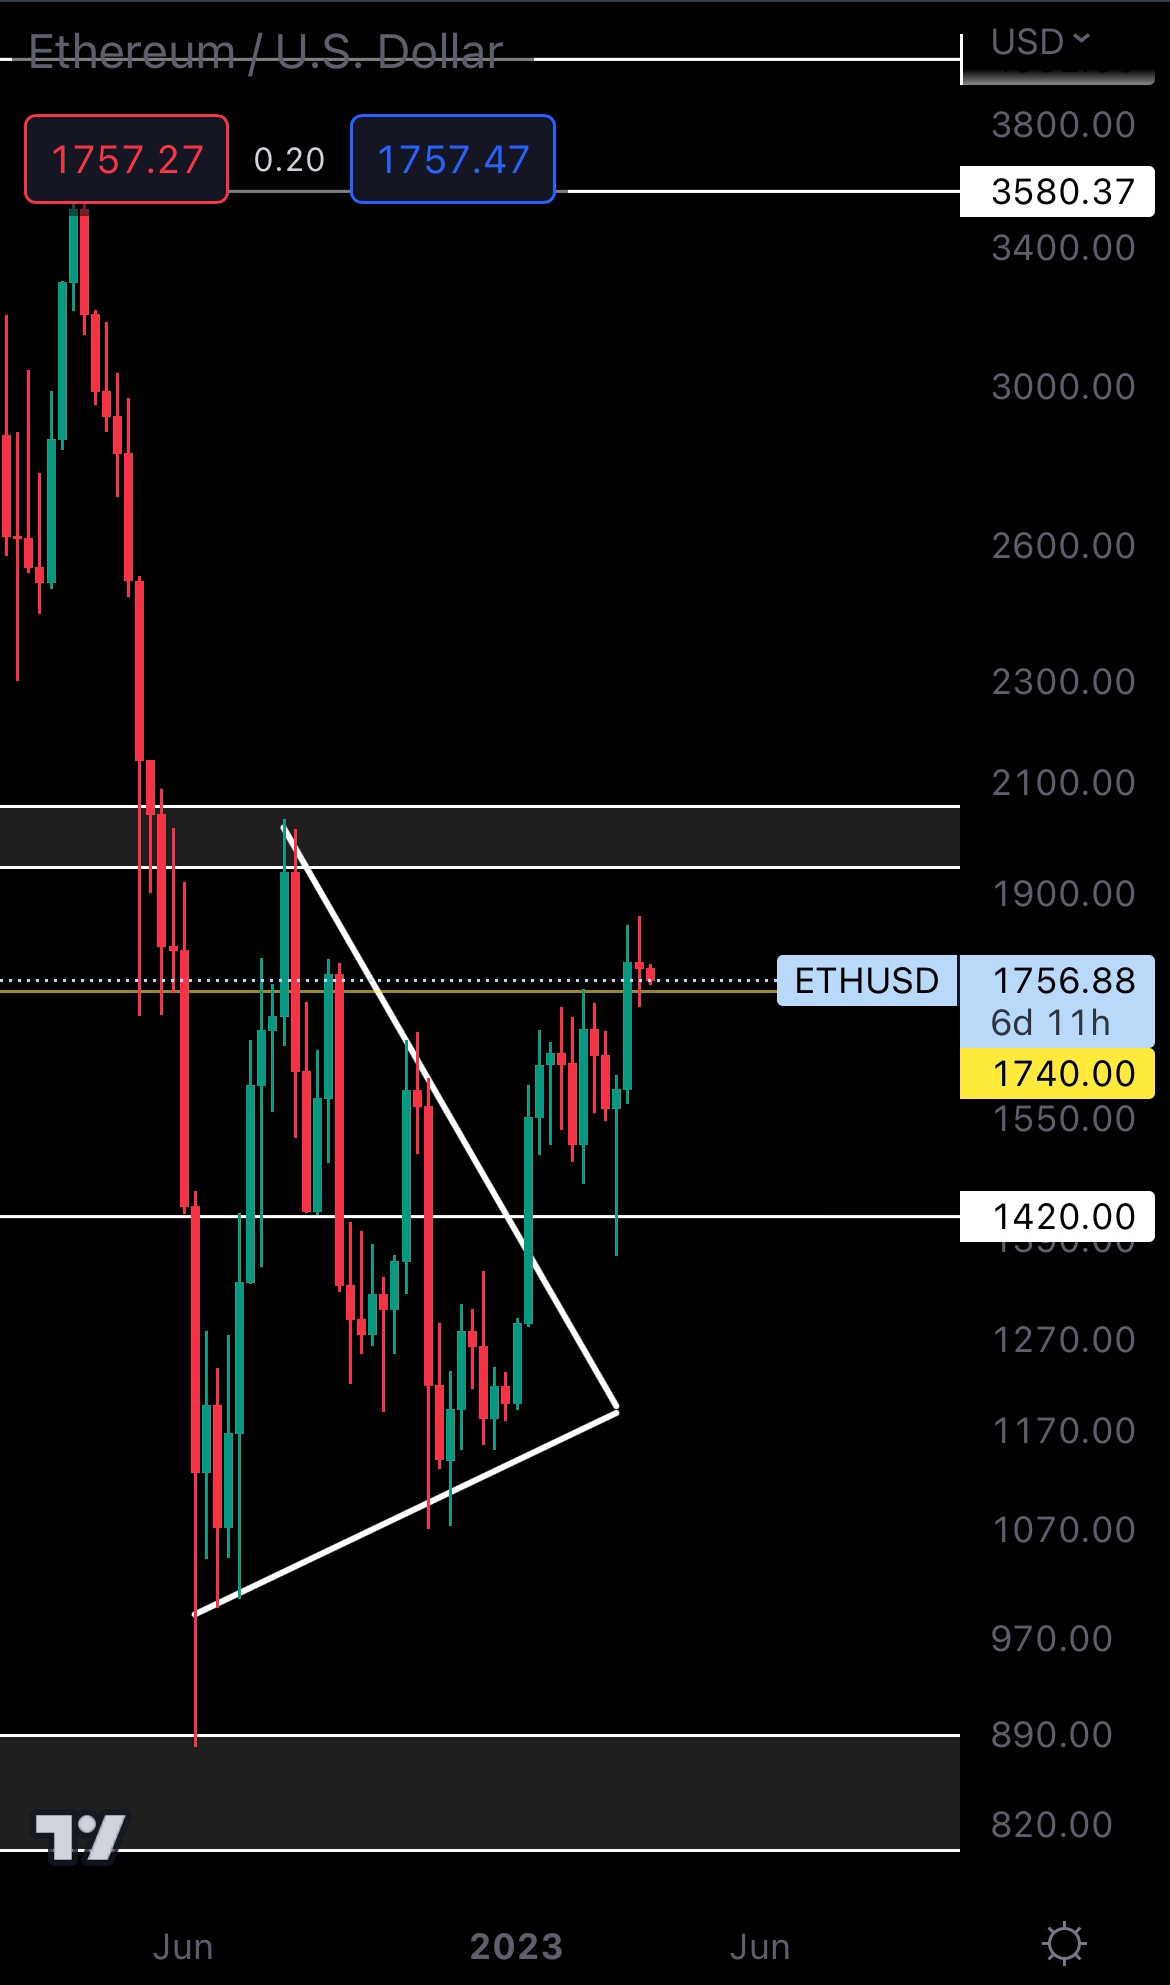
This is where it gets contradictory… Bitcoin is at resistance, while Ether is at support. The majors are countering each other, which only makes it more difficult for us to understand where we’re going. The one thing we know for sure is that where Bitcoin goes, everything eventually follows, and Ether is no different. Bitcoin heading lower would result in Ether losing $1740 as support, so we don’t recommend jumping on this just yet. For the above to be validated, Ether would have to close a weekly candle under $1740. However, if the market continues to rise, Ether holding support would keep $2000 on the cards.
DYDX | dYdX (Weekly)
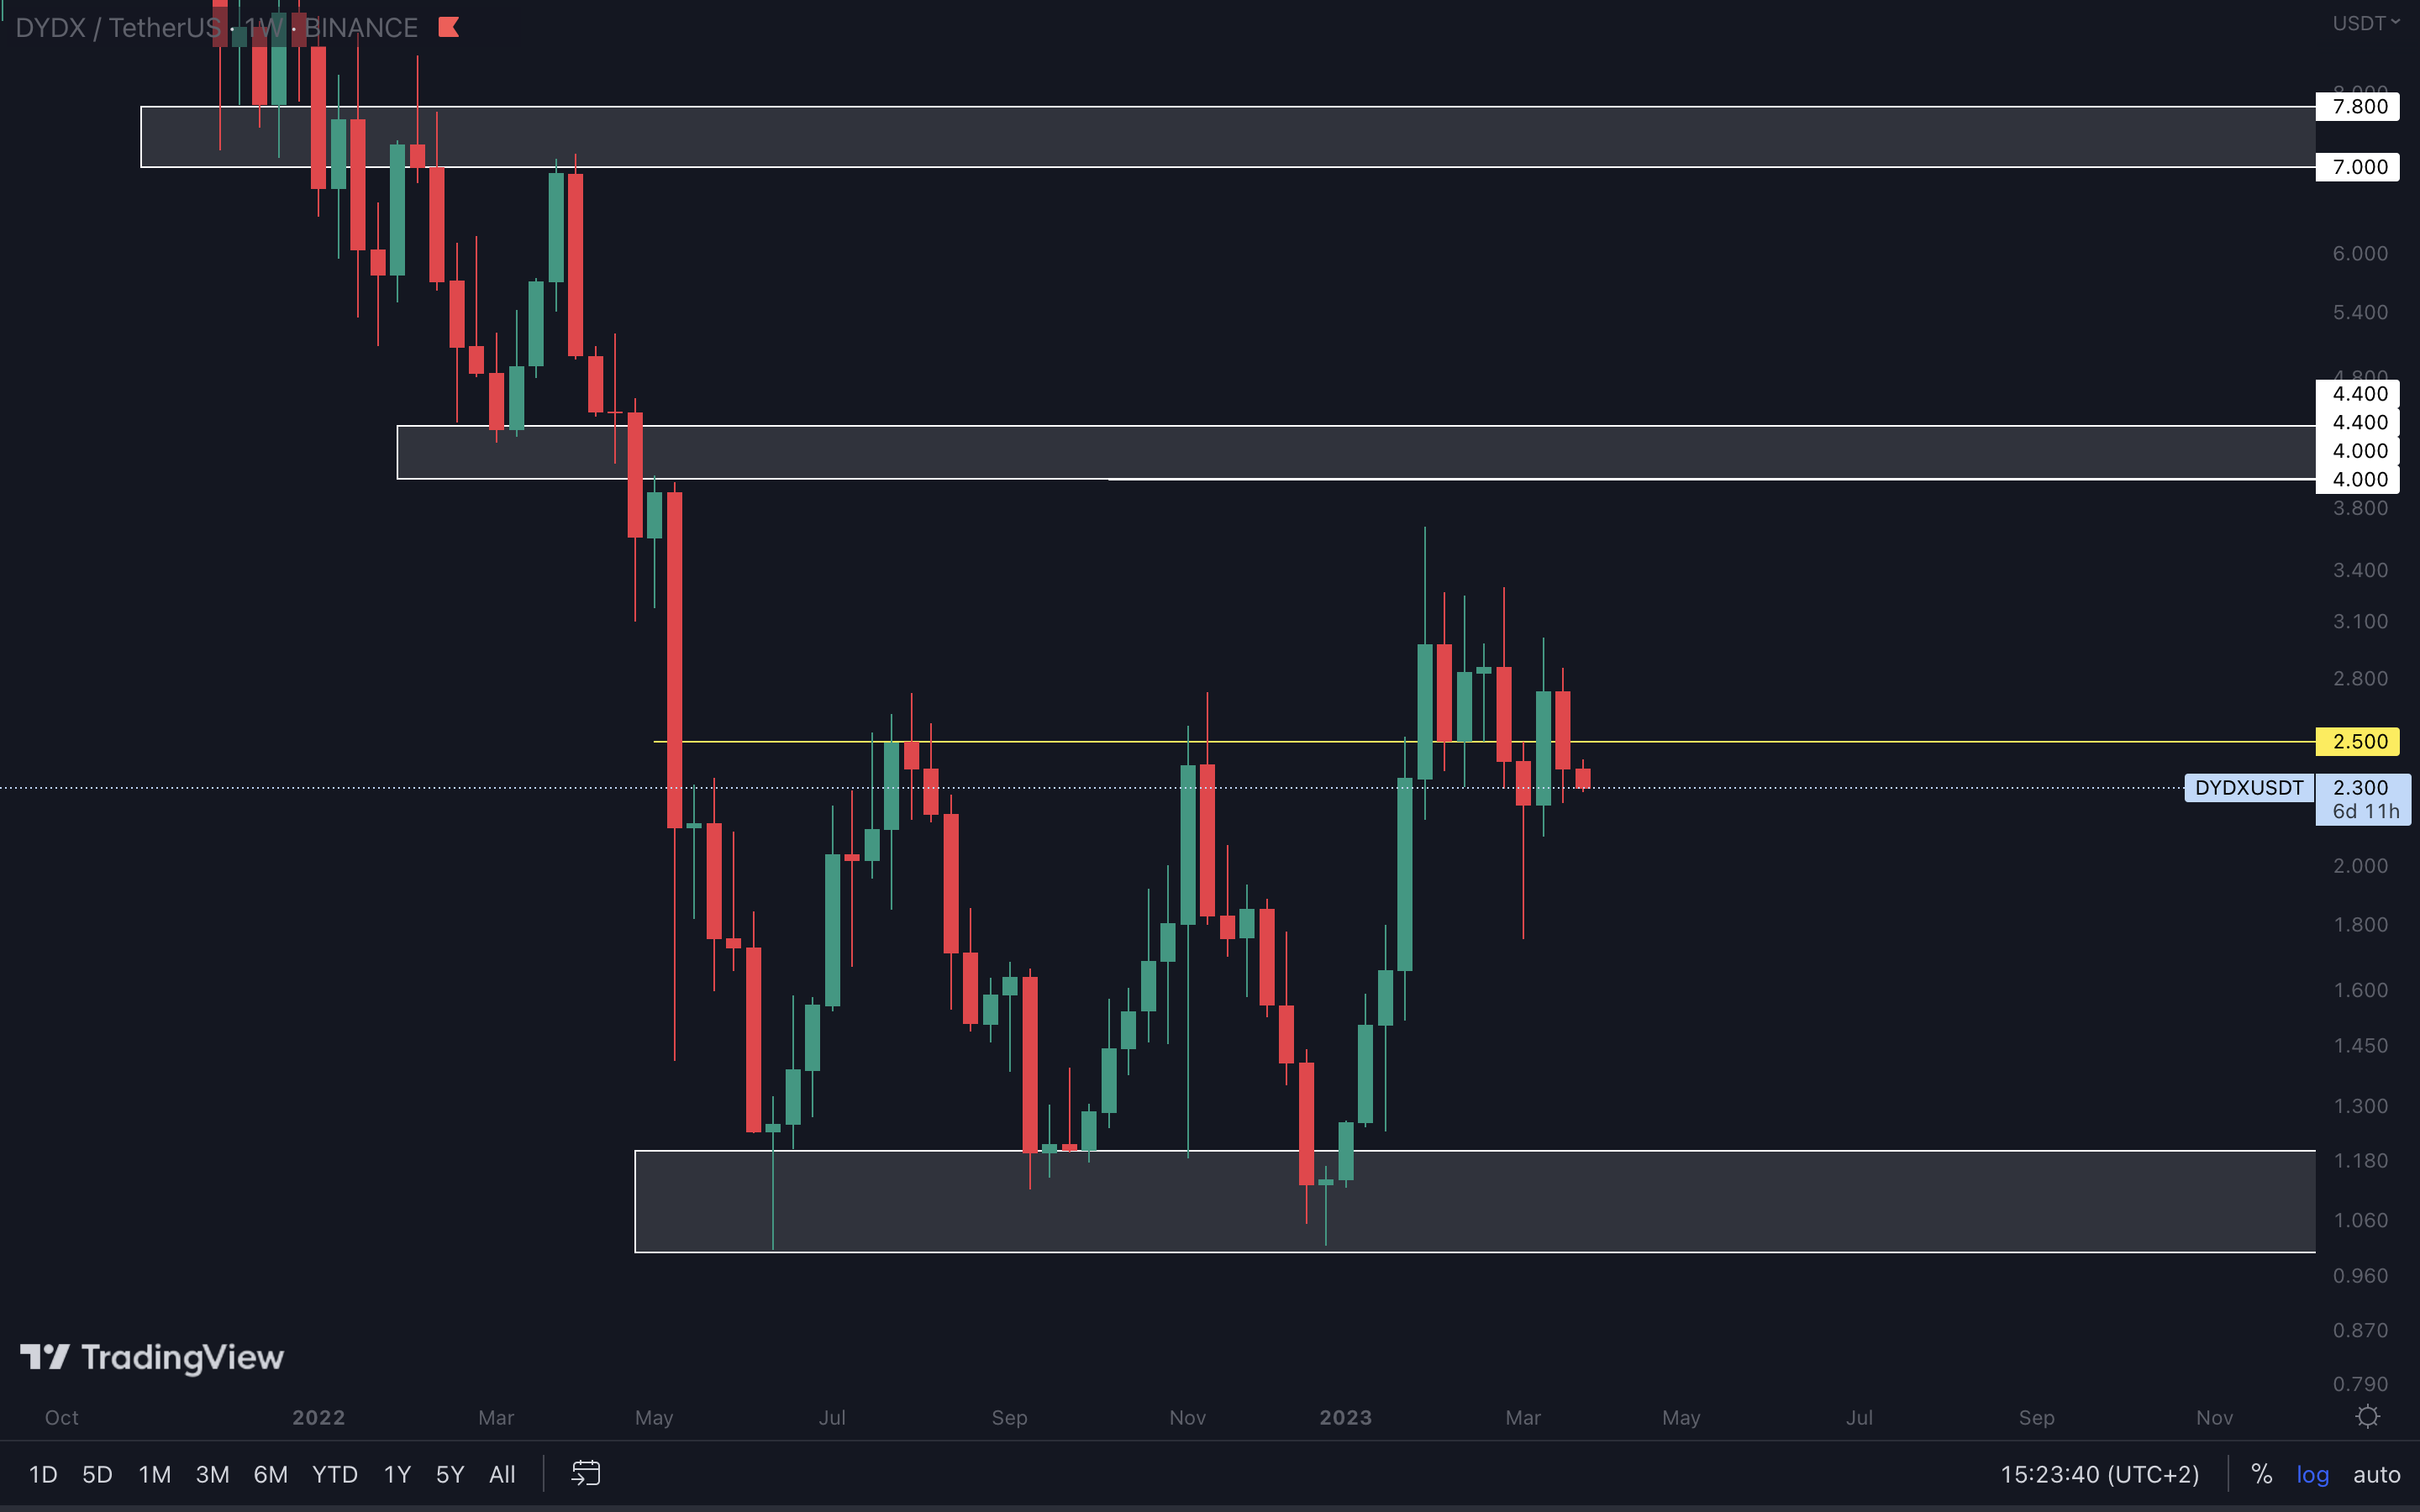
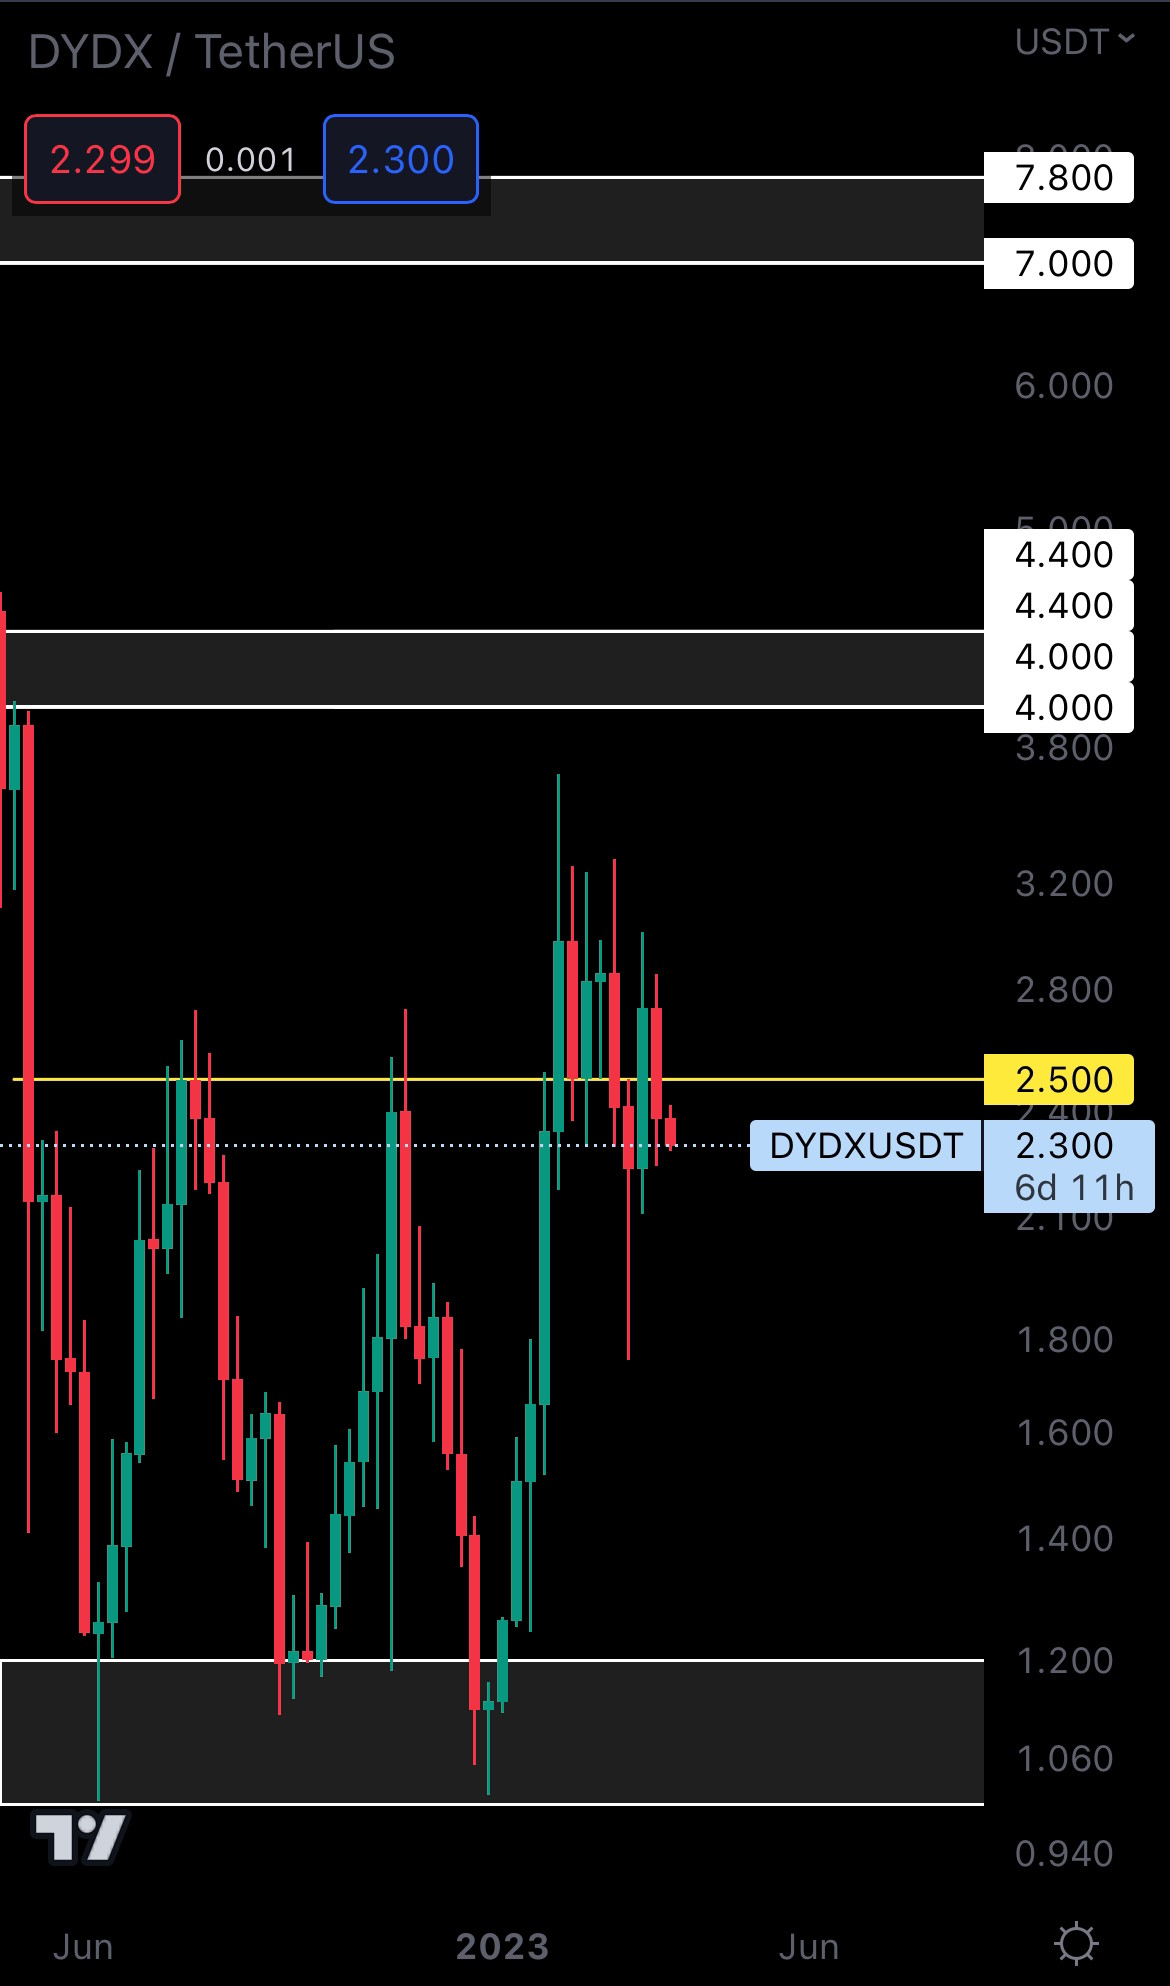
The bullish engulfing candle from two weeks ago was not enough for DYDX to hold $2.50 as support. This level was lost again last week, invalidating the move to $4 - $4.40. We’d have to see DYDX close back above $2.50 on the weekly timeframe to confirm upside. Otherwise, it’s heading lower.
LDO | Lido DAO (Weekly)
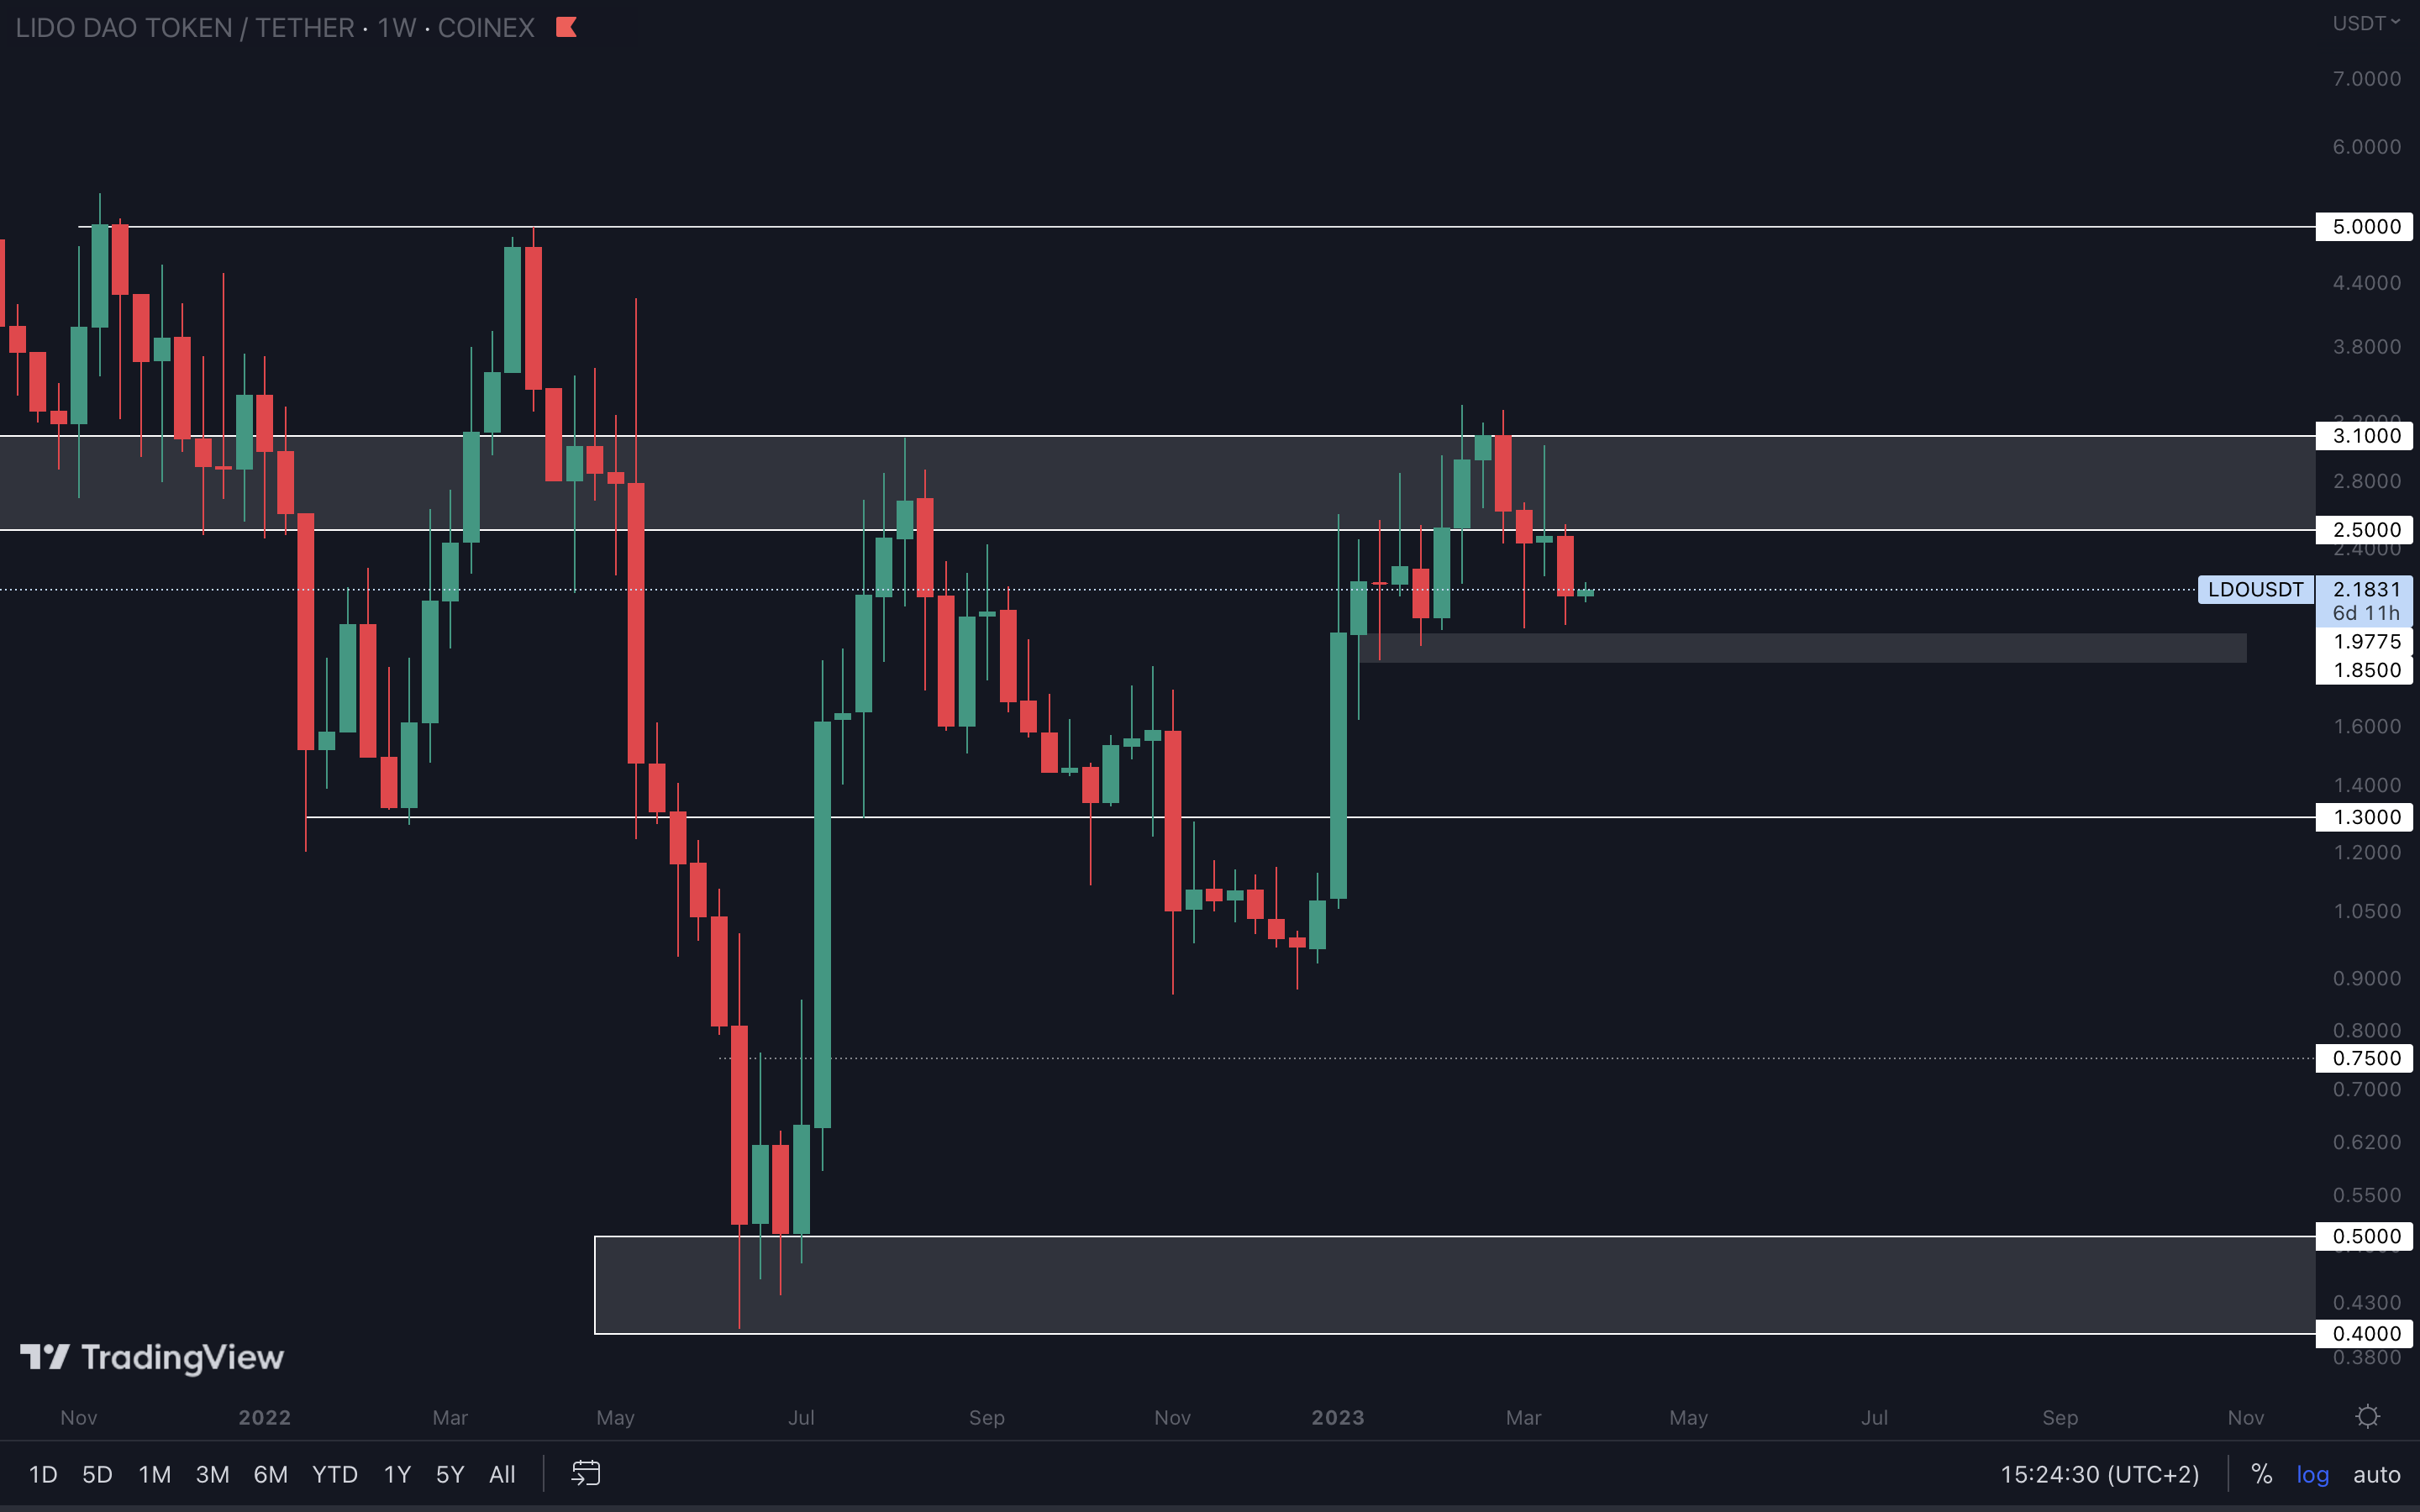
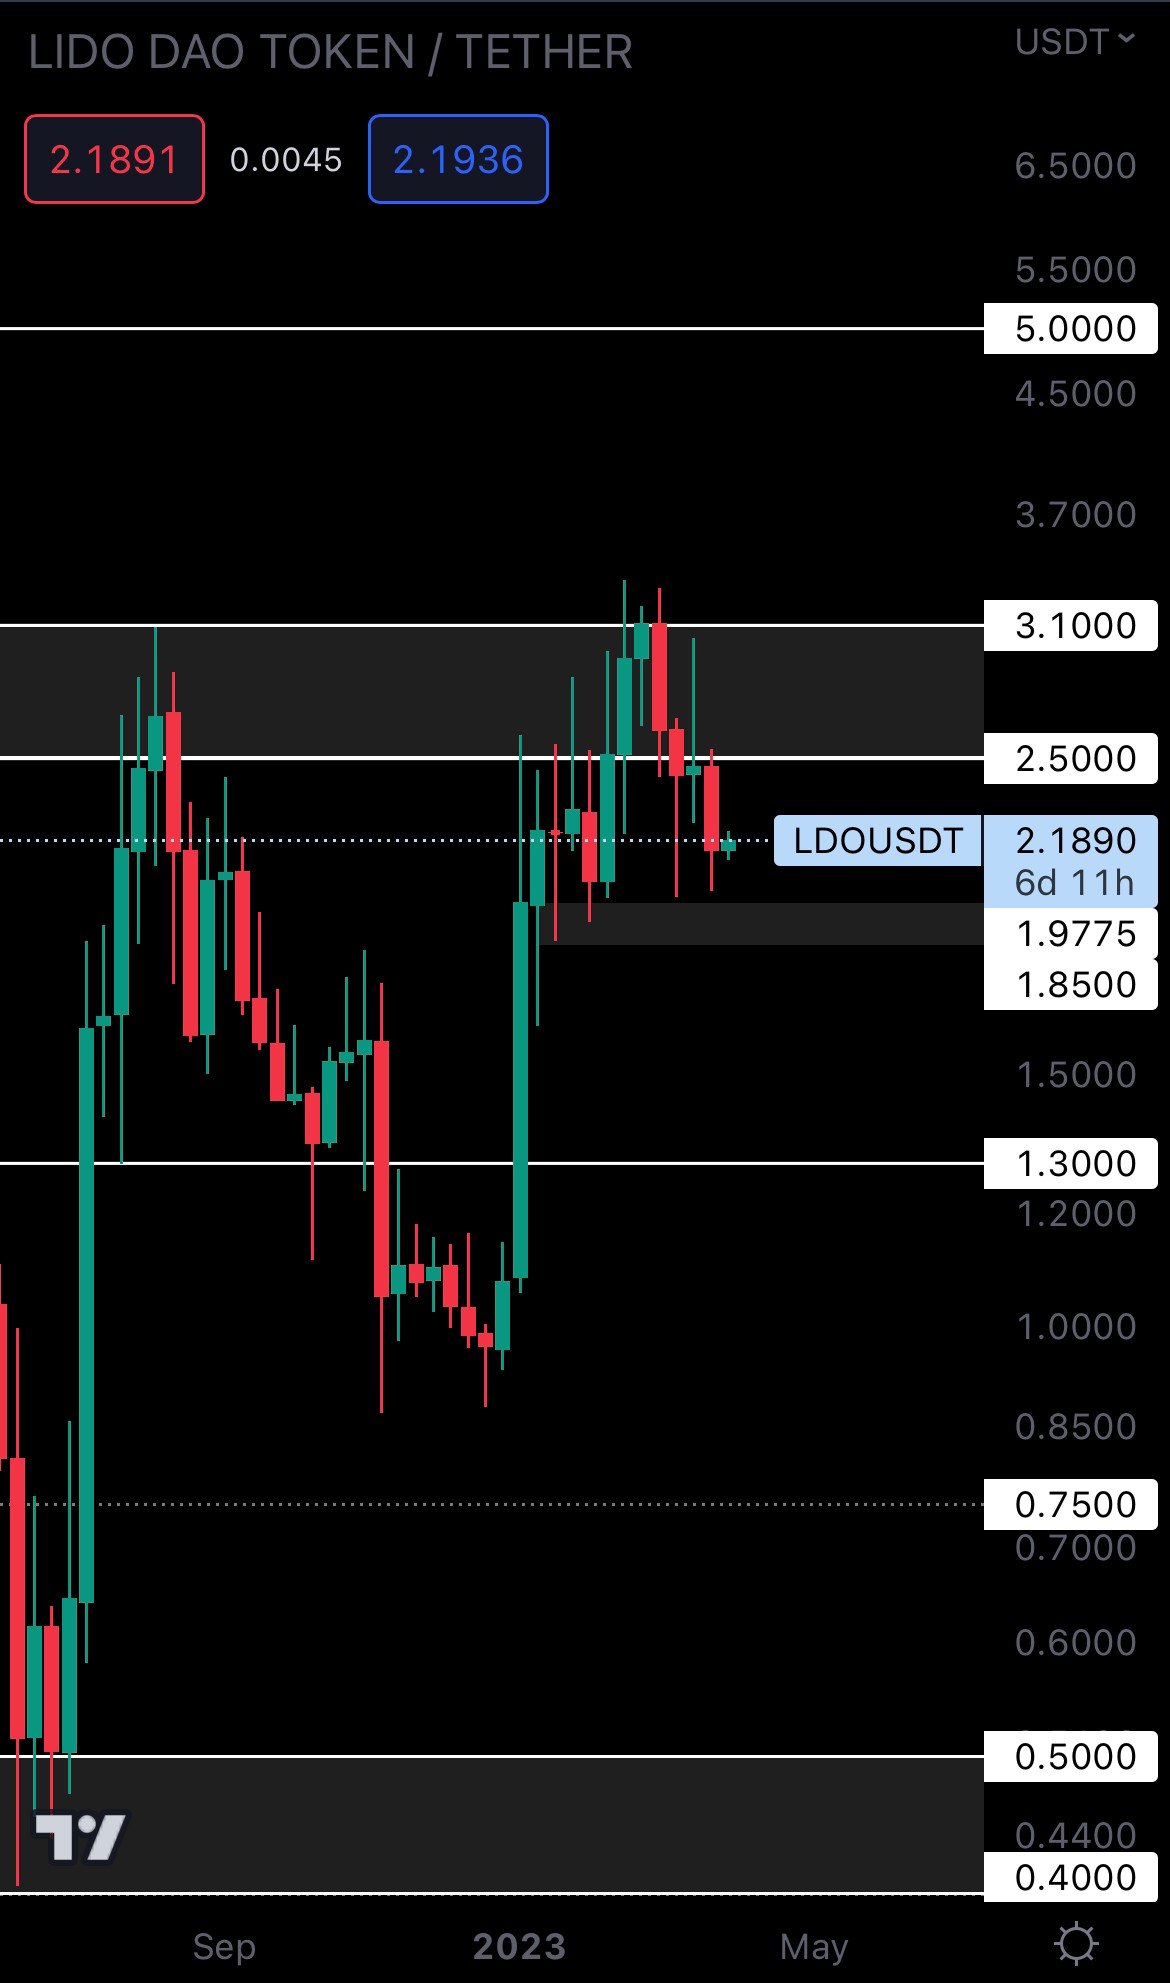
LDO got rejected from resistance, which quickly brought it closer to the $1.9775 - $1.85 support area. However, this area hasn’t been reached yet. $1.9775 - $1.85 has been a solid local area for the past ~3 months, so the odds of LDO holding it as support are high.
HEGIC | Hegic (Weekly)
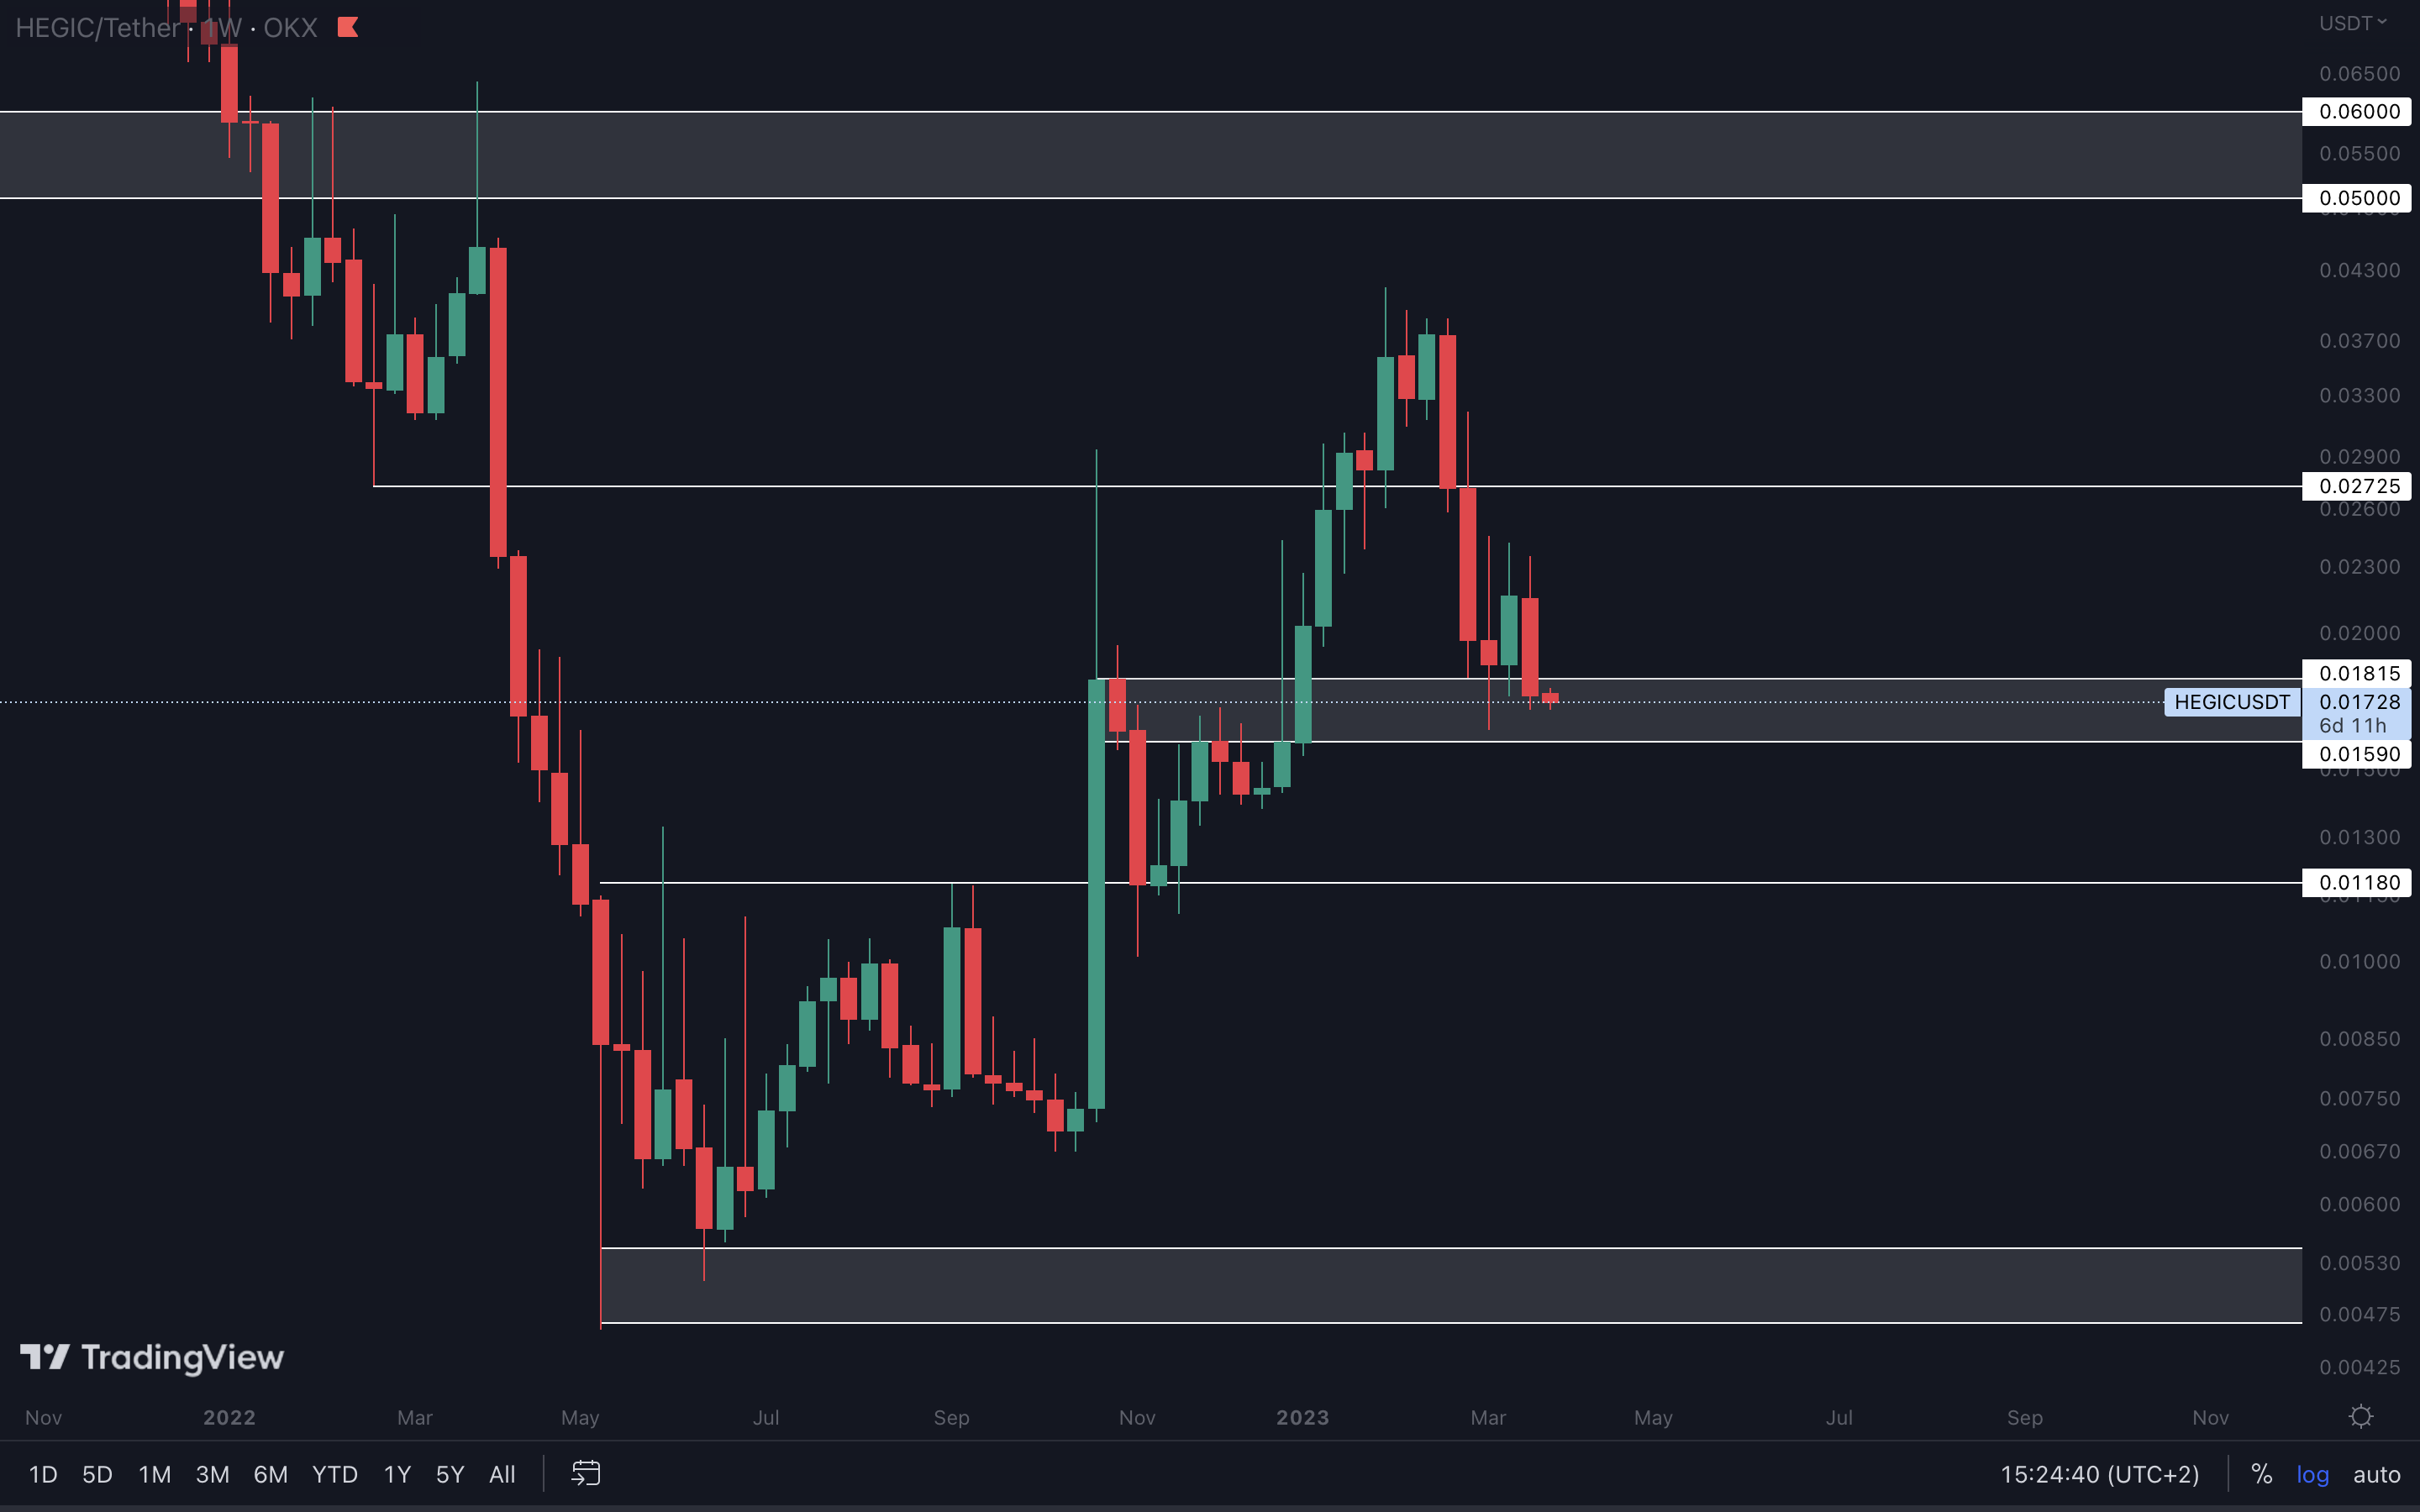
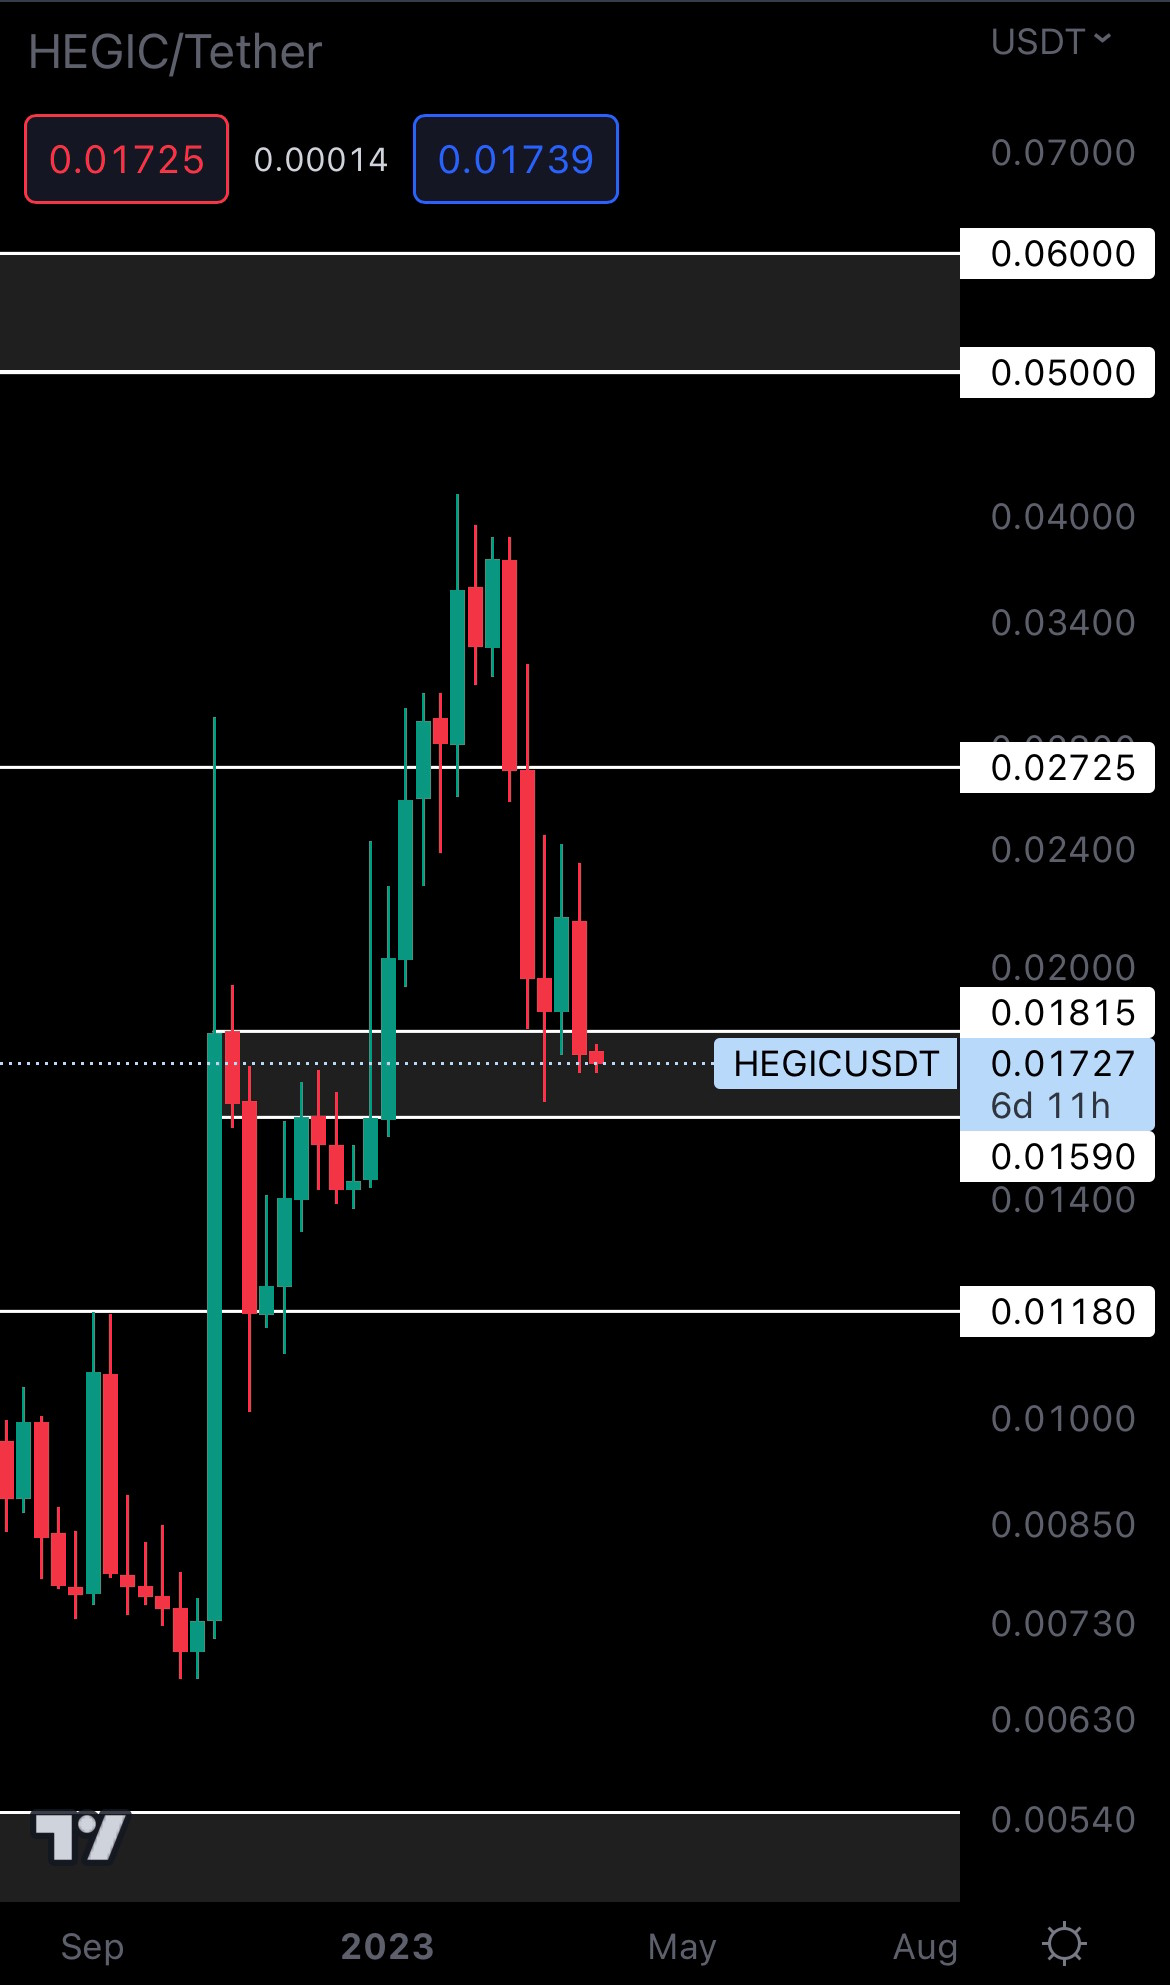
HEGIC closed last week’s candle as a bearish engulfing into support, which would normally be seen as indecisive (because buyers could step in at any point, allowing it to close back above it). However, this might not be the case here… When paired with Bitcoin potentially heading lower, we could see HEGIC reach the bottom of this support area at $0.01590. Holding this level on the weekly timeframe would keep the door open for $0.02725.
PENDLE | Pendle (Weekly)
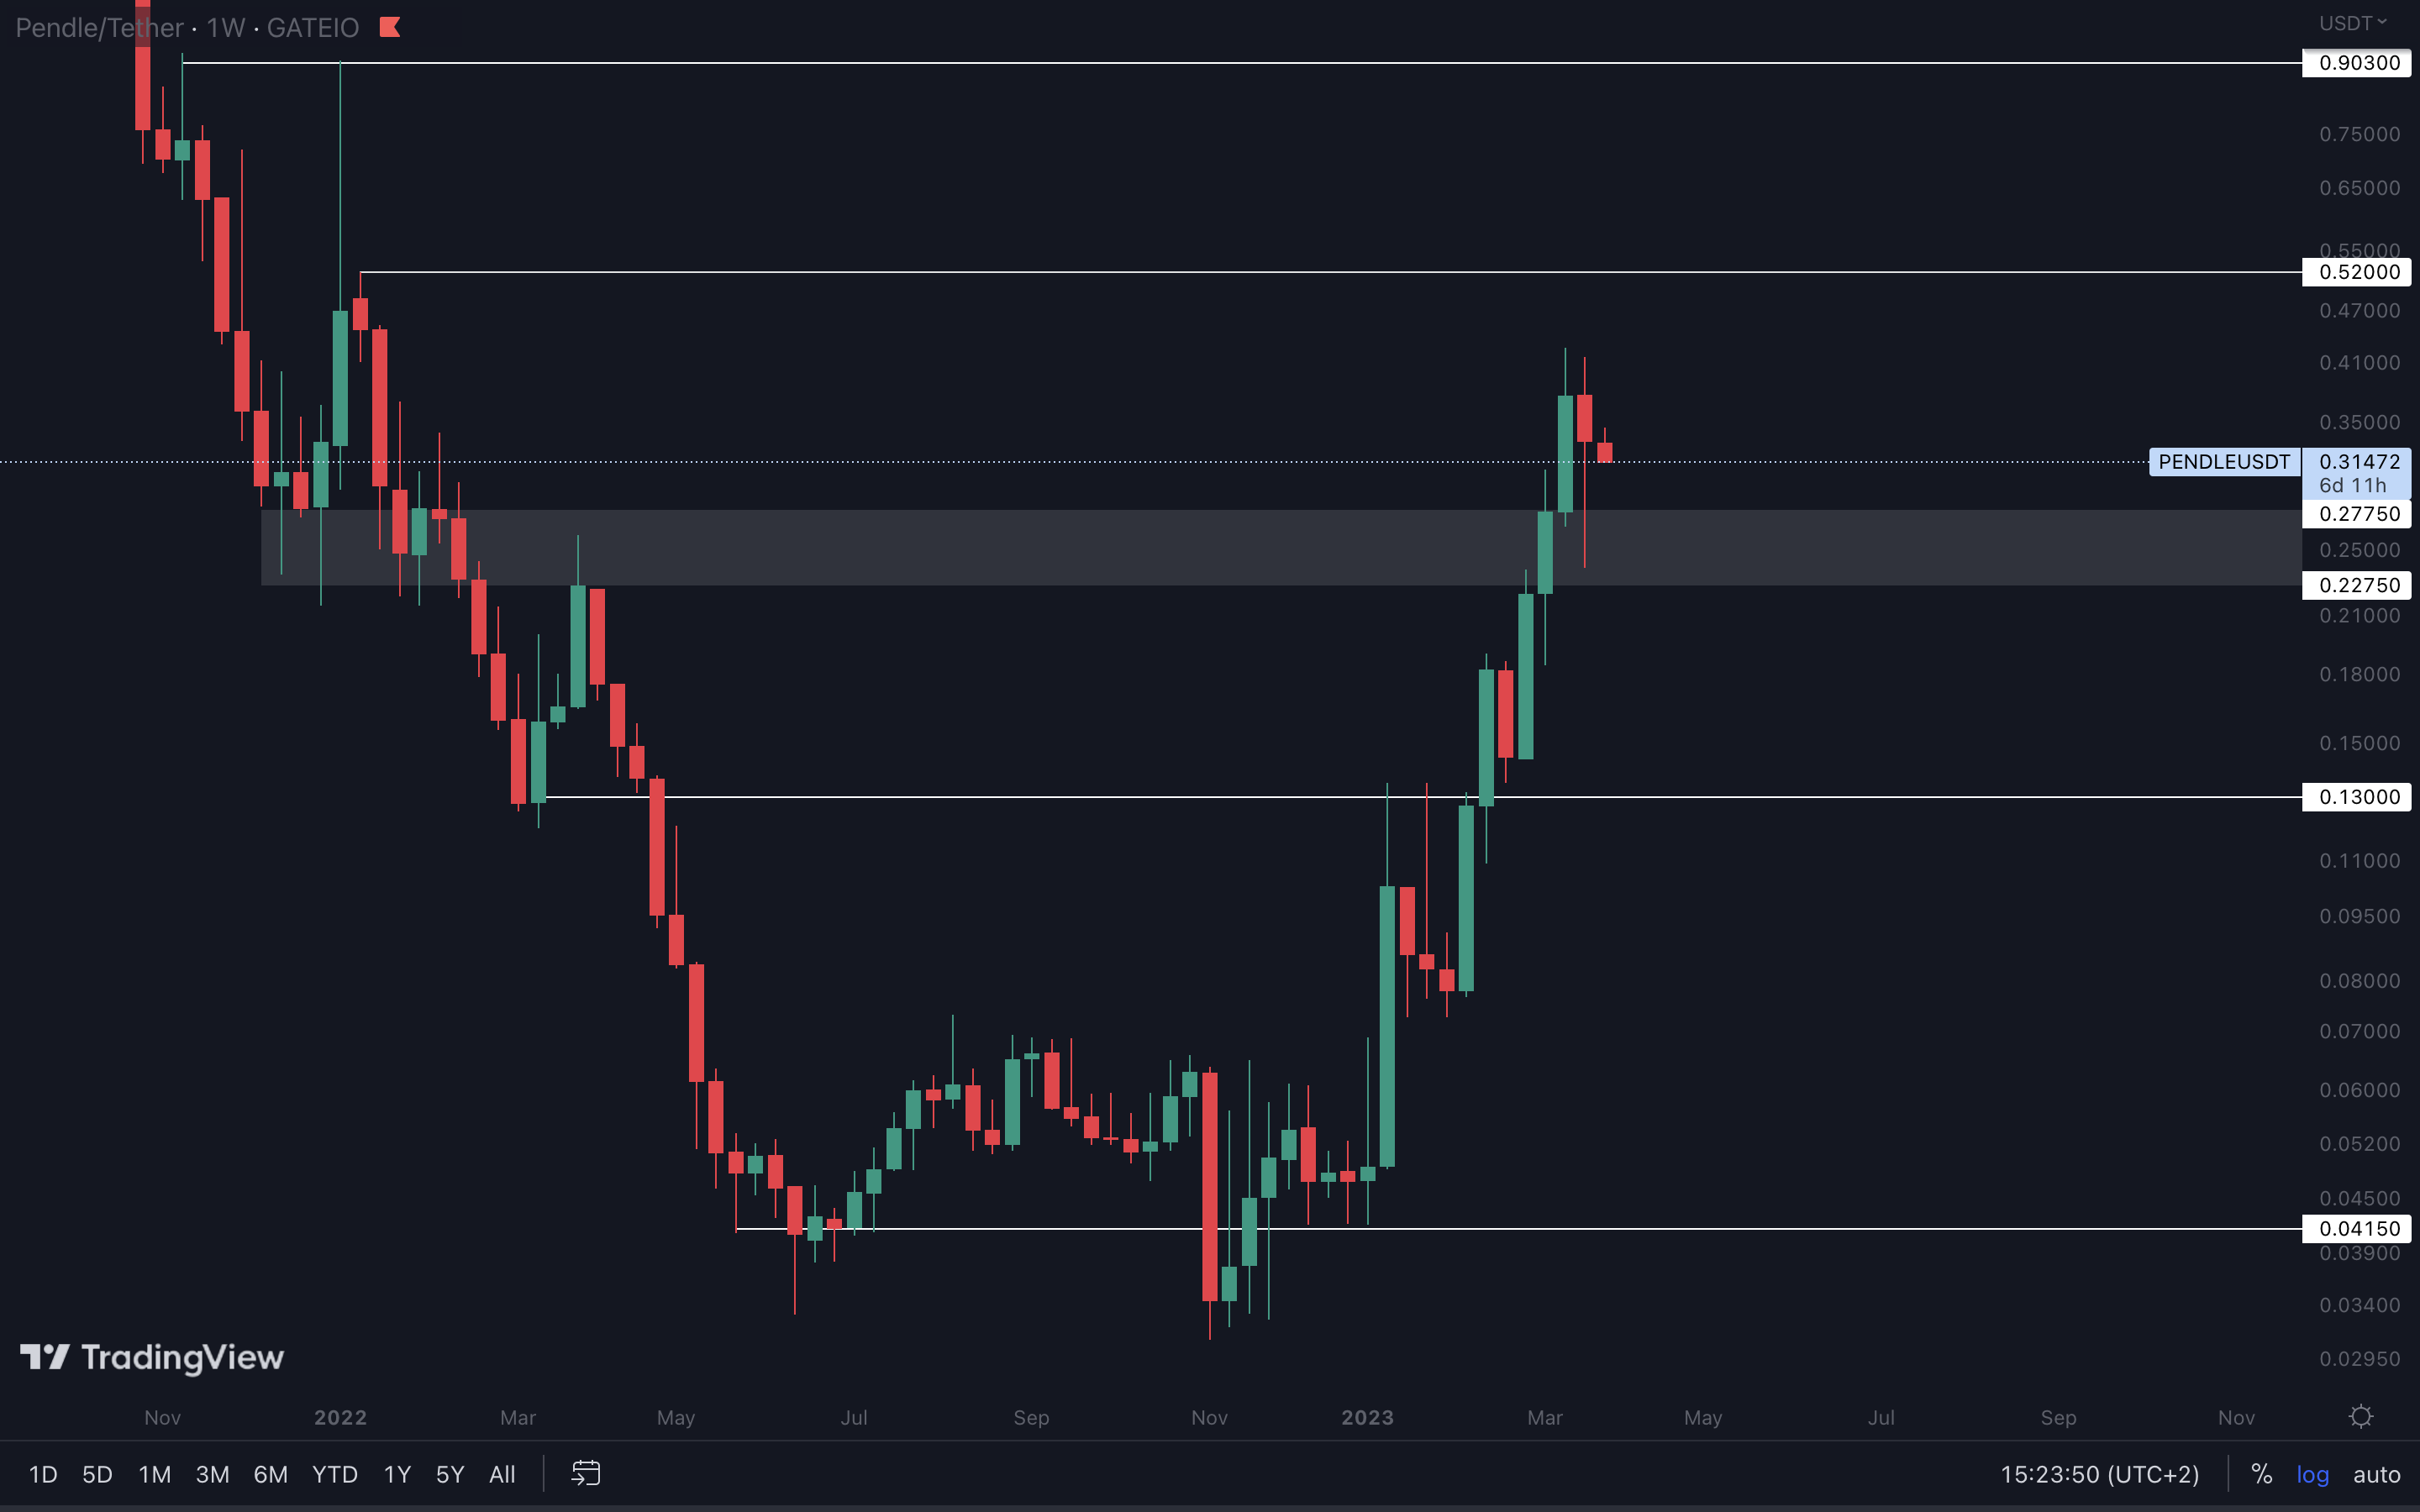
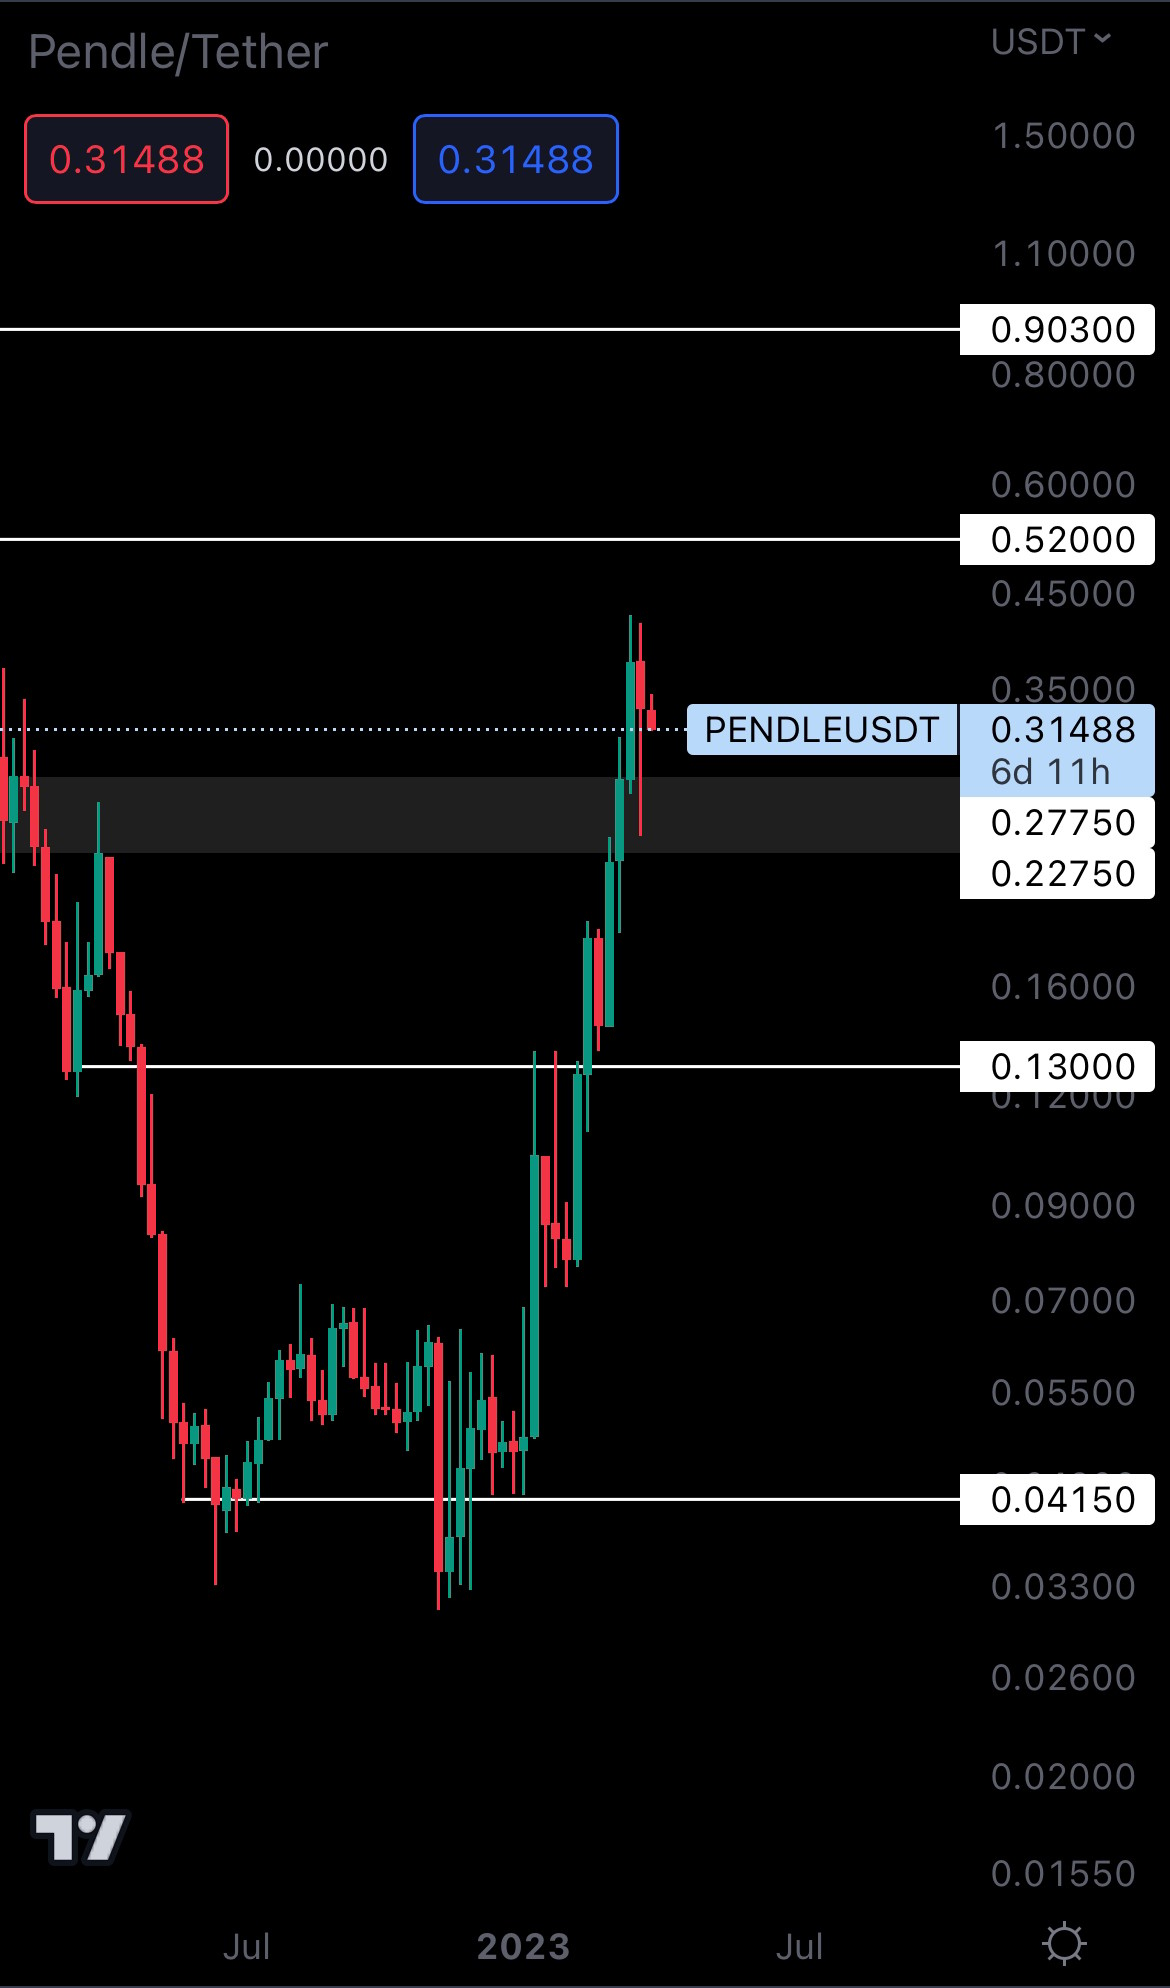
Despite experiencing some selling pressure last week, buyers stepped in after PENDLE reached support, which can be seen by looking at the wick. This suggests there’s strong demand in the $0.27750 - $0.22750 area, so it’s unlikely it will lose it. We could see PENDLE range above support for a while, but the trajectory hasn’t changed. It’s heading to $0.52.
Cryptonary's Watchlist
DOT | Polkadot (Weekly)
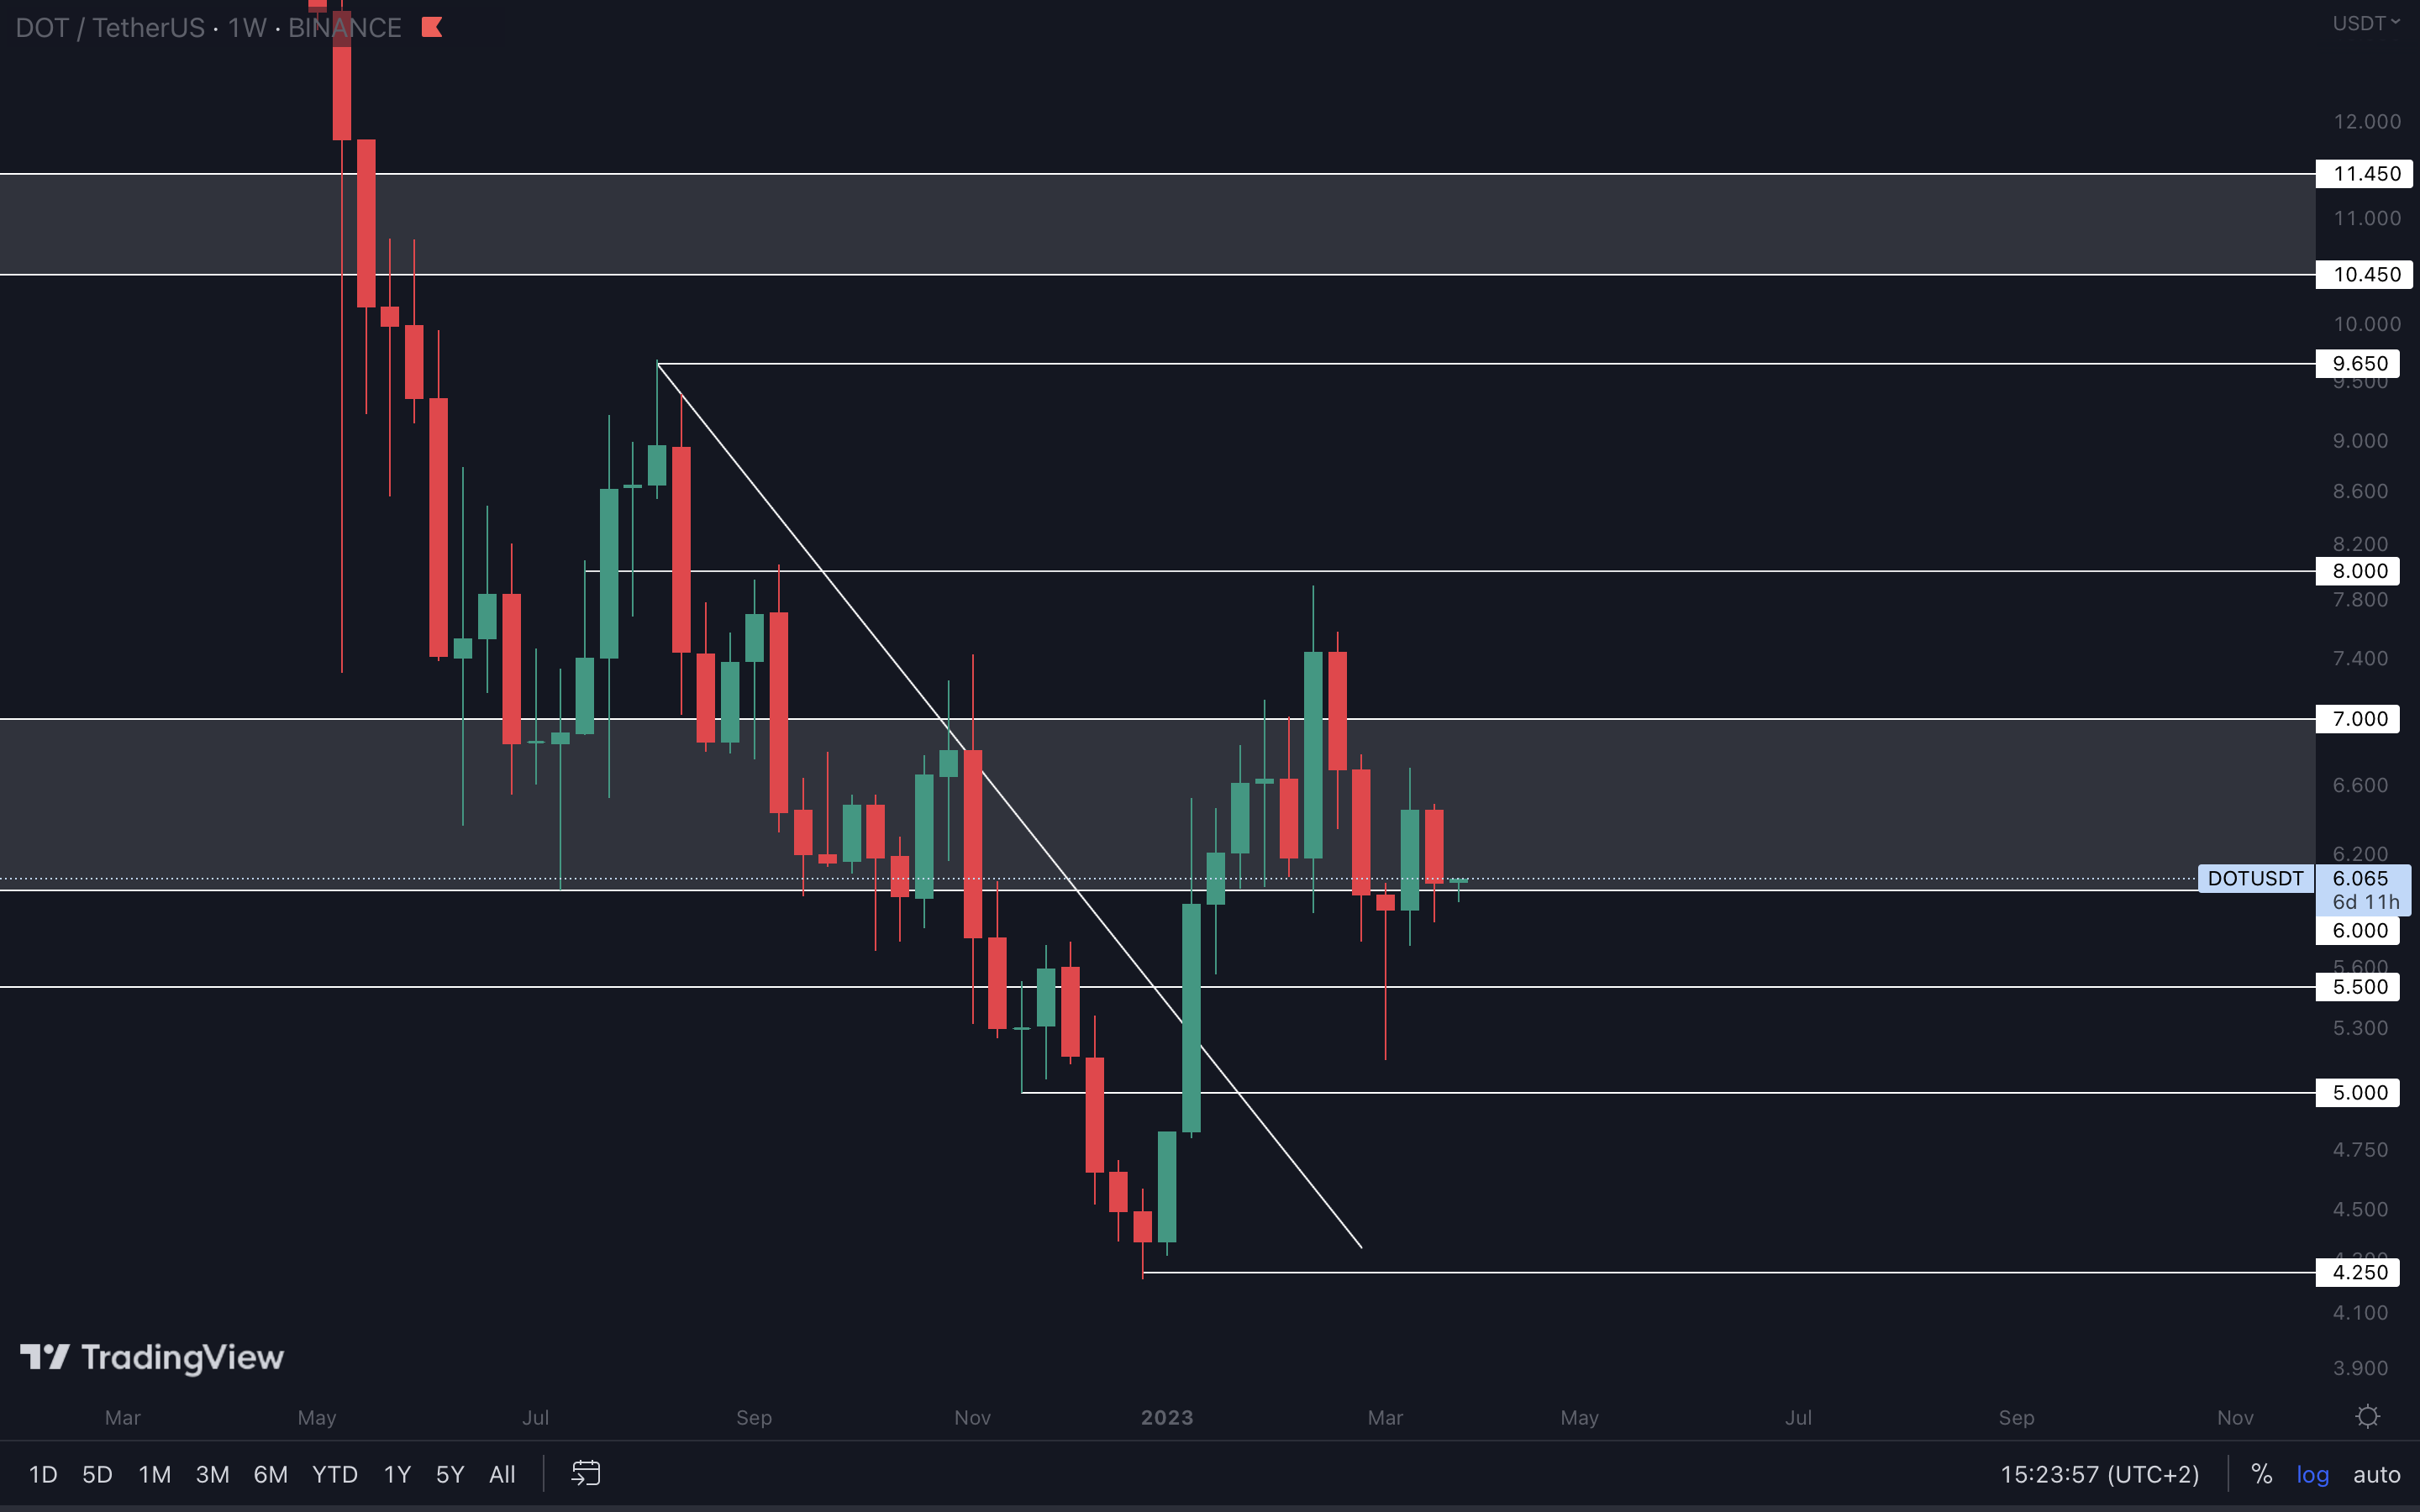
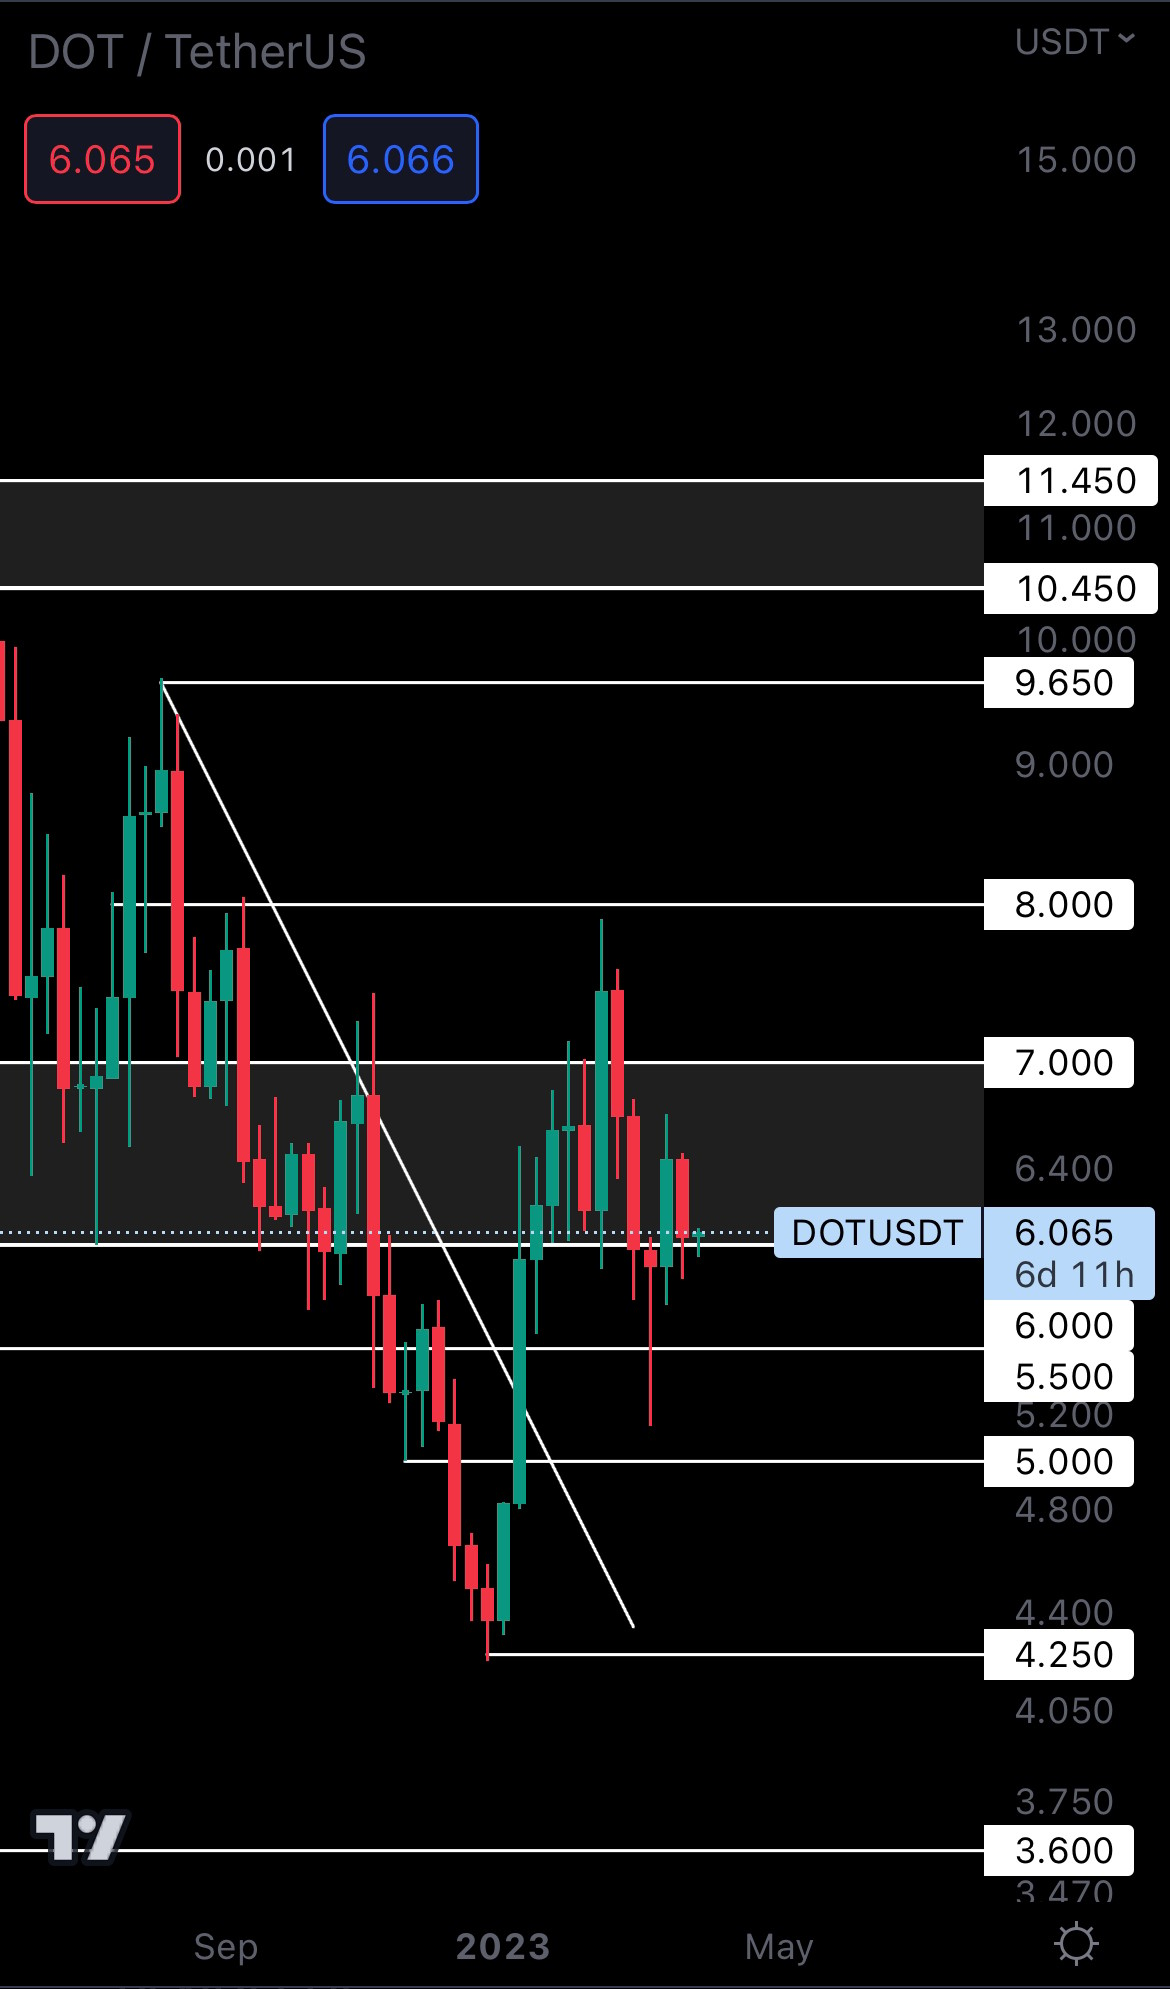
Despite closing above $6, Bitcoin could easily push DOT under this level and put it on track for $5.50. For that reason, we wouldn’t view DOT holding $6 as being a big deal at this time, and we don’t recommend jumping on it either.
RUNE | THORChain (Weekly)
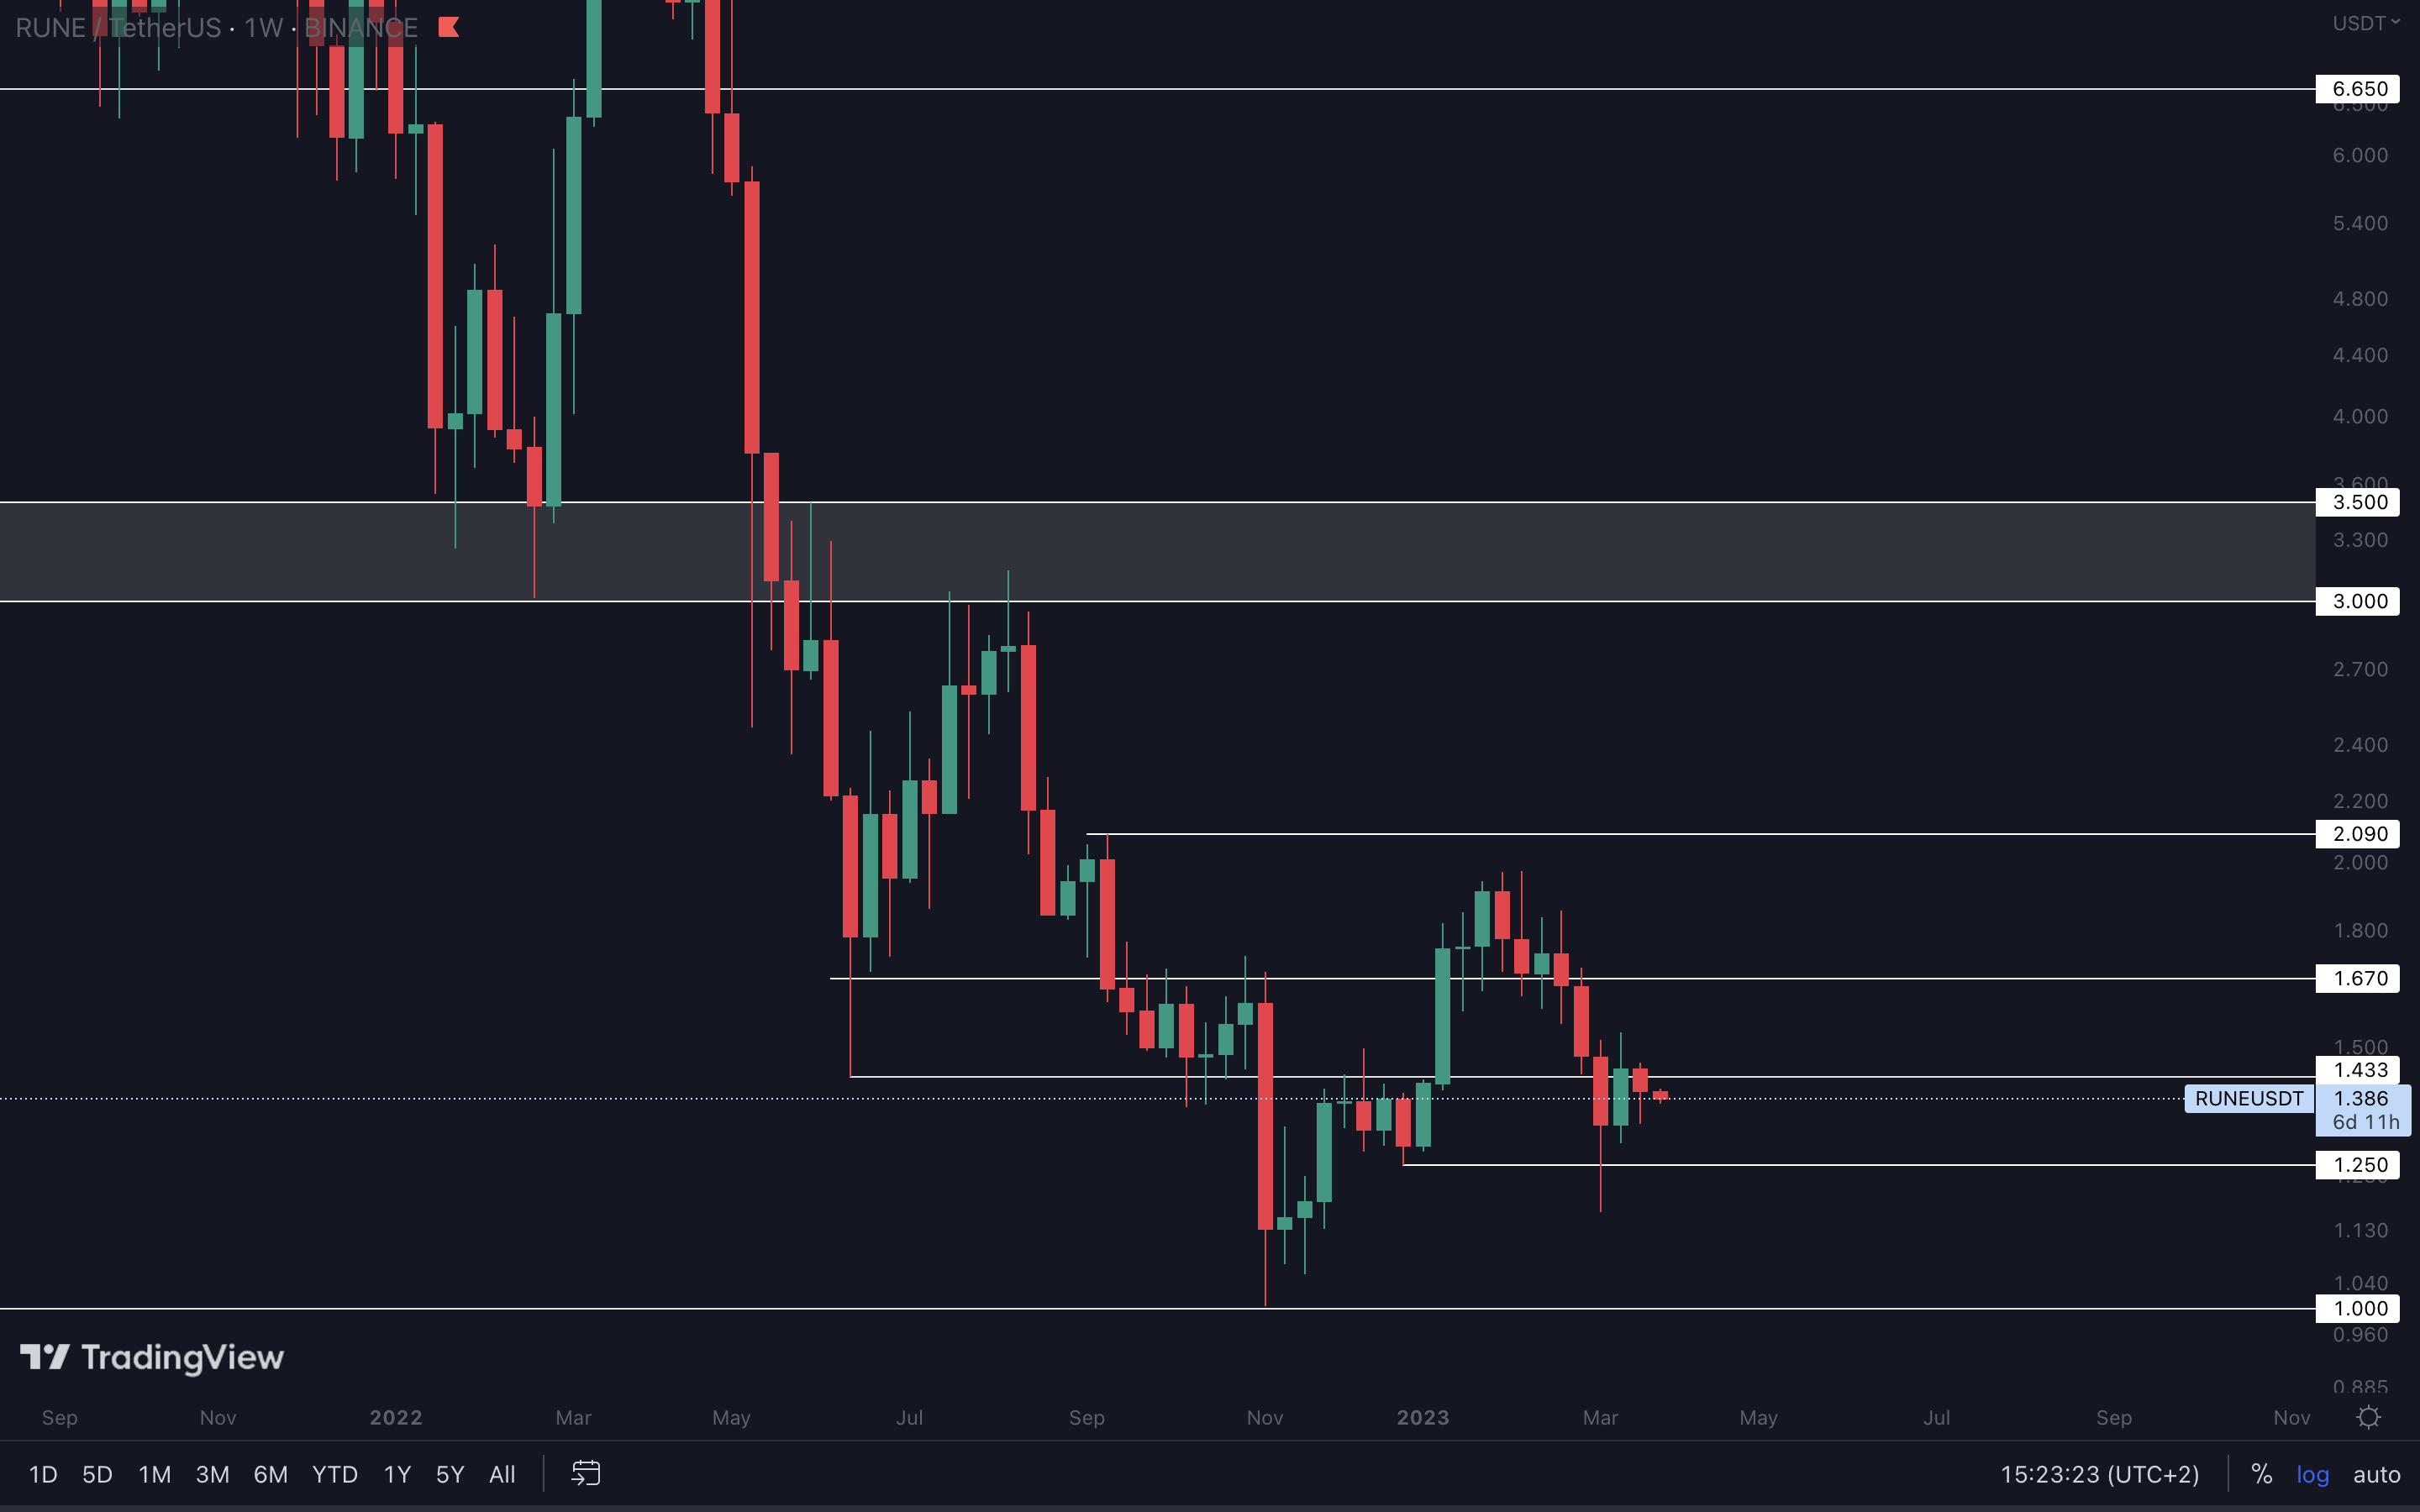
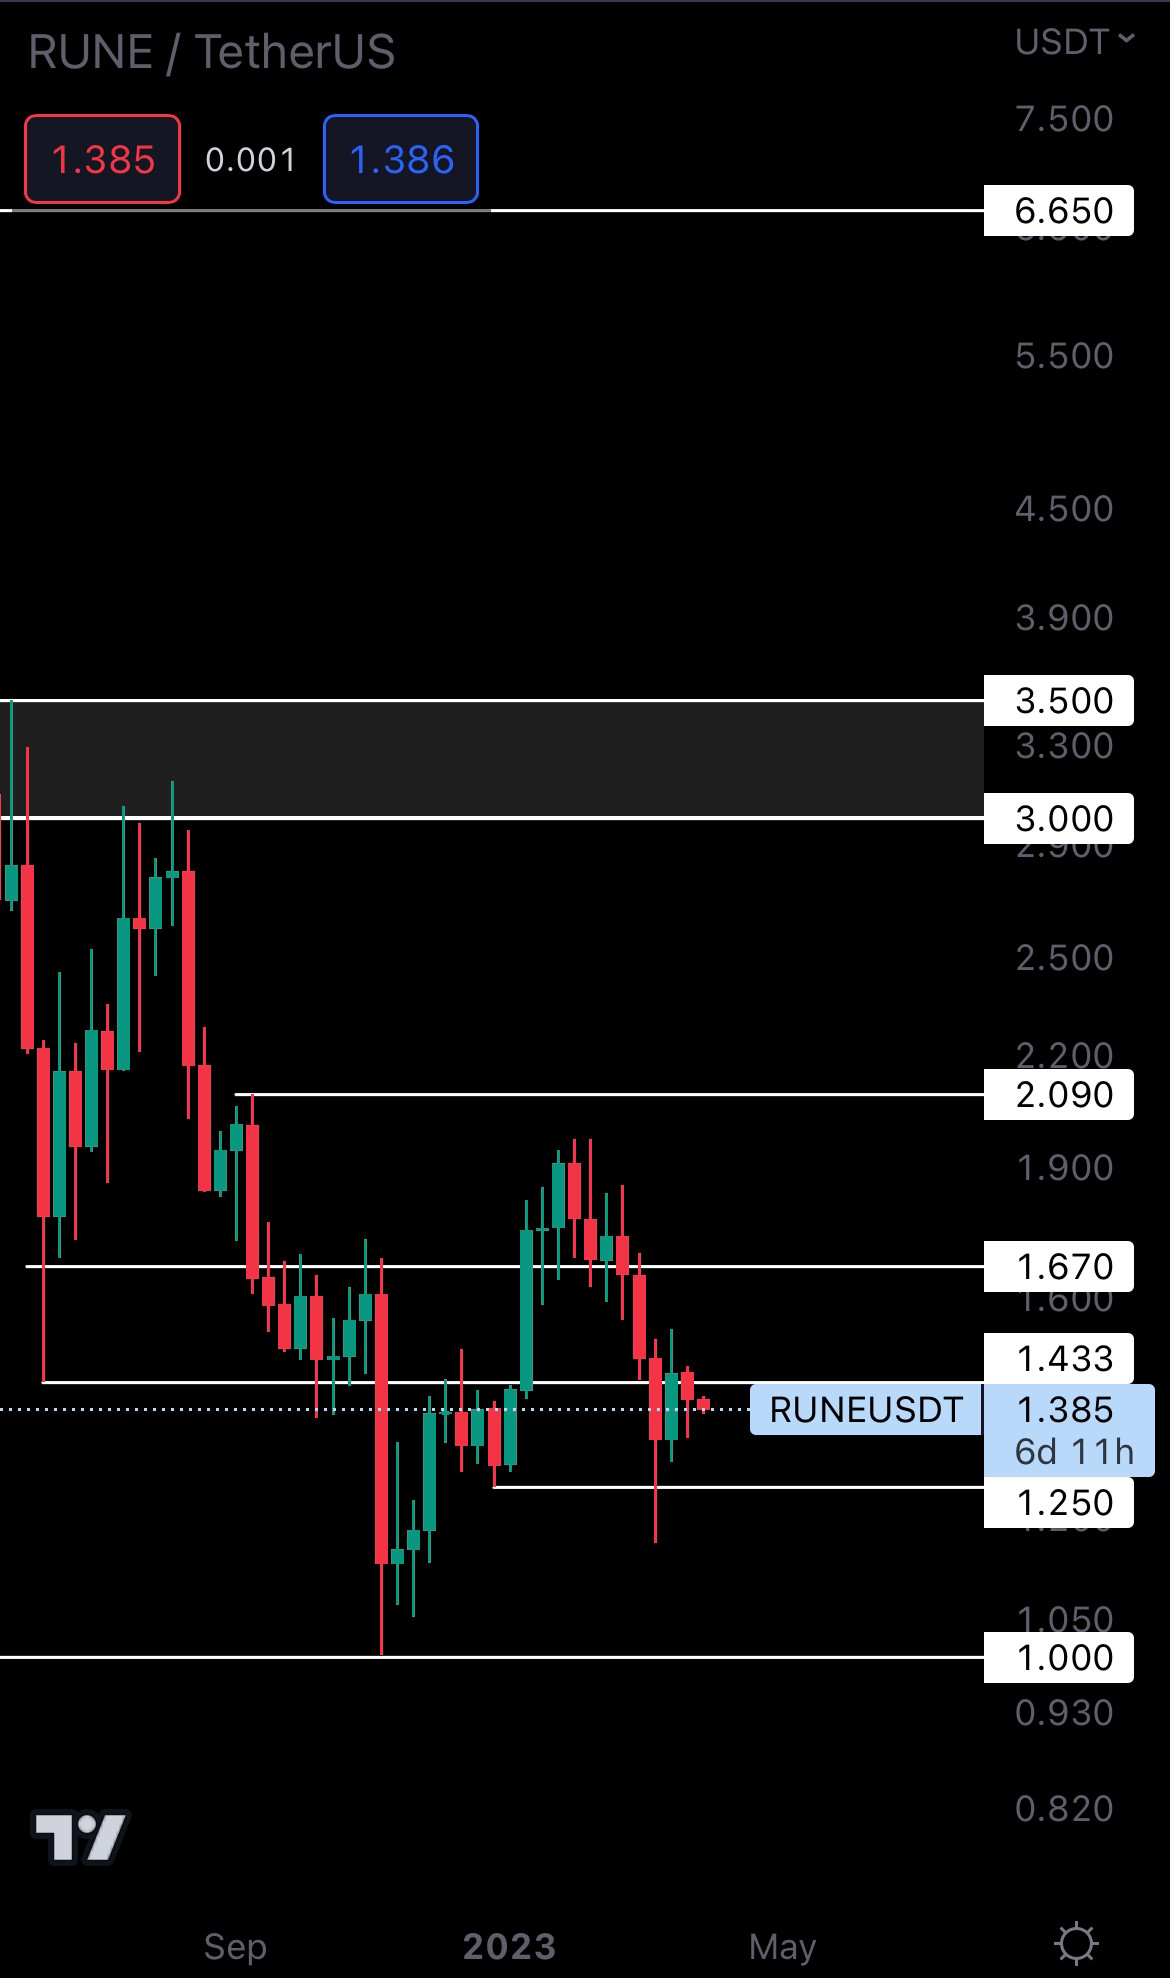
RUNE was unable to hold $1.43 as support after closing above it two weeks ago. It closed under this level, putting it on track for $1.25. This is in confluence with our expectations for Bitcoin in the coming weeks (potential pullback), so reaching $1.25 is possible. This would provide a good entry point for a short-term trade as far as risk/reward ratios go.
SOL | Solana (Weekly)
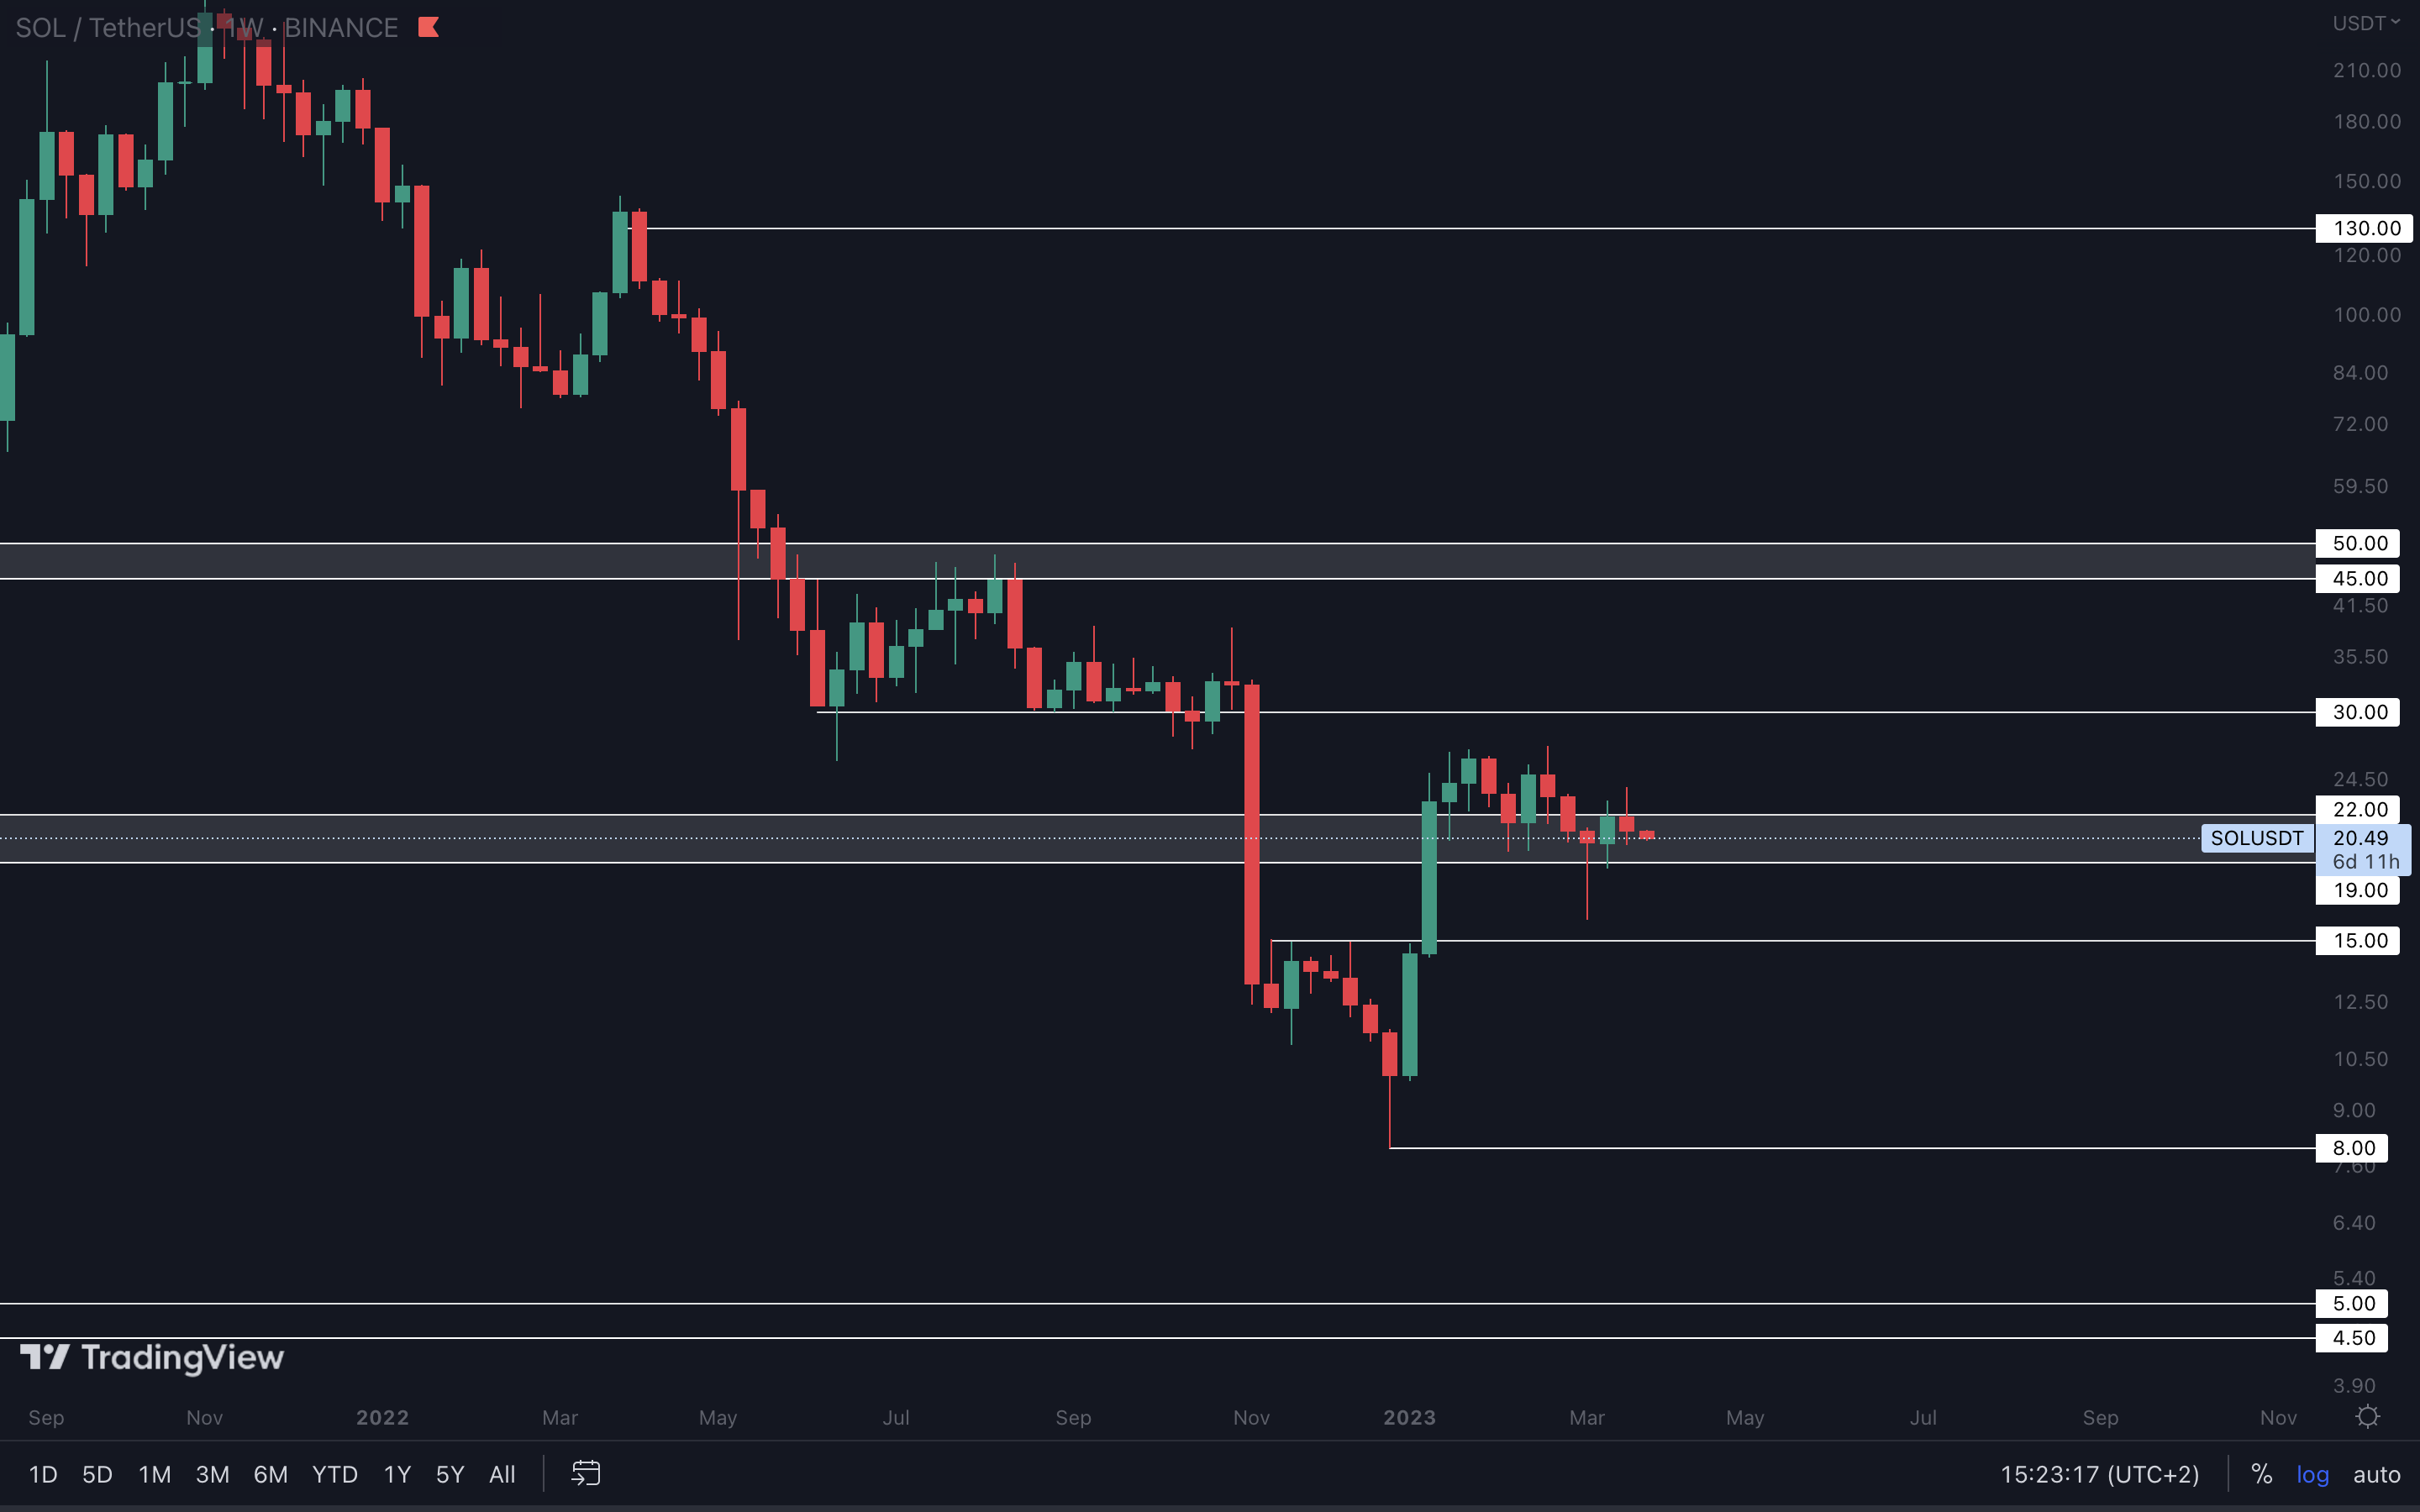
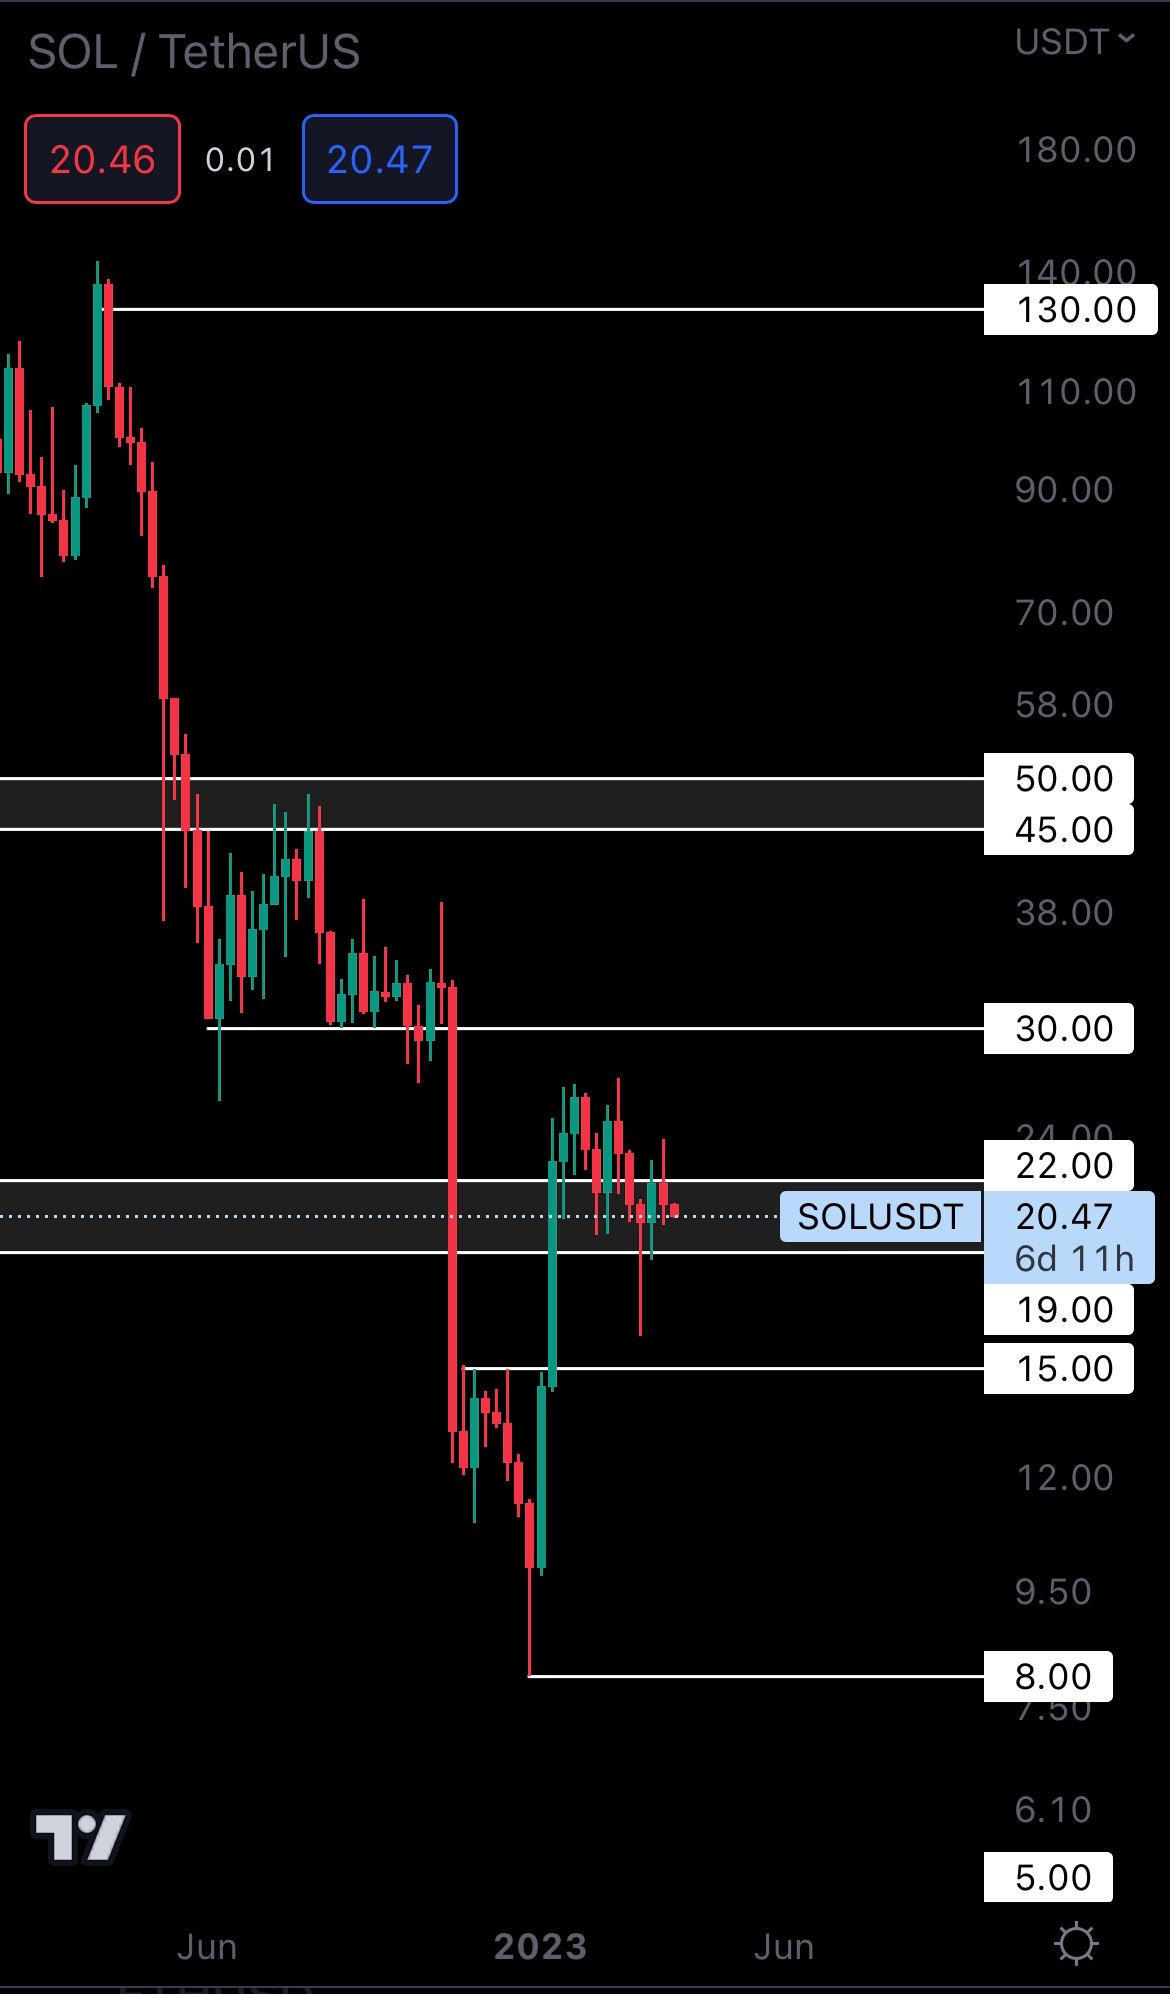
SOL has been ranging inside the $22 - $19 area for a few weeks, and we’ll need a weekly closure above or under this area to confirm where it’s going next. However, we can see that the candles are small, which means they lack volume. So, Bitcoin could easily influence SOL’s price action in either direction. Because we’re expecting a pullback for BTC, SOL might head to $19, the bottom of its current support area.
SNX | Synthetix (Weekly)
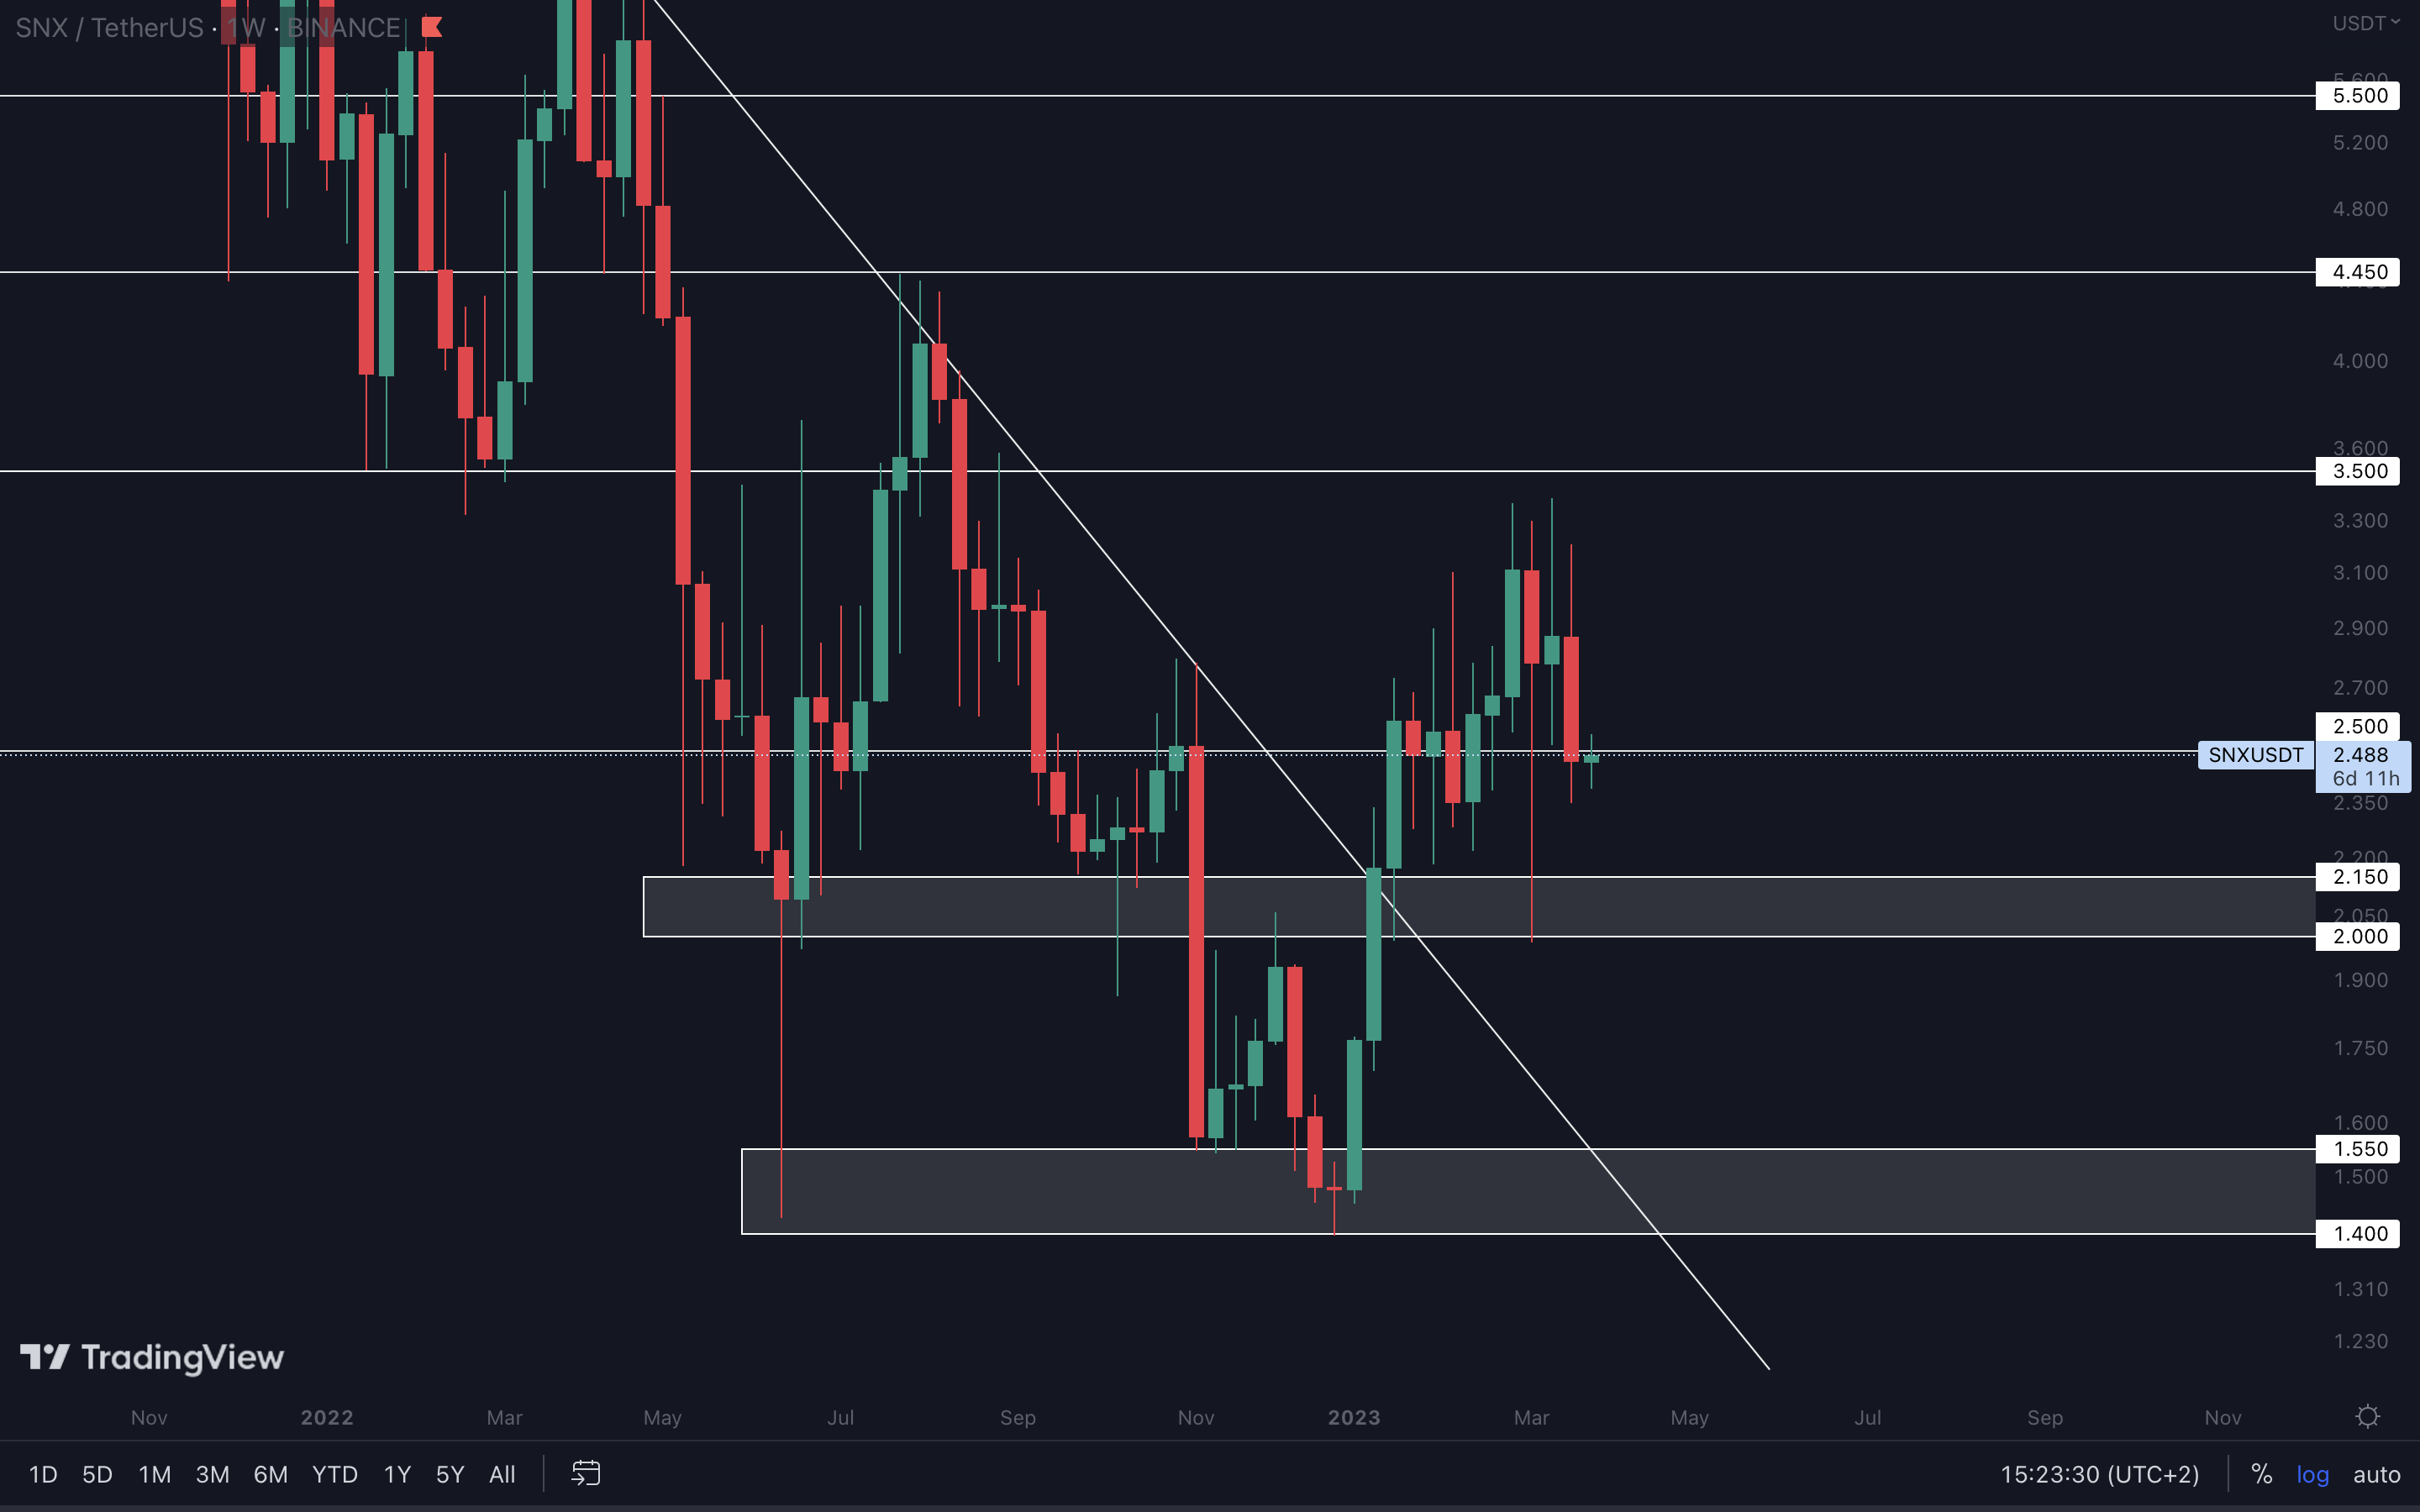
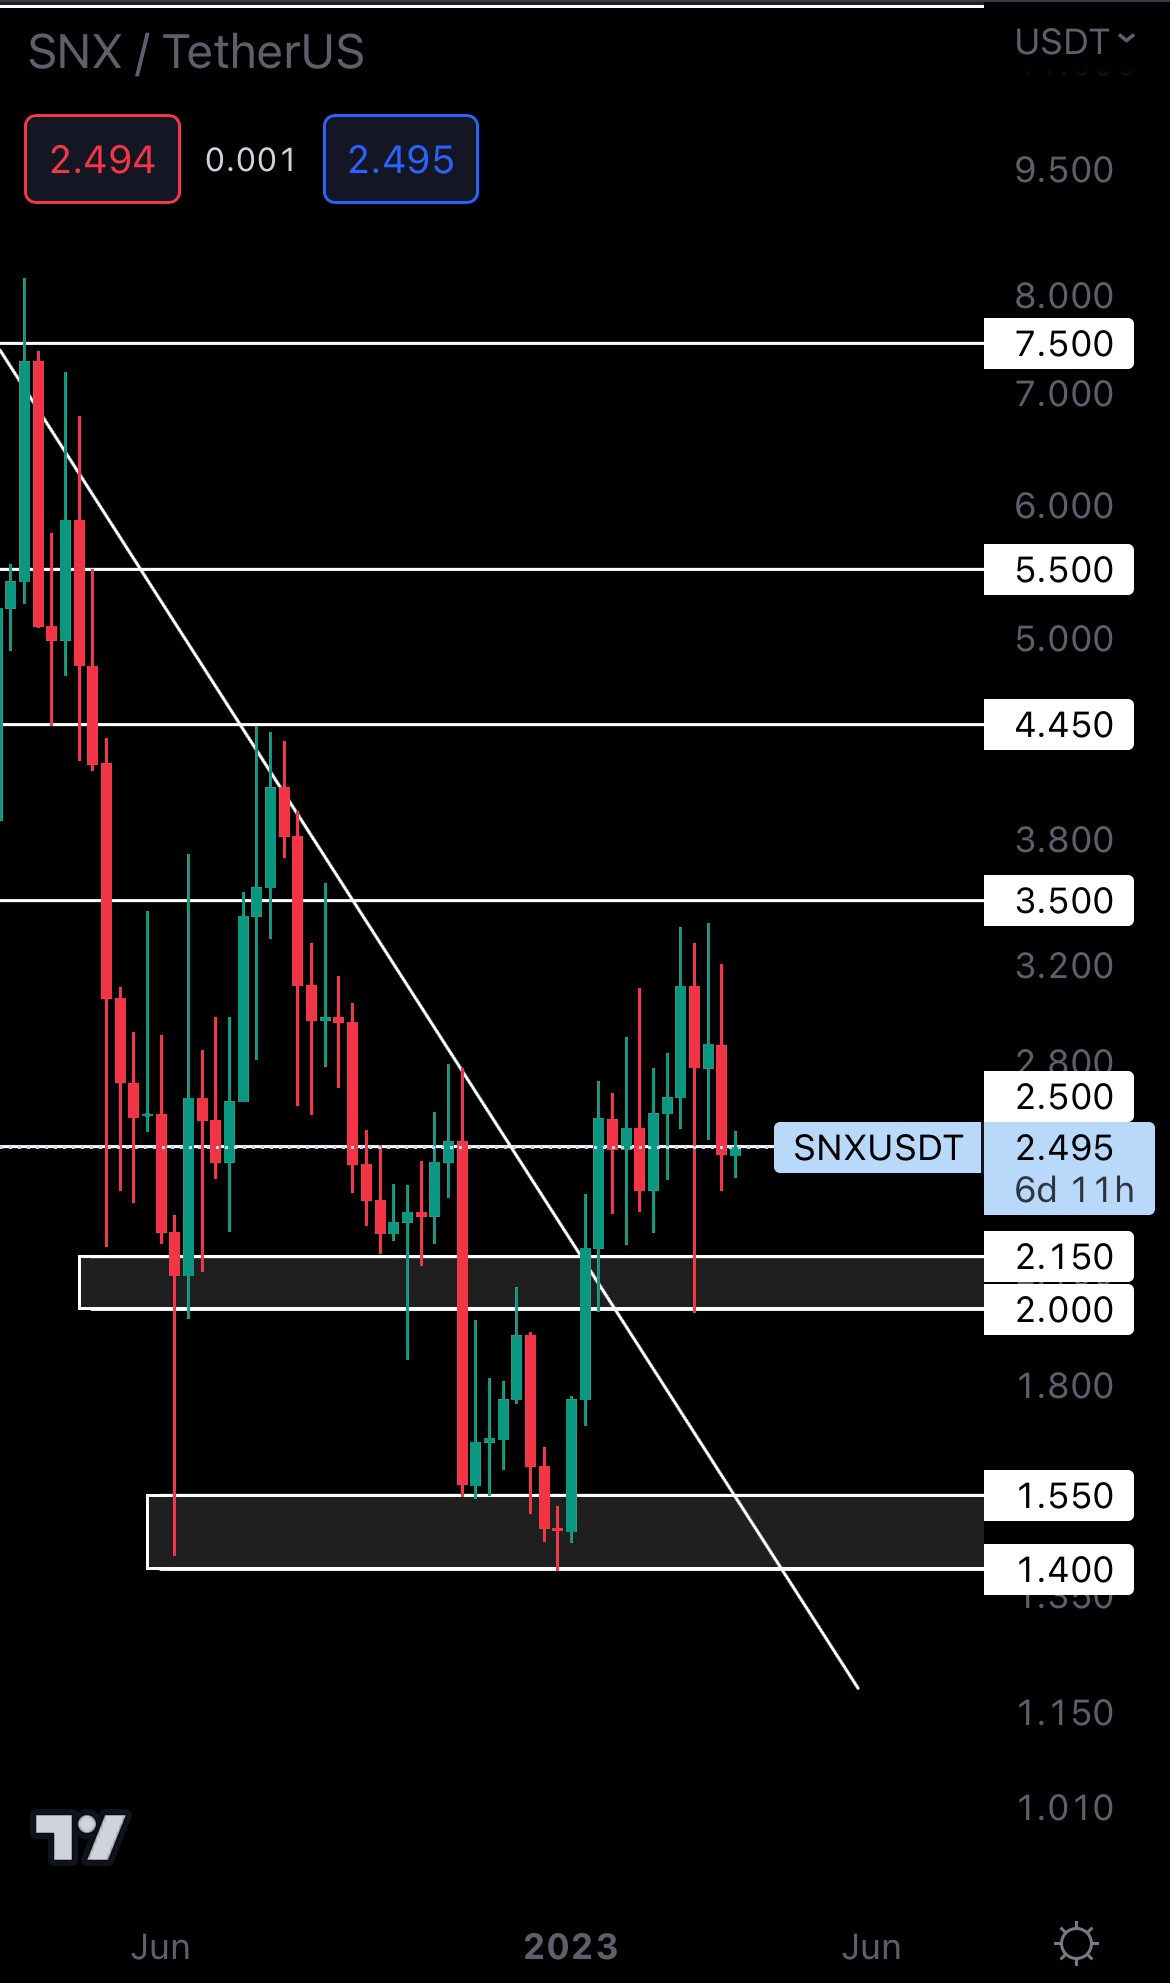 SNX closed under support ($2.50) last week. From a technical standpoint, it’s now heading to the $2.15 - $2 support area, which is also in confluence with the potential pullback we’re expecting for Bitcoin.
The above scenario would be invalidated if SNX closes a weekly candle above $2.50.
SYN | Synapse (Weekly)
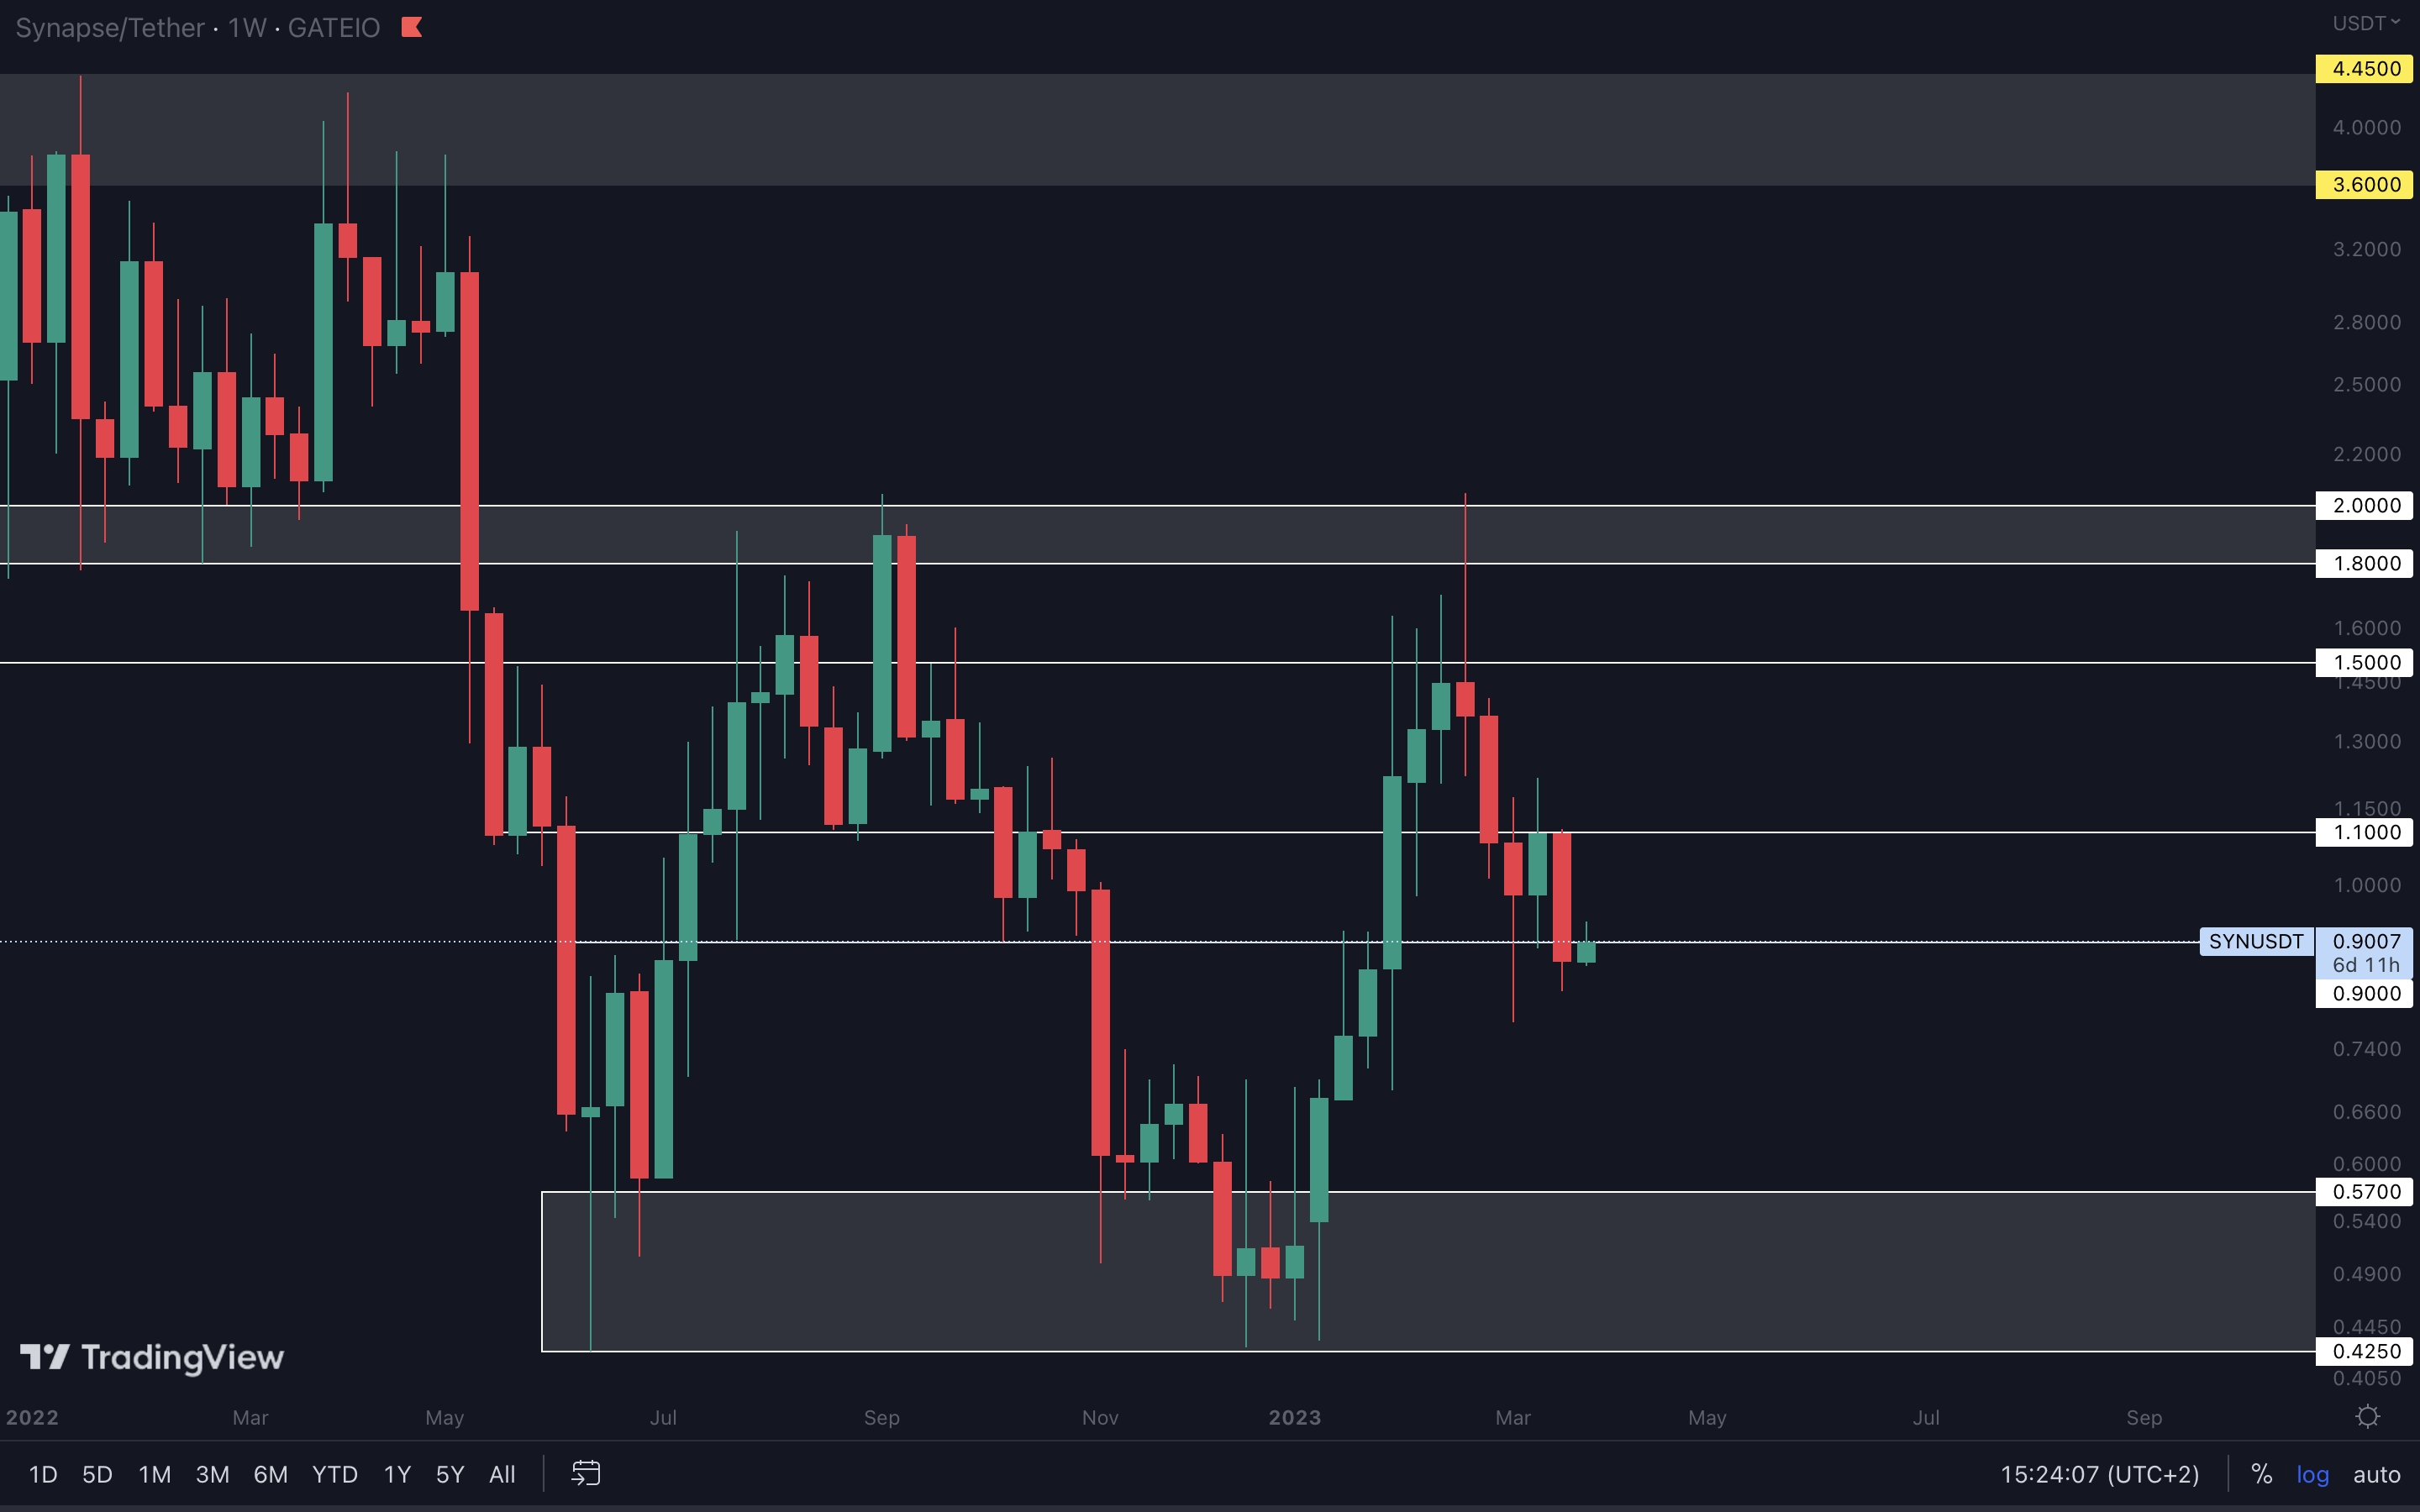
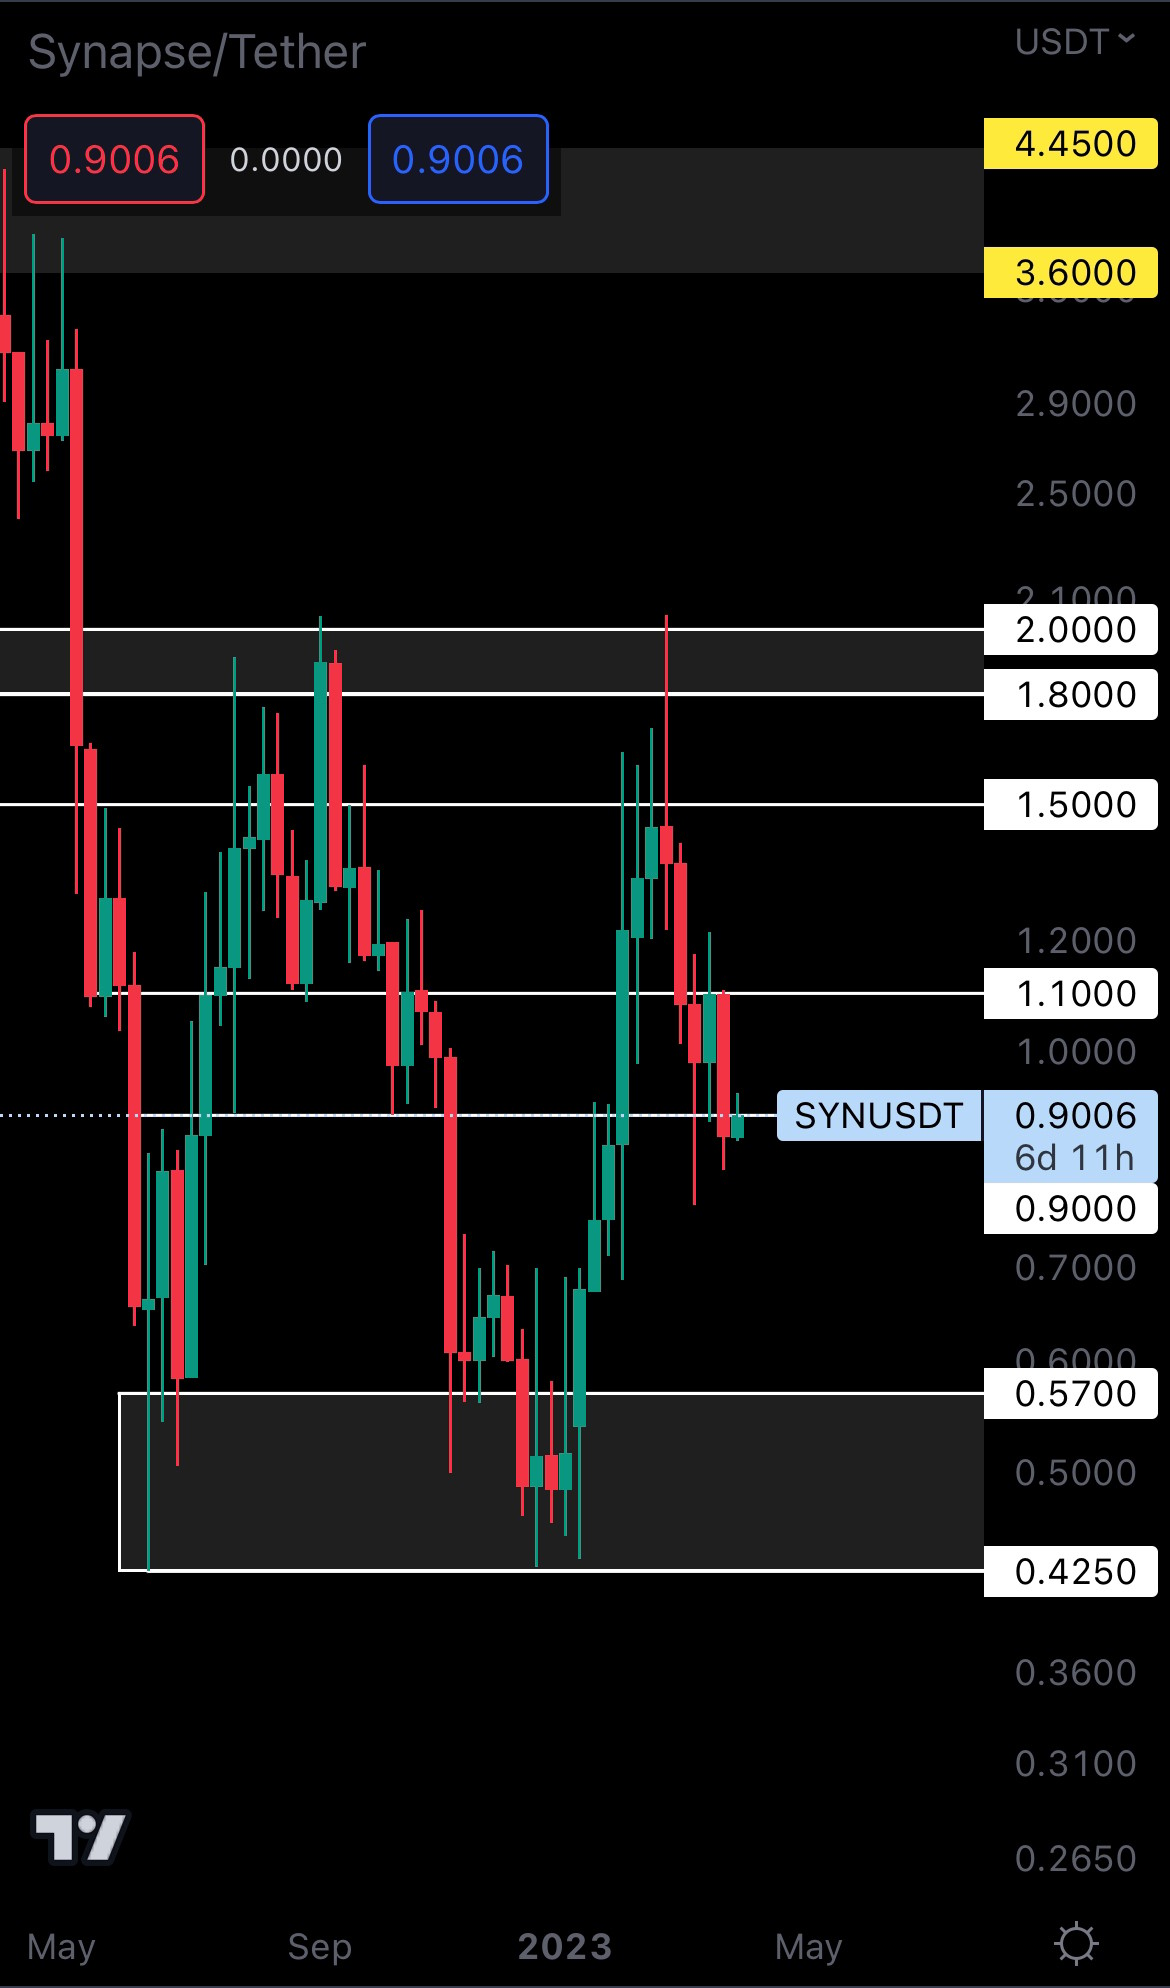 After failing to close above $1.10 two weeks ago, SYN got rejected and rapidly dropped to $0.90, closing a bearish engulfing candle under this level.
We now expect SYN to head toward $0.57. It’s a big drop (~30%), so we’re not really confident it will actually reach $0.57. Instead, a local bottom might form in mid-range (between $0.90 and $0.57), from where the asset could continue to rise.
MINA | Mina Protocol (Weekly)
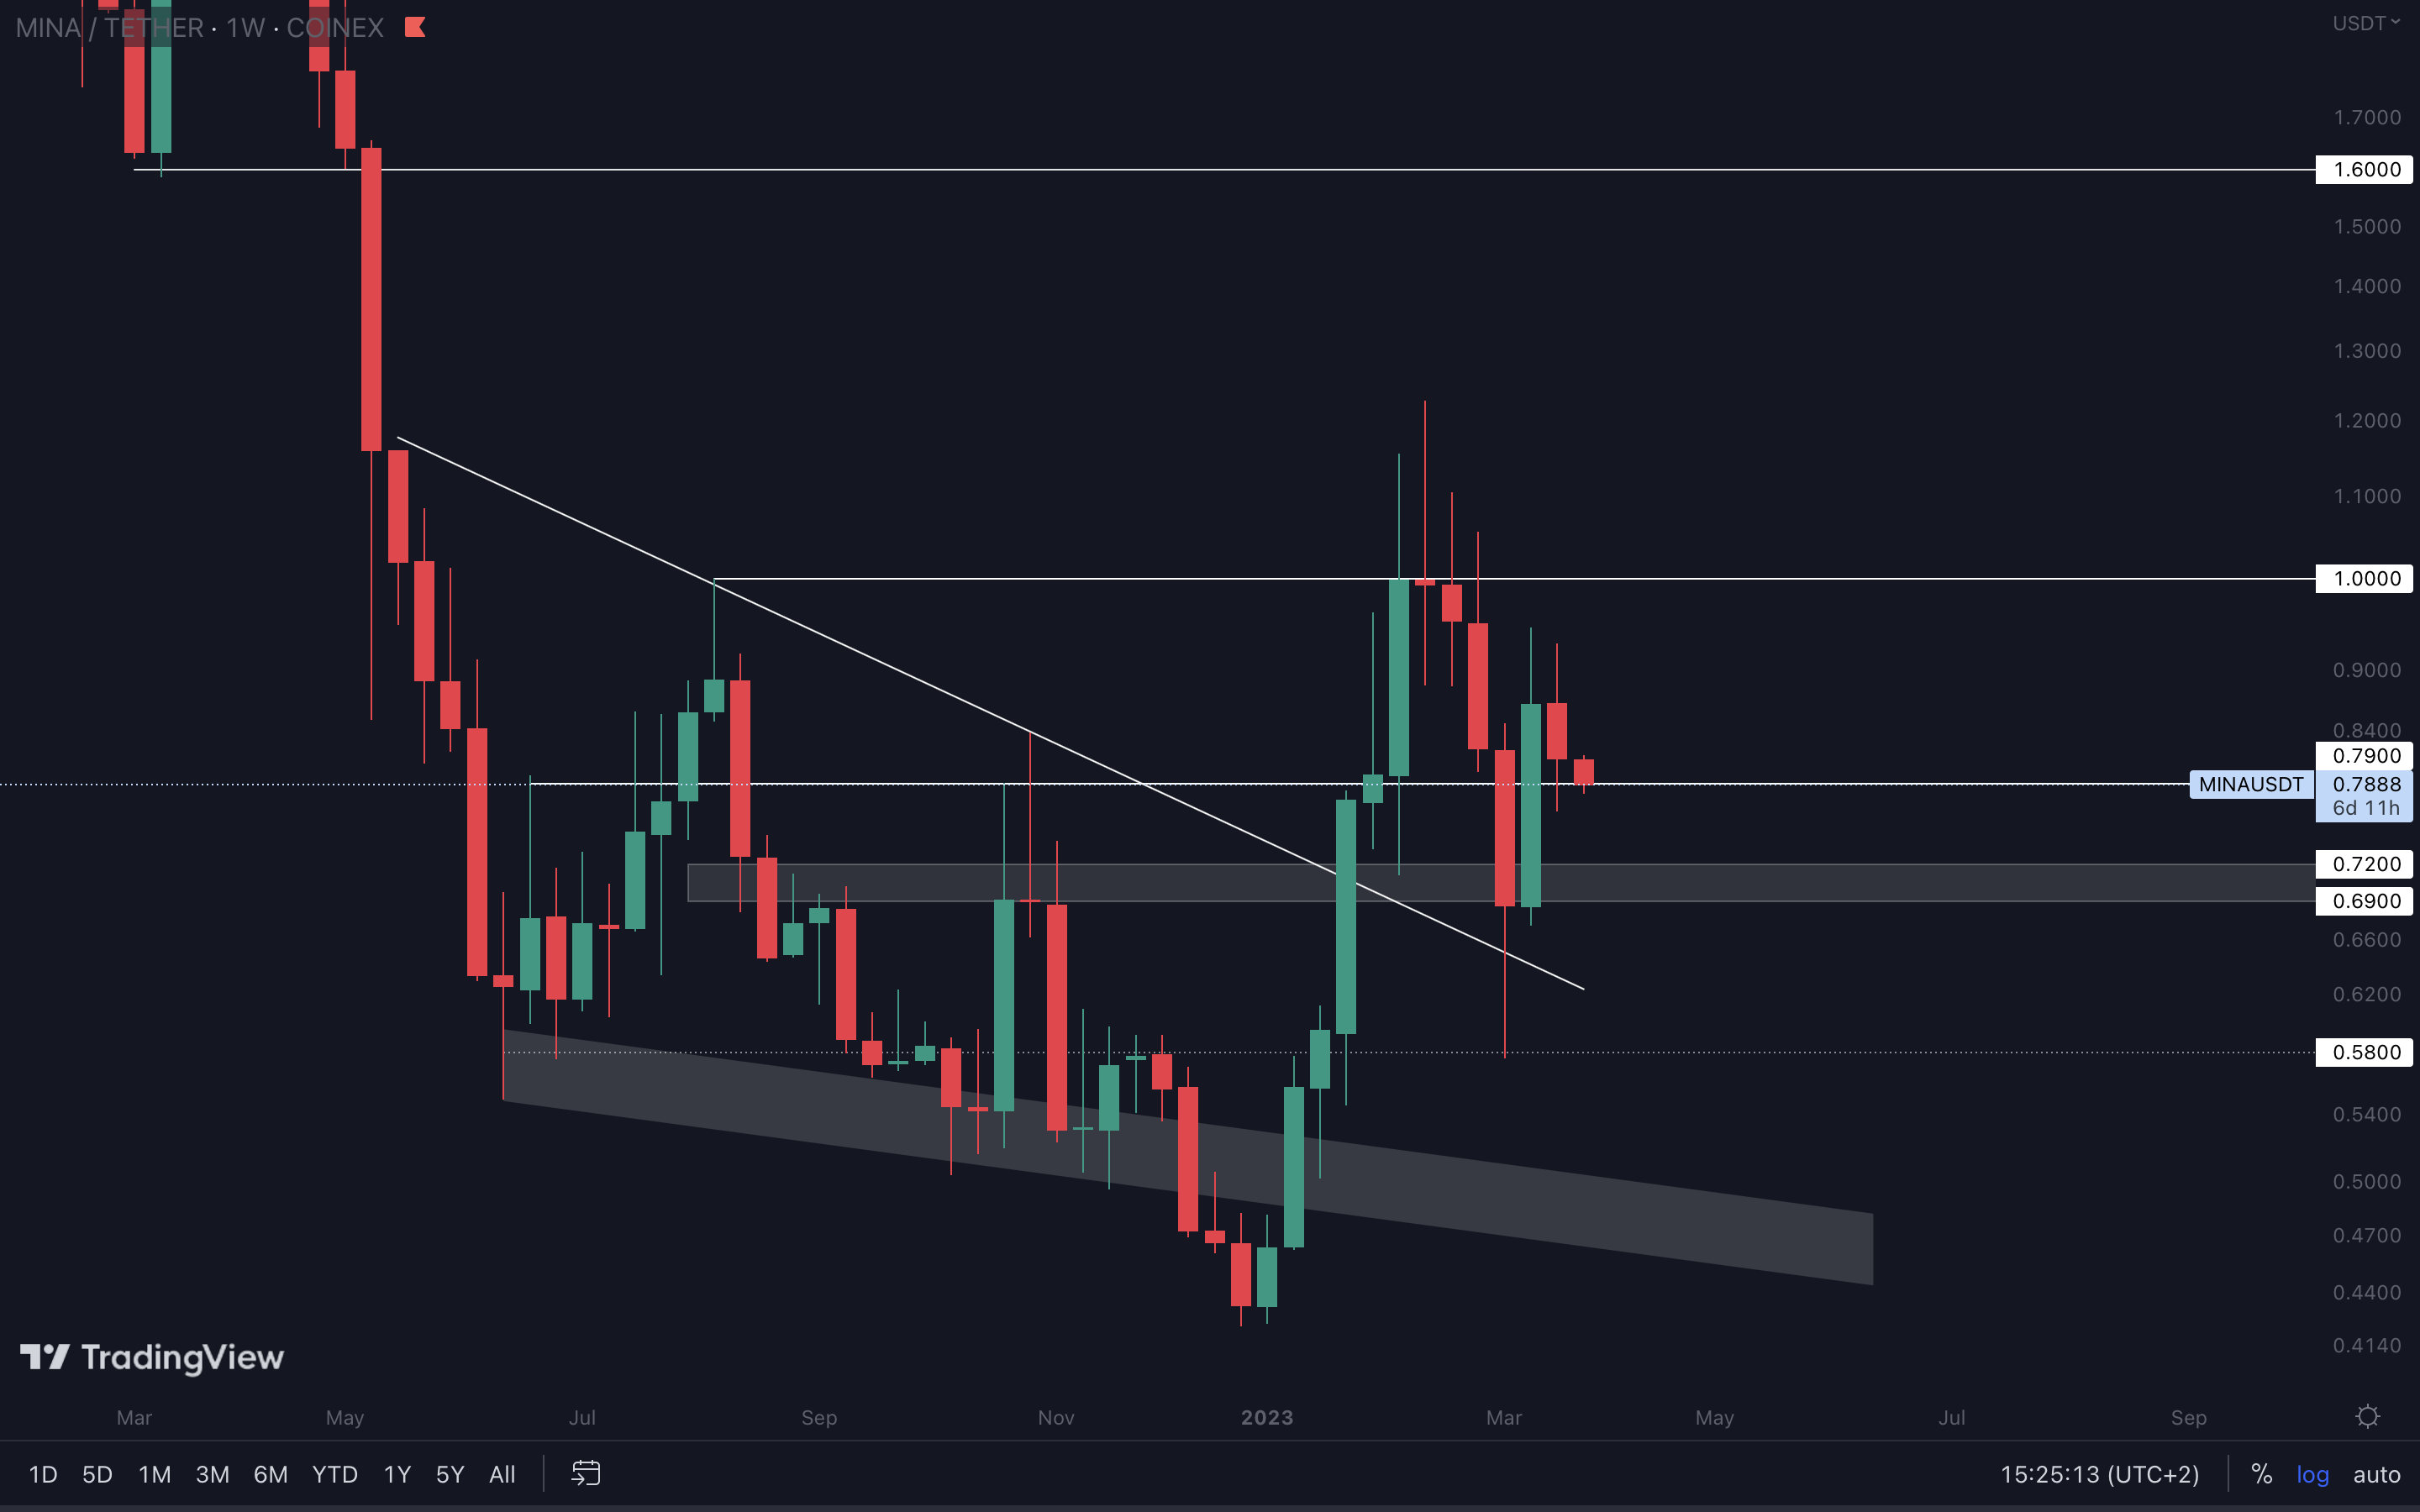
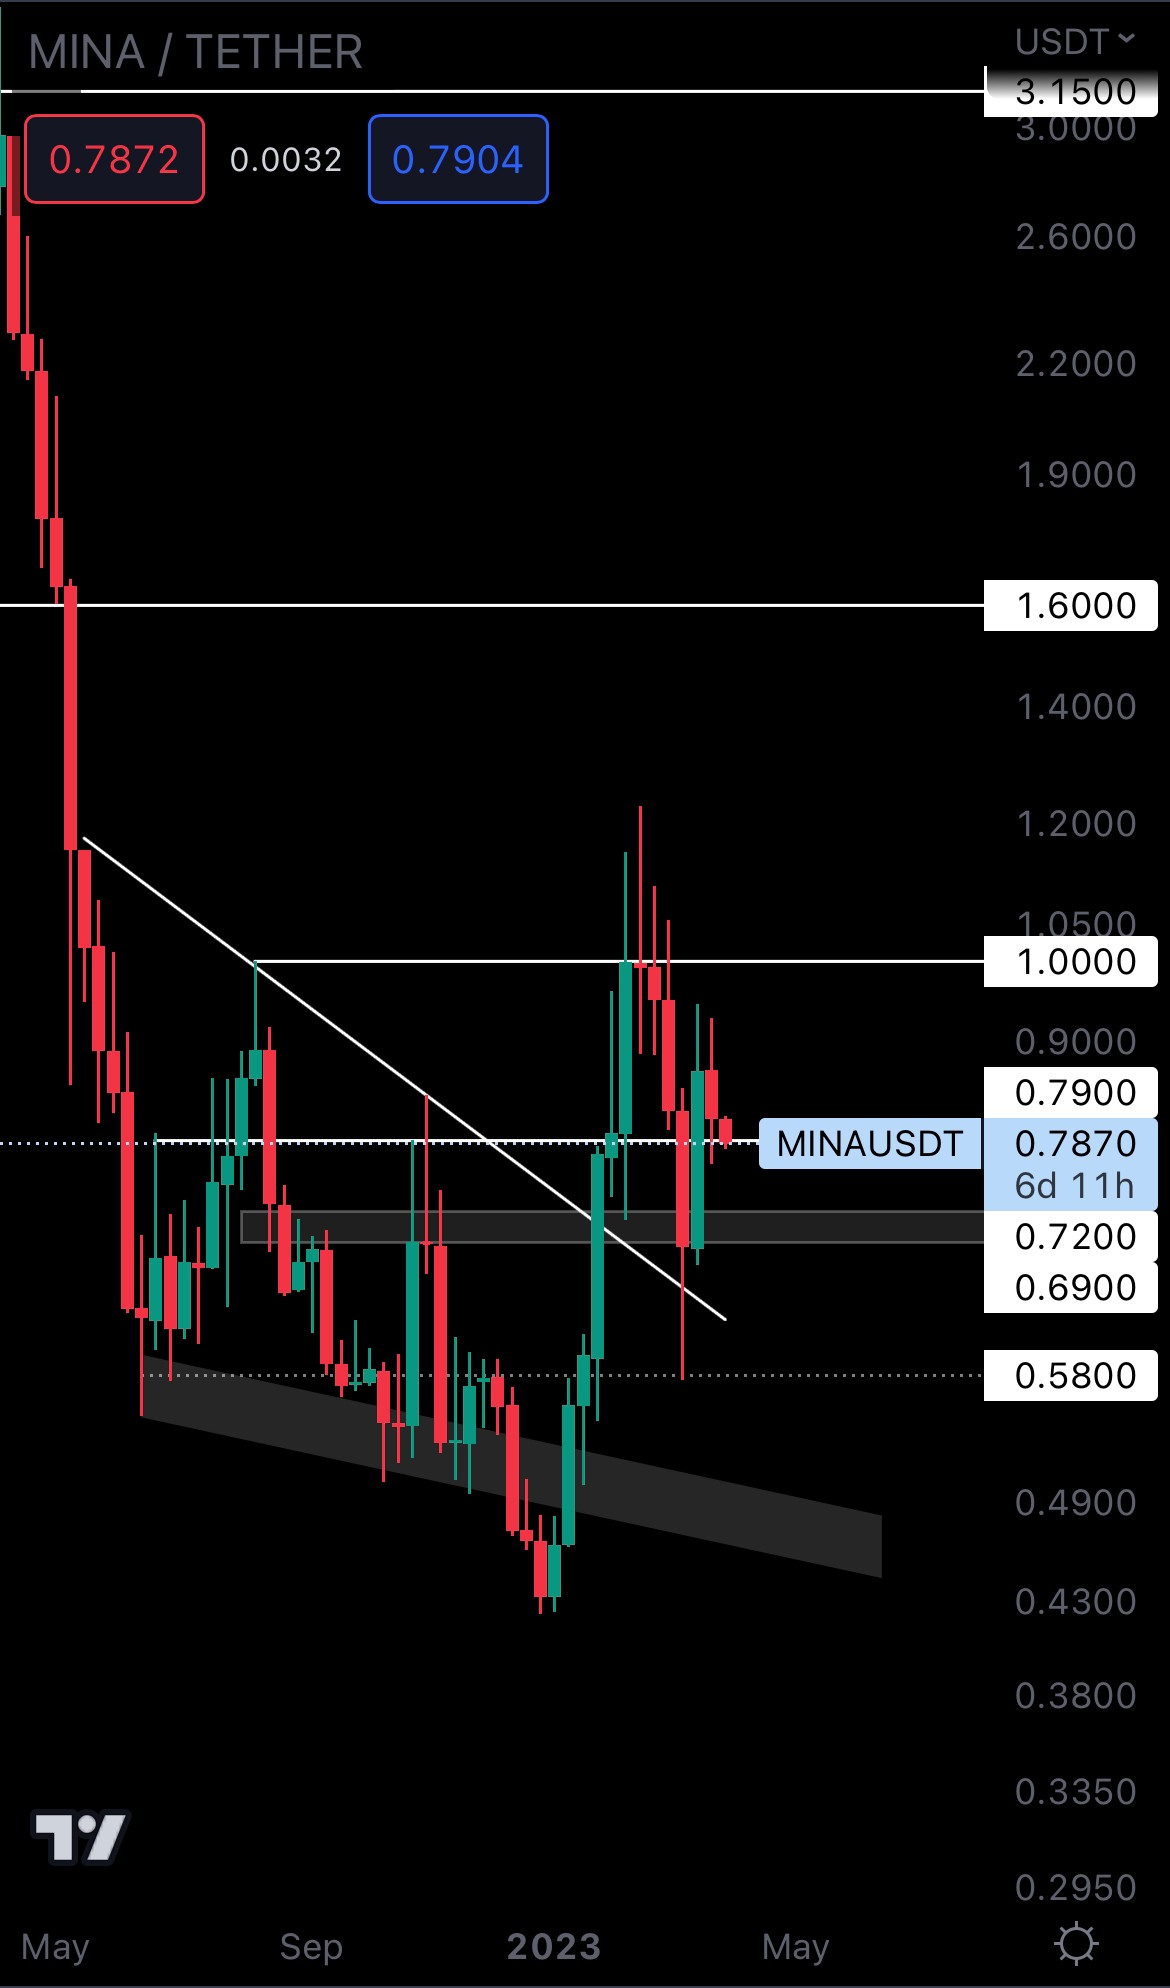
MINA closed above support ($0.79). Although this prevents downside from a technical standpoint, Bitcoin retracing to $25,150 would result in MINA losing $0.79 as support. For that reason, we don’t recommend jumping on this yet, but instead waiting until Bitcoin chooses a direction.
ASTR | Astar Network (Weekly)
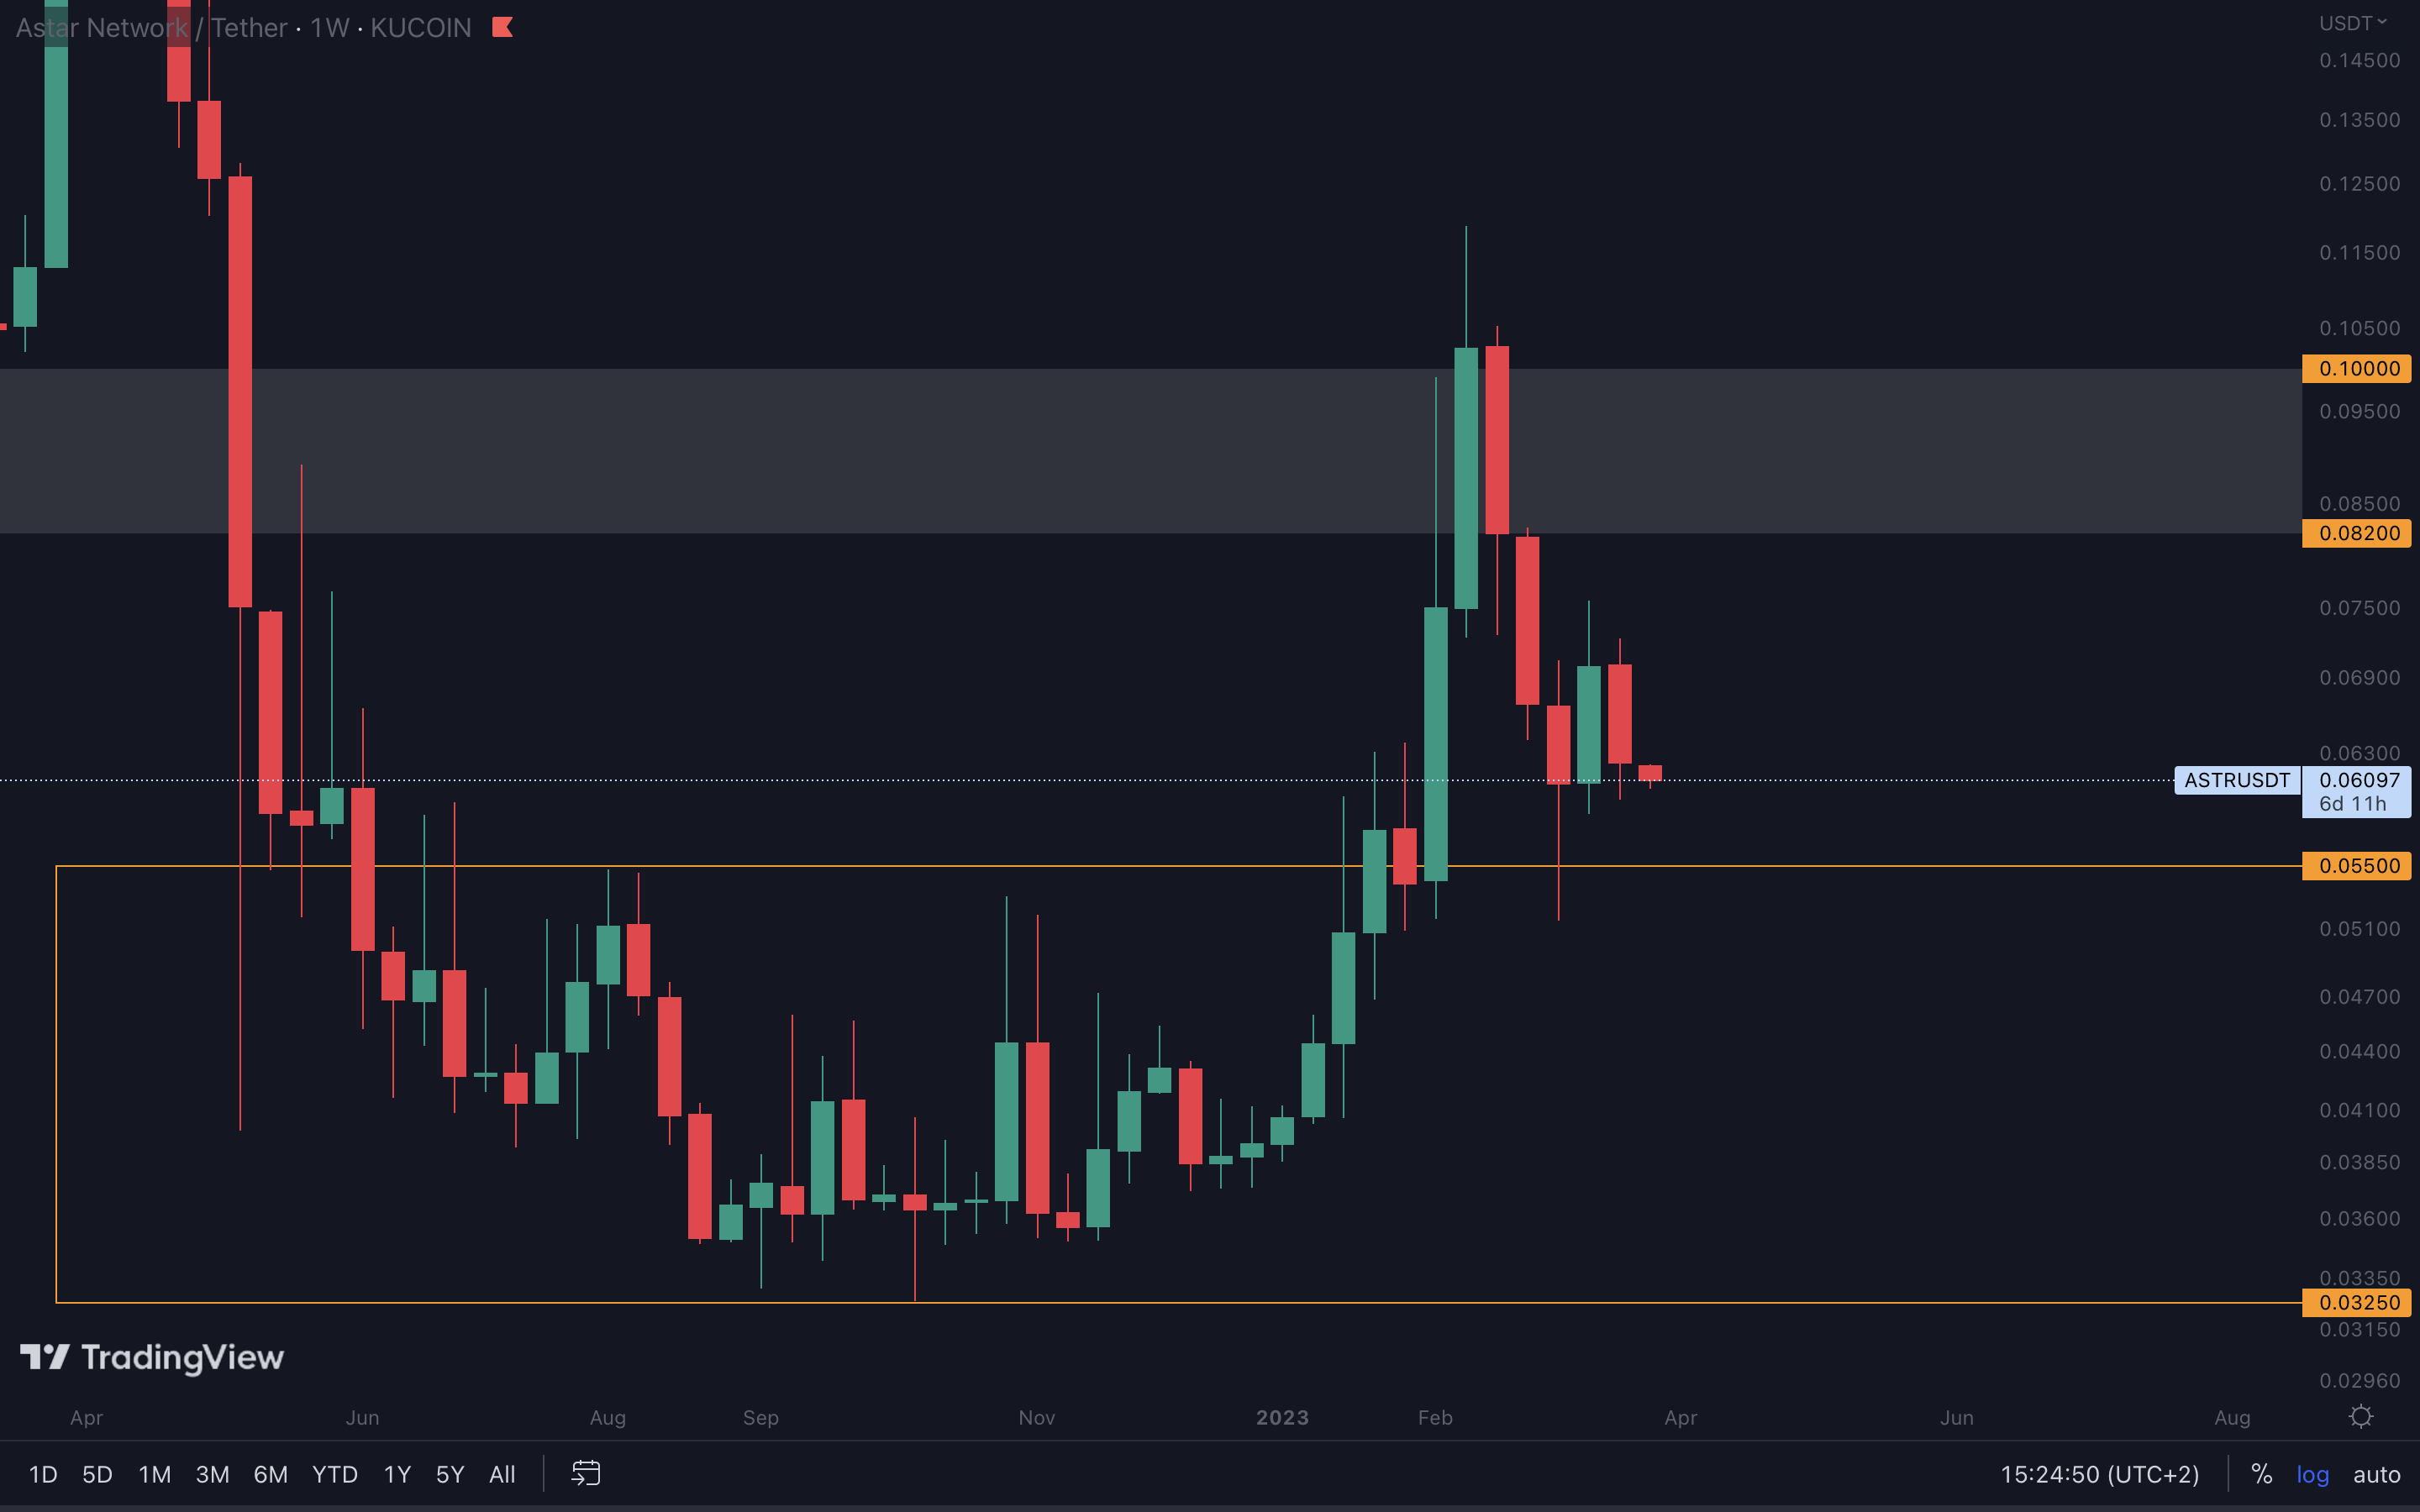
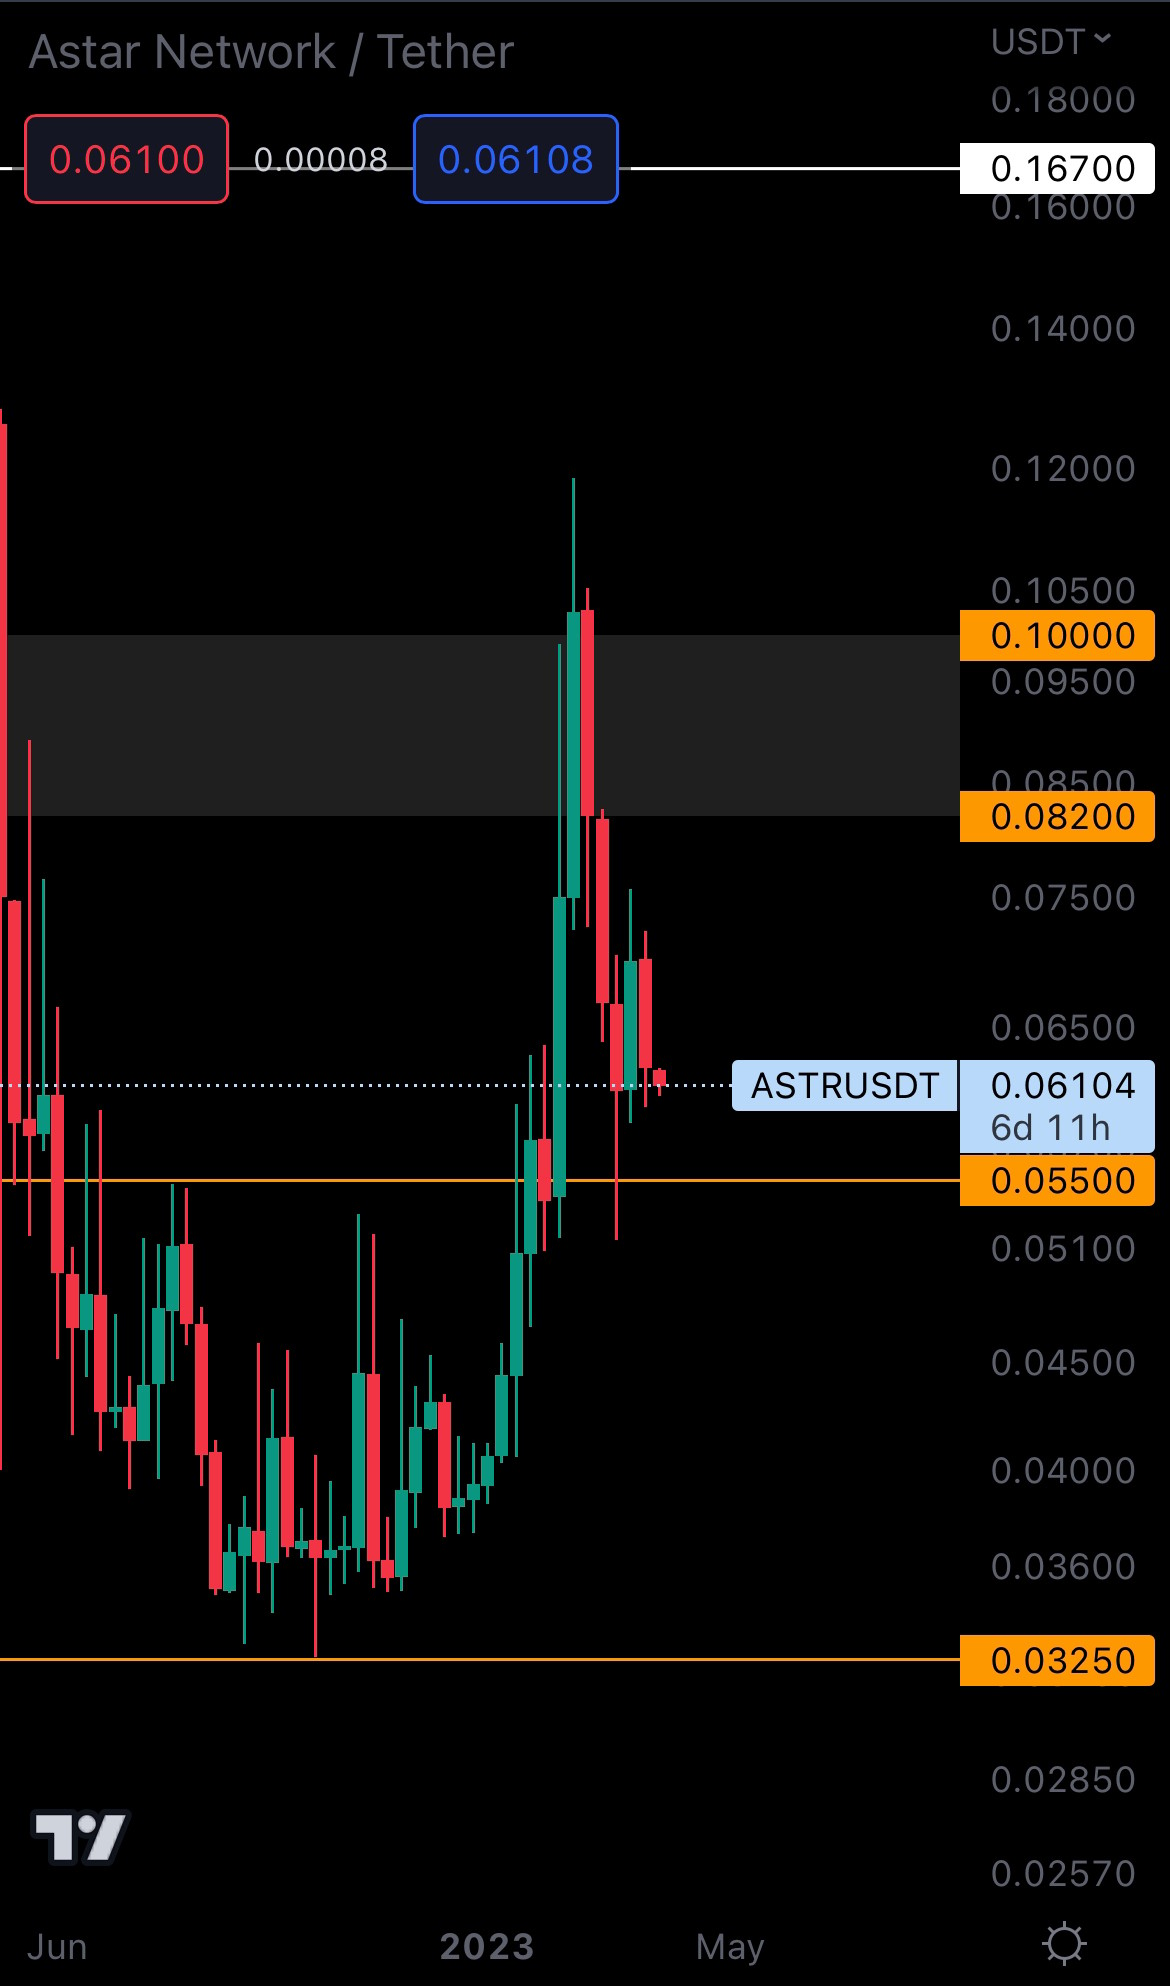
As long as $0.5500 isn’t lost as support (weekly closure under required), we’re confident that ASTR will reach the $0.082 - $0.10 resistance area in the coming months. In the meantime, we could see ASTR come back down to retest $0.5500.
THOR | THORSwap (Weekly)
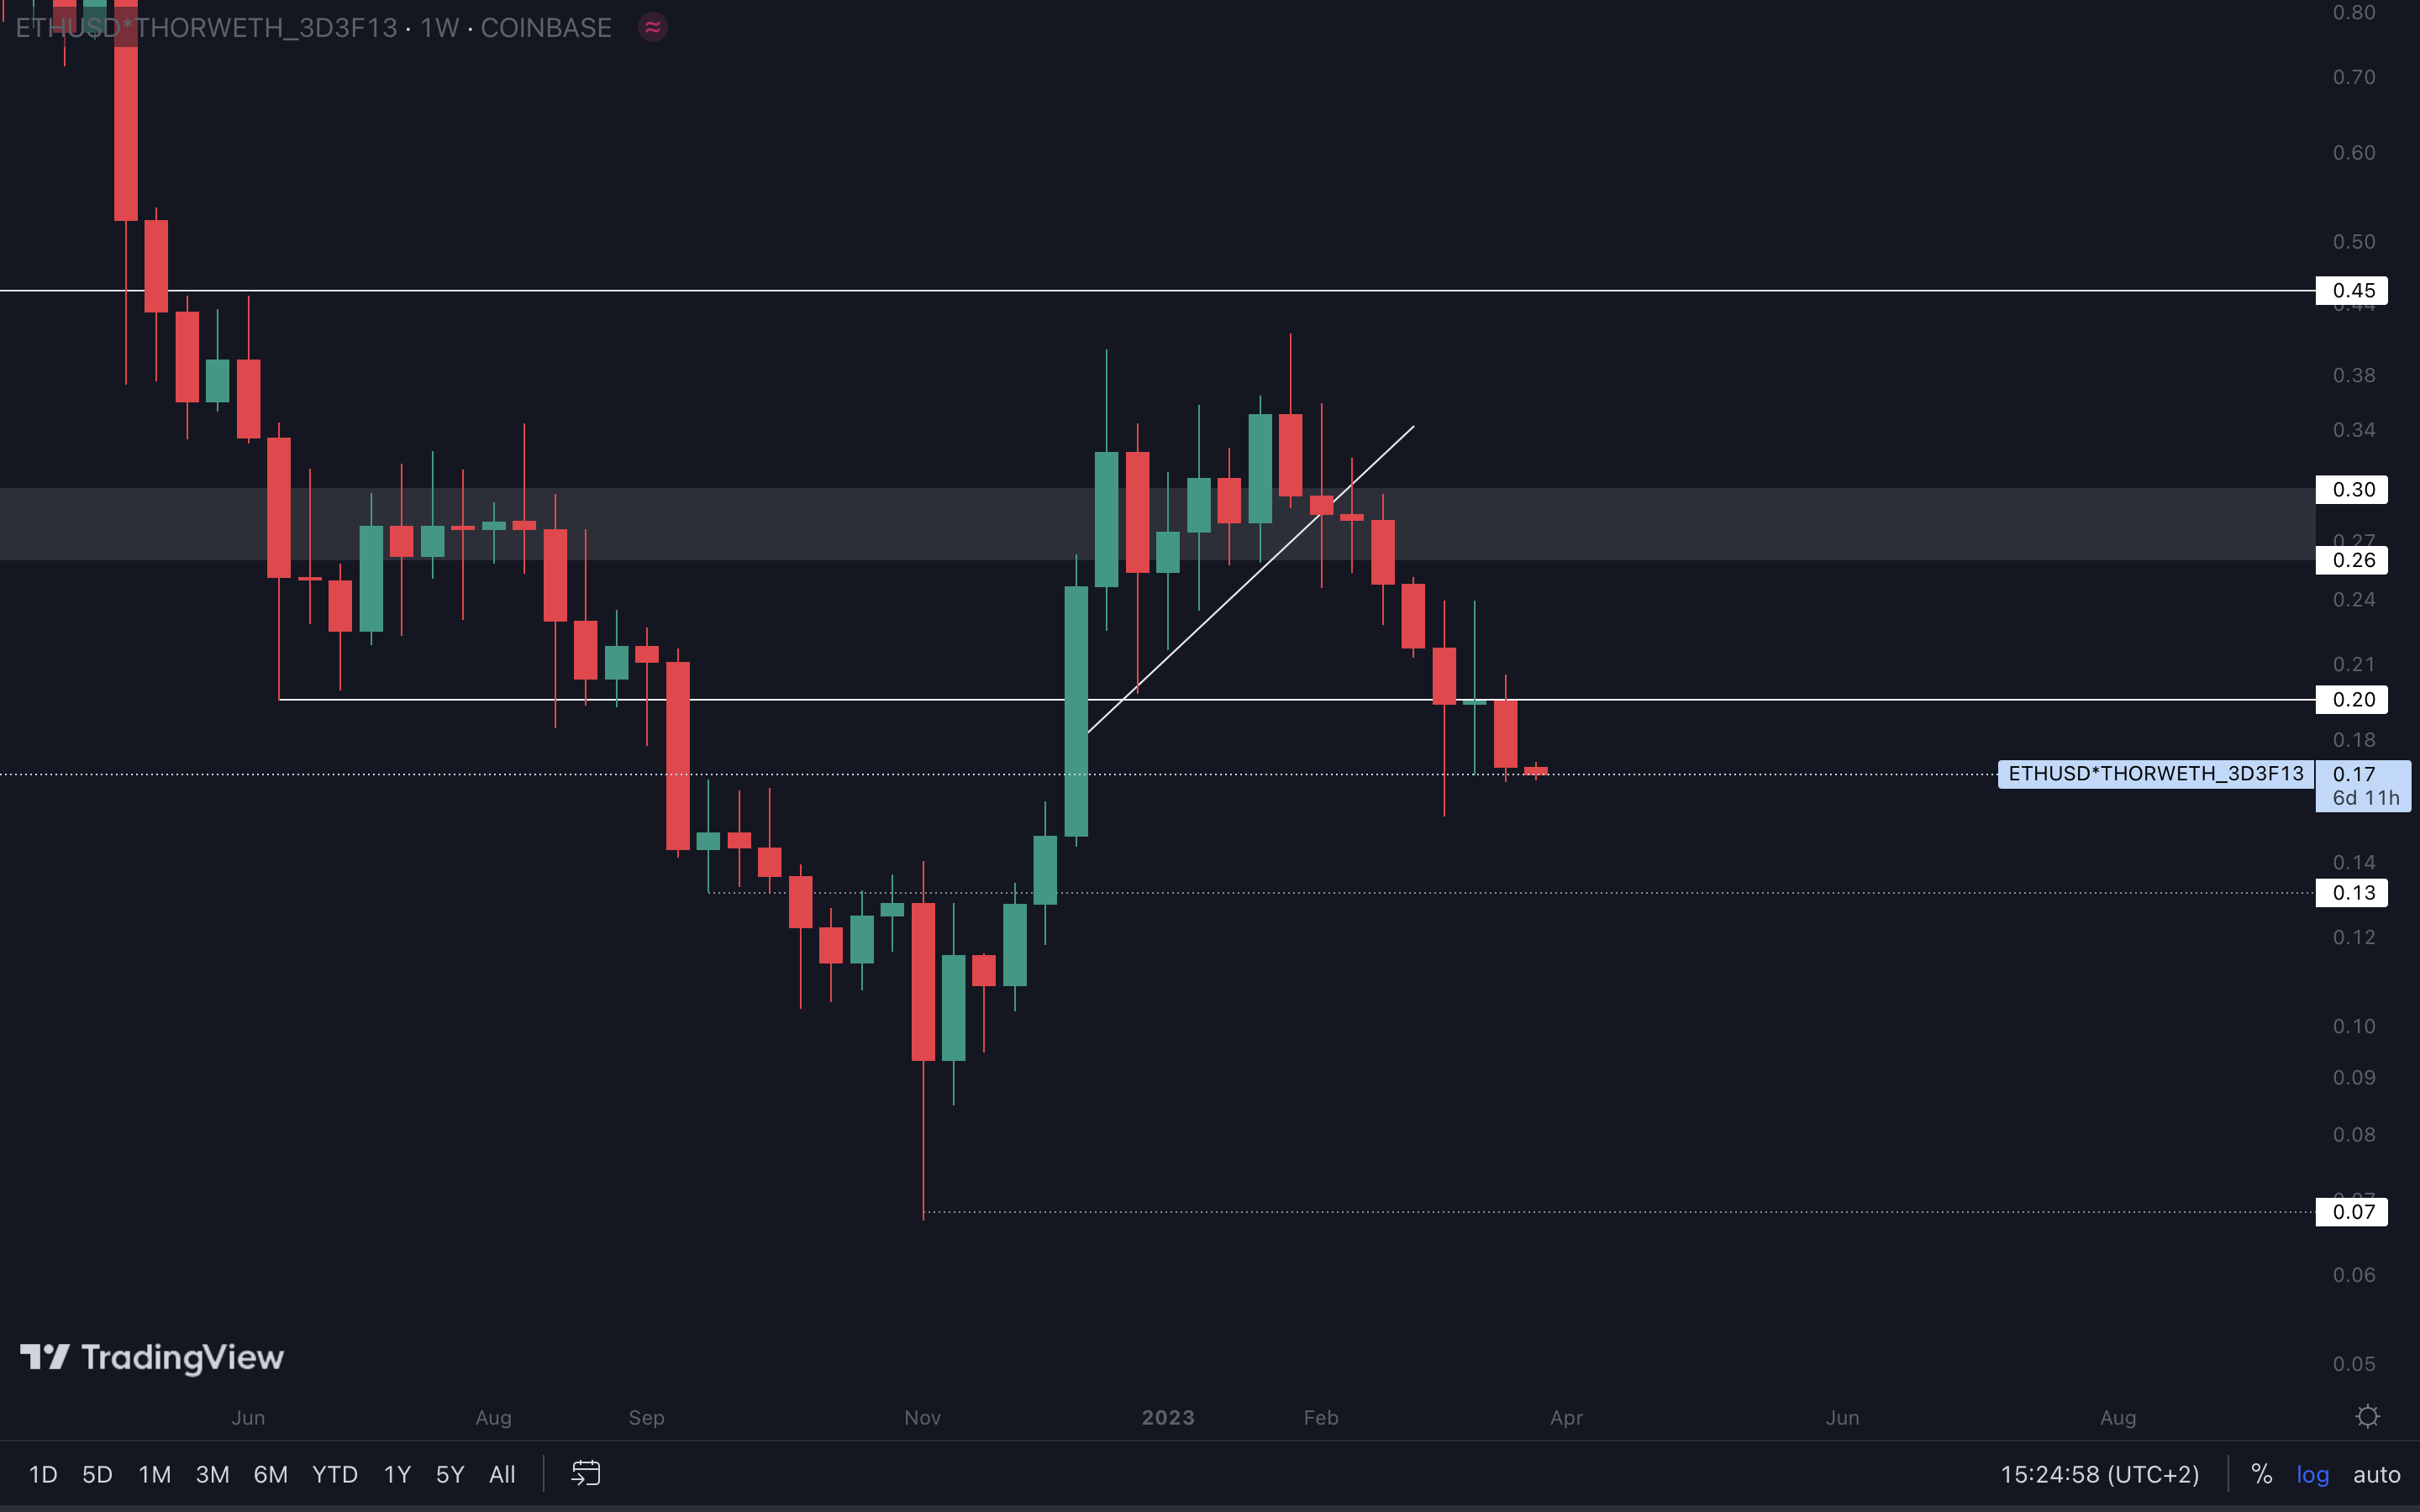

THOR has been in a downtrend for over 50 days, and that doesn’t seem to be stopping just yet. Last week, THOR was rejected from resistance ($0.20), confirming a move to $0.13. Given its recent performance and its lack of buying pressure (THOR didn’t go up, even when the rest of the market did), we believe $0.13 will be reached in the coming weeks.
OP | Optimism (Weekly)
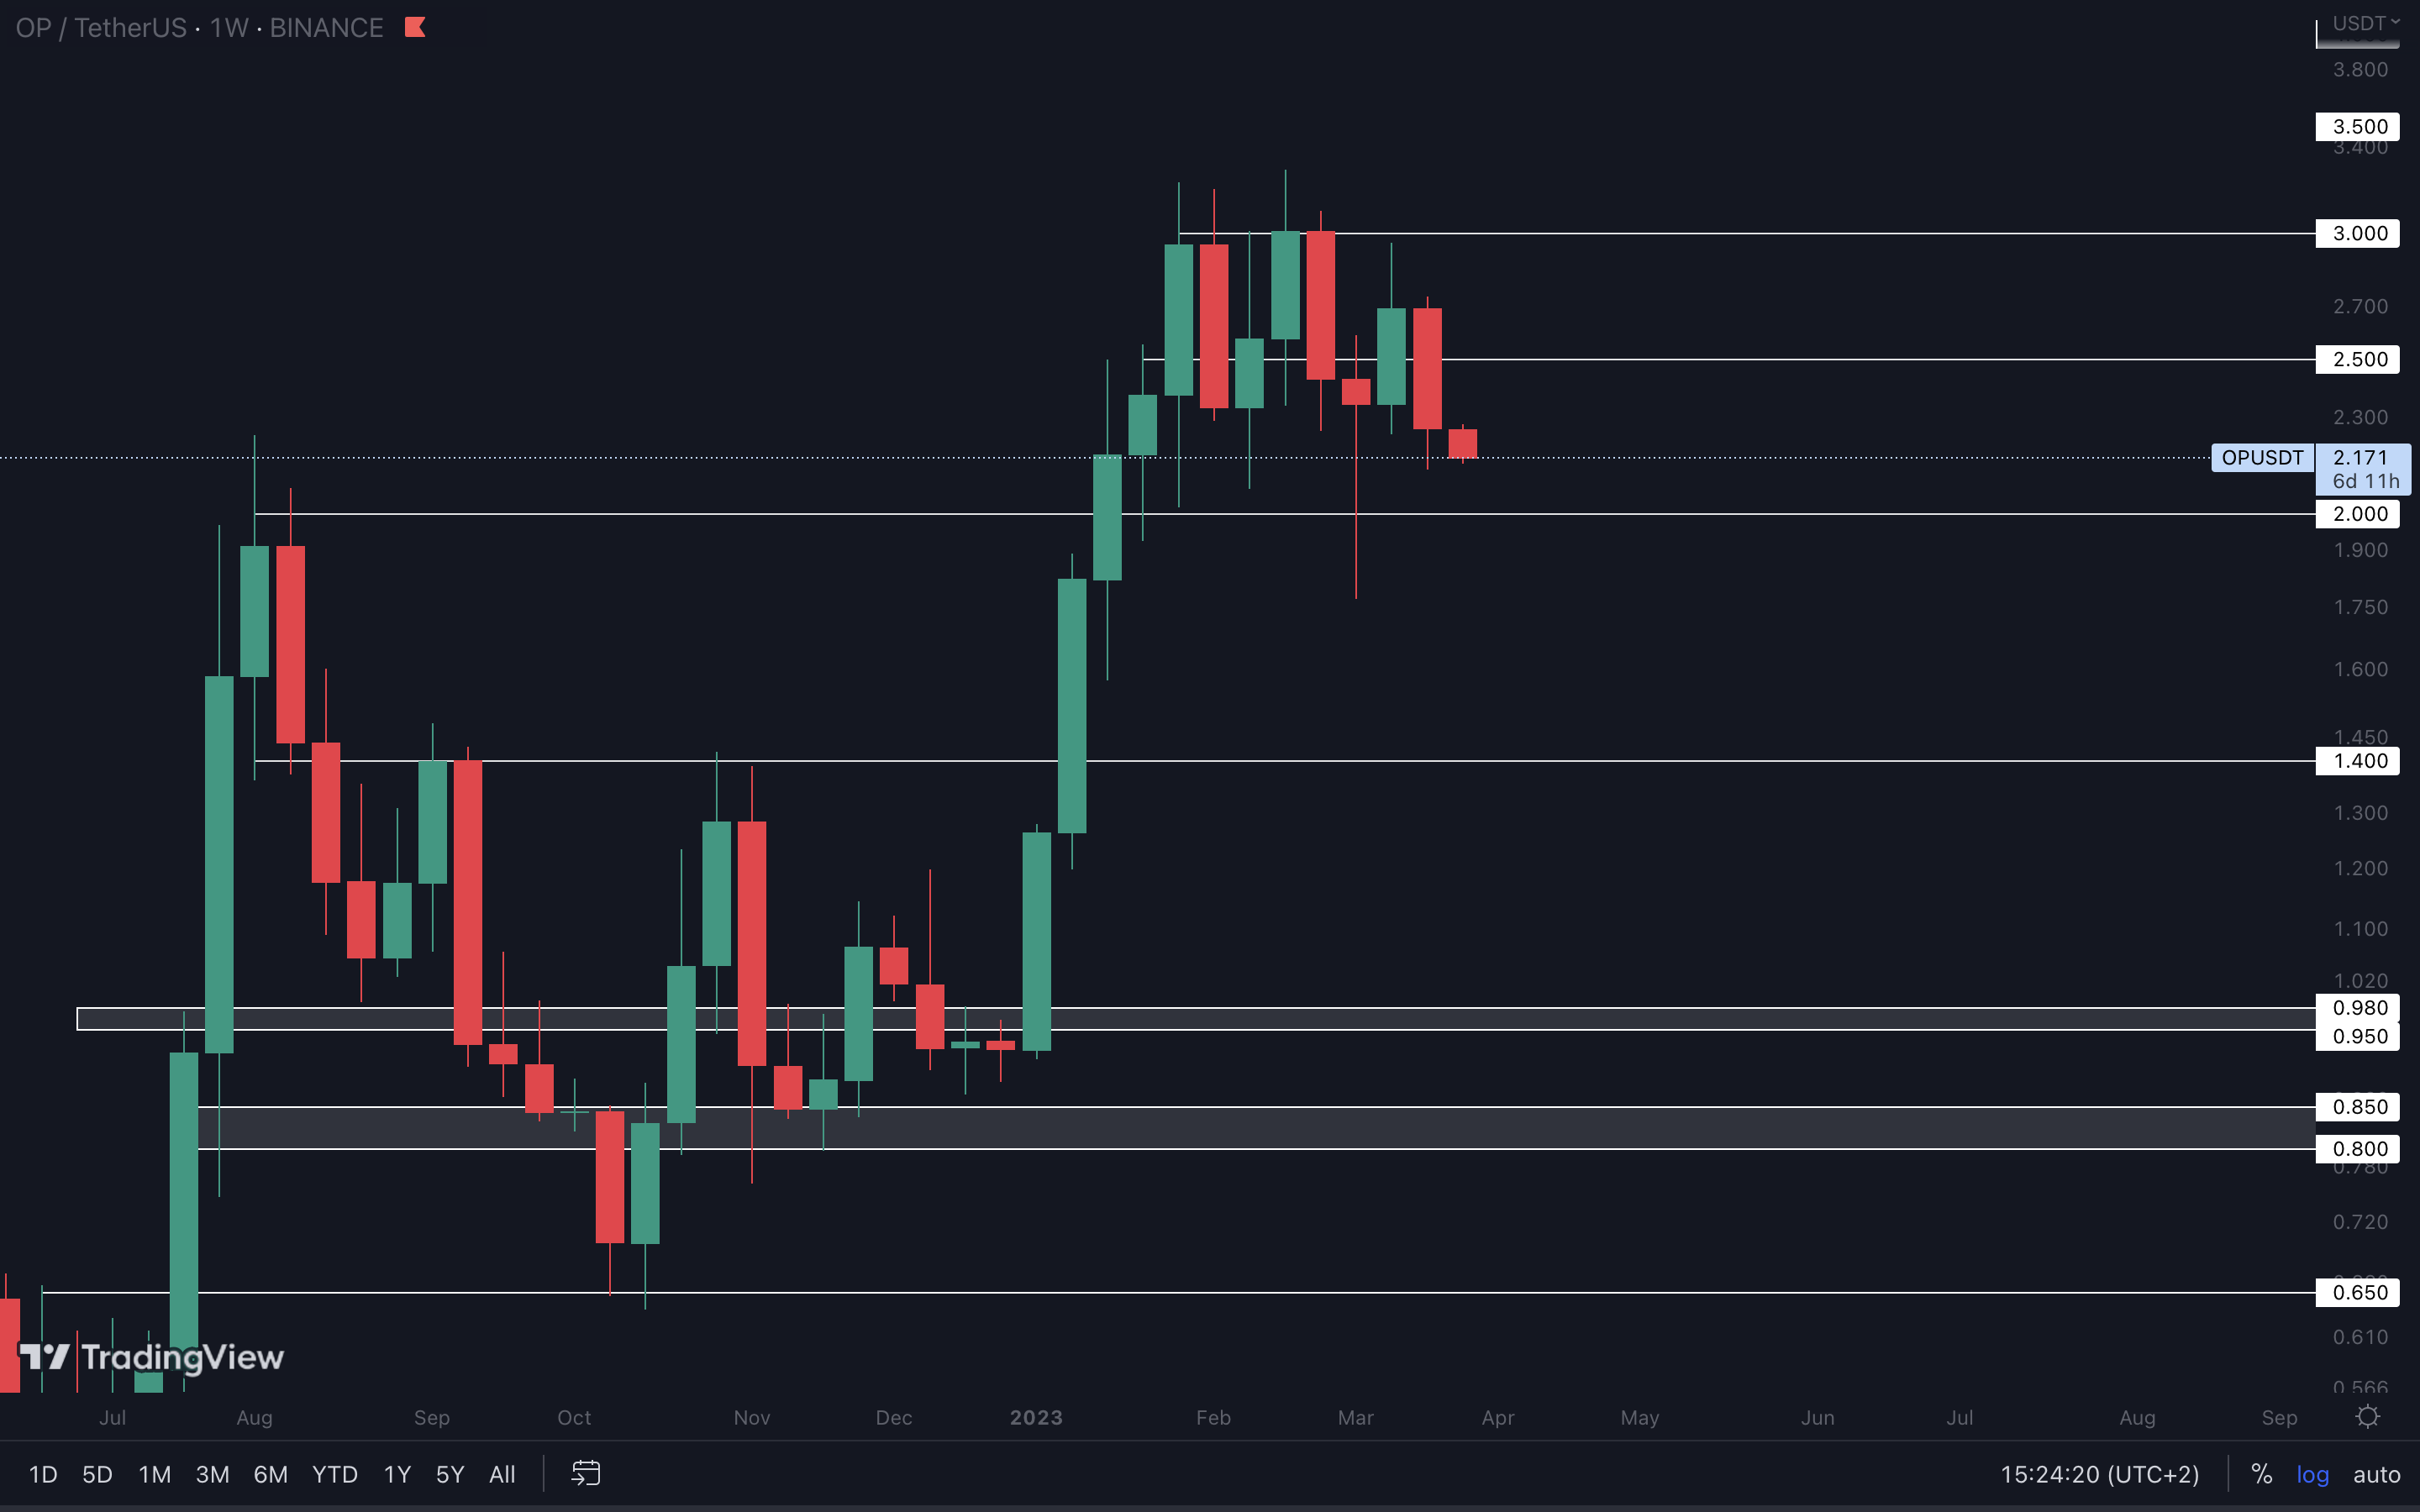
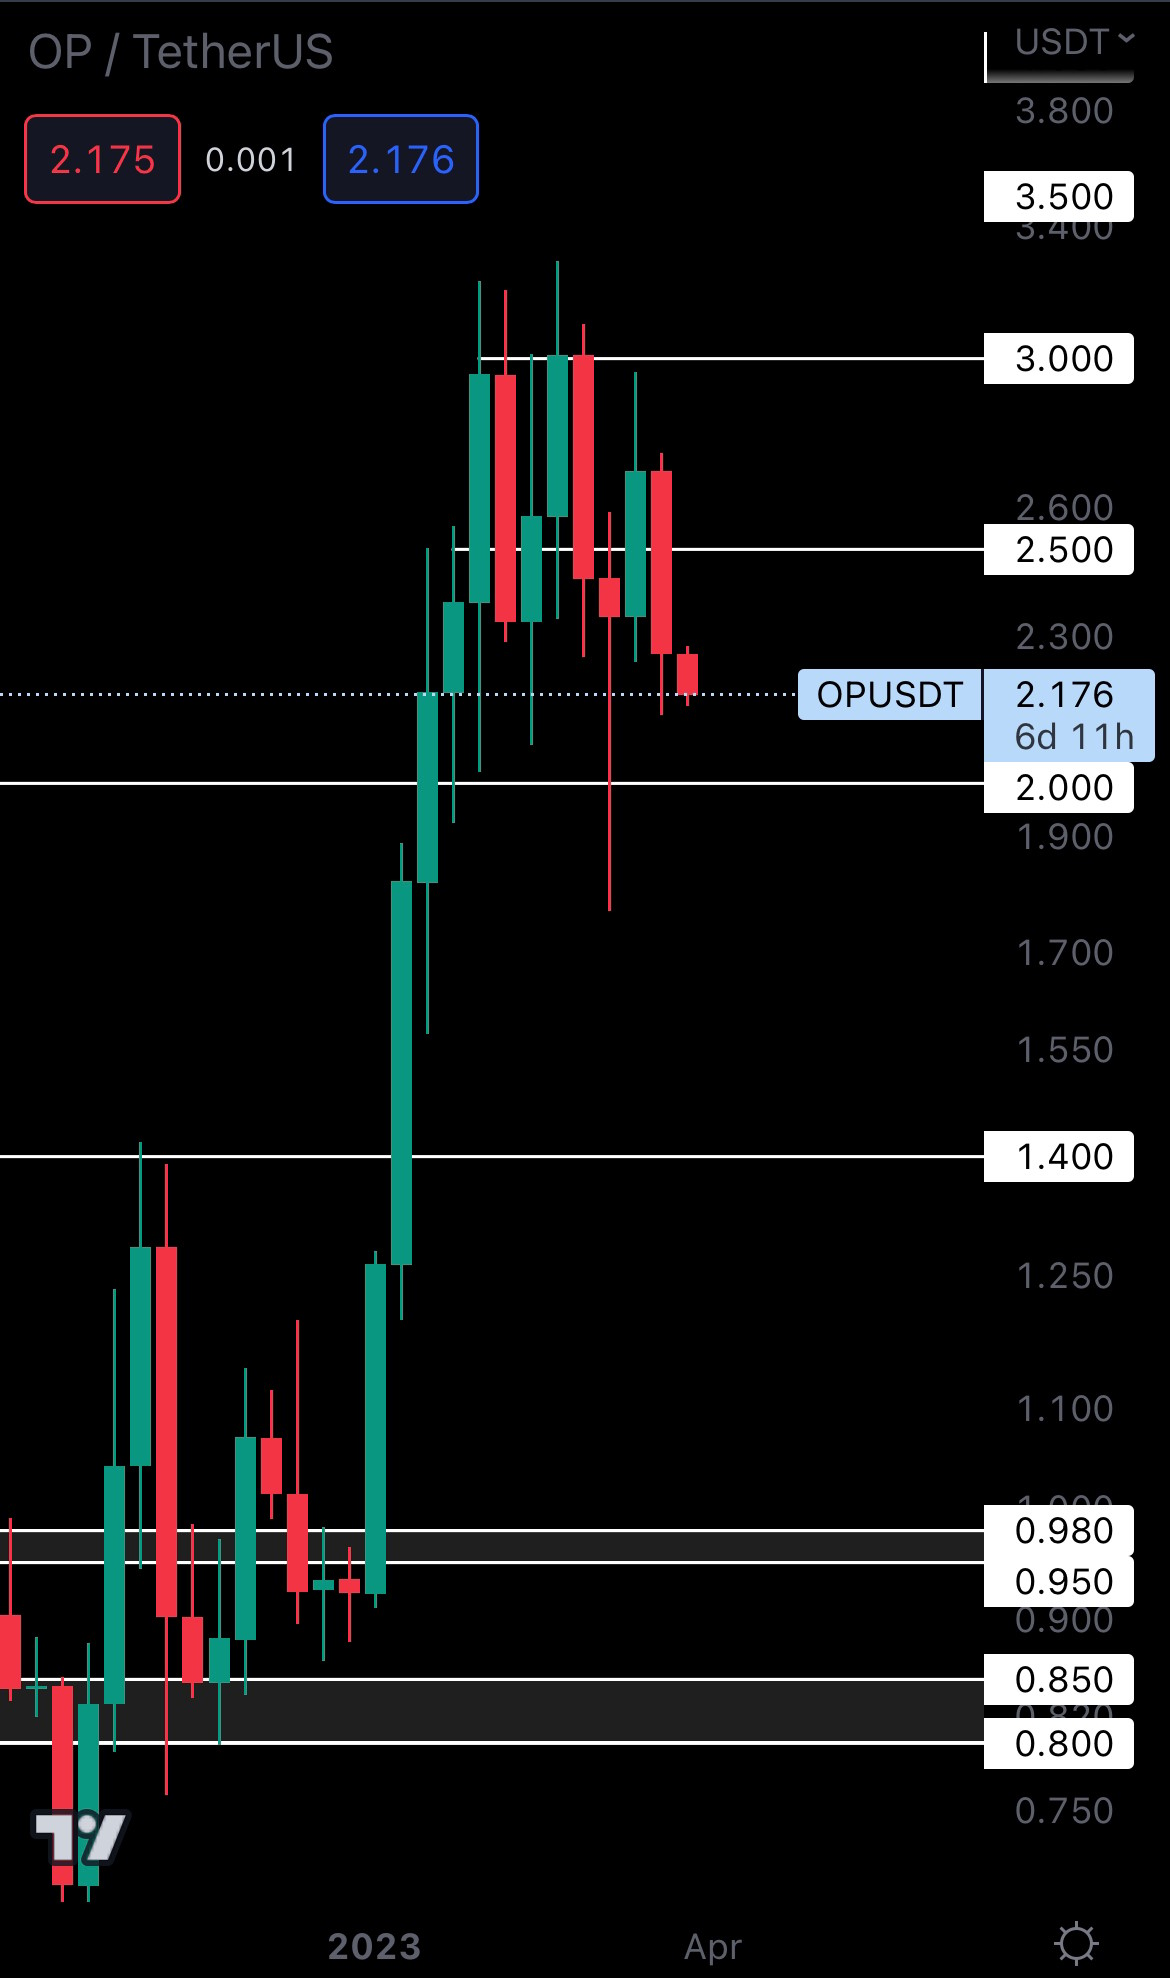
OP is aiming for further downside. Last week’s candle closed as a bearish engulfing under support ($2.50). This opens the door for $2, a level we might see tested in the coming week(s). This would provide a solid entry point for a short-term trade, but keep in mind that OP is a volatile asset - a sudden change in Bitcoin’s price could see OP go off the rails.
Cryptonary’s take
We’re standing our ground - a pullback is coming. In the meantime, the best thing you can do is sit on the sidelines and prepare to get in lower. If that doesn’t happen and the market goes up, avoid FOMO at all costs. The goal is to make money, not lose it.Action points:
- We don’t recommend entering any longs at this time, or even buying at these levels. The market will likely go lower, so it’s best to stick with shorts.
- Securing profits is a wise choice. The market already gave us some amazing returns, so take advantage of that.
Recommended from Cryptonary


