Save 23% ($351) & Get a Free 1-1 Call with our Team ⏰ : 0d 2h 59m 44s
Market Direction
Disclaimer: This is not financial or investment advice. You are responsible for any capital-related decisions you make, and only you are accountable for the results.
- SPX is looking interesting from a TA perspective here.
- The key zone of support for SPX is between $0.57 and $0.60, the price of which is now above, and the price also used this level as support on the first pullback.
- The resistance area for the price is between $0.72 and $0.75, but the price is now also contending with the main downtrend line as a resistance.
- If the price can clear above the main red downtrend line and the horizontal resistance of $0.75, then a retest of the highs is likely on the cards following that more major breakout.
- Volumes were downtrending. However, they have now stabilised, so that's positive.
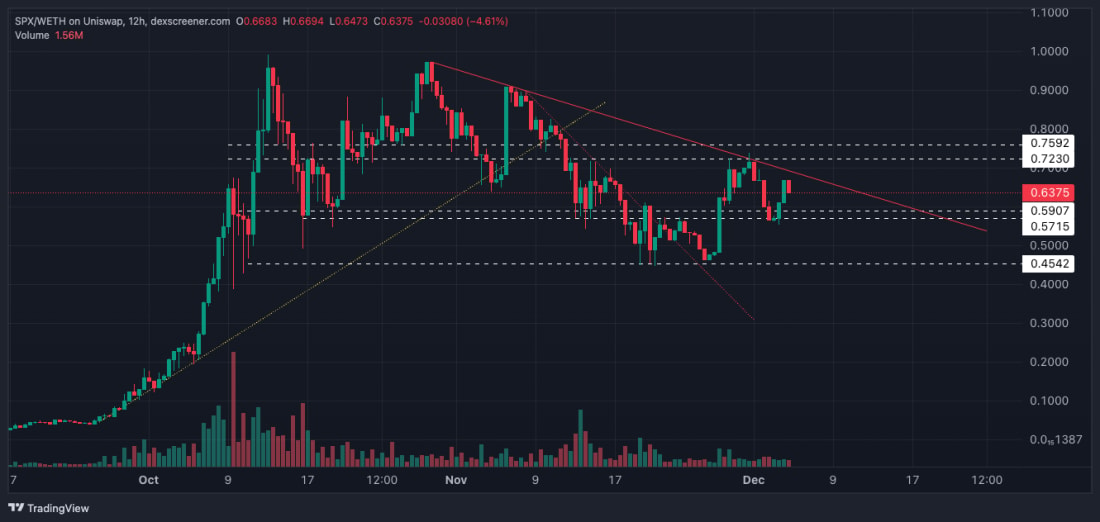
- Next Support: $0.60
- Next Resistance: $0.75
- Direction: Neutral
- Upside Target: $0.75 (then $1.00)
- Downside Target: $0.57
Cryptonary's take
Like most major memes here, the price is range-bound between two key levels/zones of support and resistance. We fully expect the memes to break out meaningfully to the upside, but we expect that this may take more time. Therefore, in the immediate term, we're expecting a continuation of the price being range-bound. We expect $0.60 will be supported in the short-term for SPX, and then we'd like to see a turn and a break out to the upside above the main downtrend line.Recommended from Cryptonary


PRO
Market Direction
13 min read
Mar 17, 2026
PRO
Market Direction
12 min read
Mar 13, 2026

PRO
Market Direction
13 min read
Mar 10, 2026
