Save 23% ($351) & Get a Free 1-1 Call with our Team ⏰ : 0d 2h 59m 44s

However, ETH remains in an intact bull flag formation and looks healthier than BTC in terms of leverage levels and funding rates. While the $2,120 area acts as tough resistance, a break above would open a move to $2,340.
Ethereum seems rangebound but continues to hold a promising technical setup that could allow it to outperform Bitcoin if the broader market stabilises.
TLDR
- ETH pulled back slightly, but it is holding key support around $2,000.
- Despite the pullback, ETH looks healthier than BTC regarding leverage/funding.
- And while currently rangebound, its bull flag formation is still intact.
- We are in a good area to accumulate ETH if the market holds.
Disclaimer: Not financial or investment advice. You are responsible for any capital-related decisions you make, and only you are accountable for the results. “One Glance” by Cryptonary sometimes uses the RR trading tool to help you quickly understand our analysis. They are not signals, and they are not financial advice.
Macro analysis
The macro context follows through to all other assets that essentially trade with a high correlation to other risk assets.Technical analysis
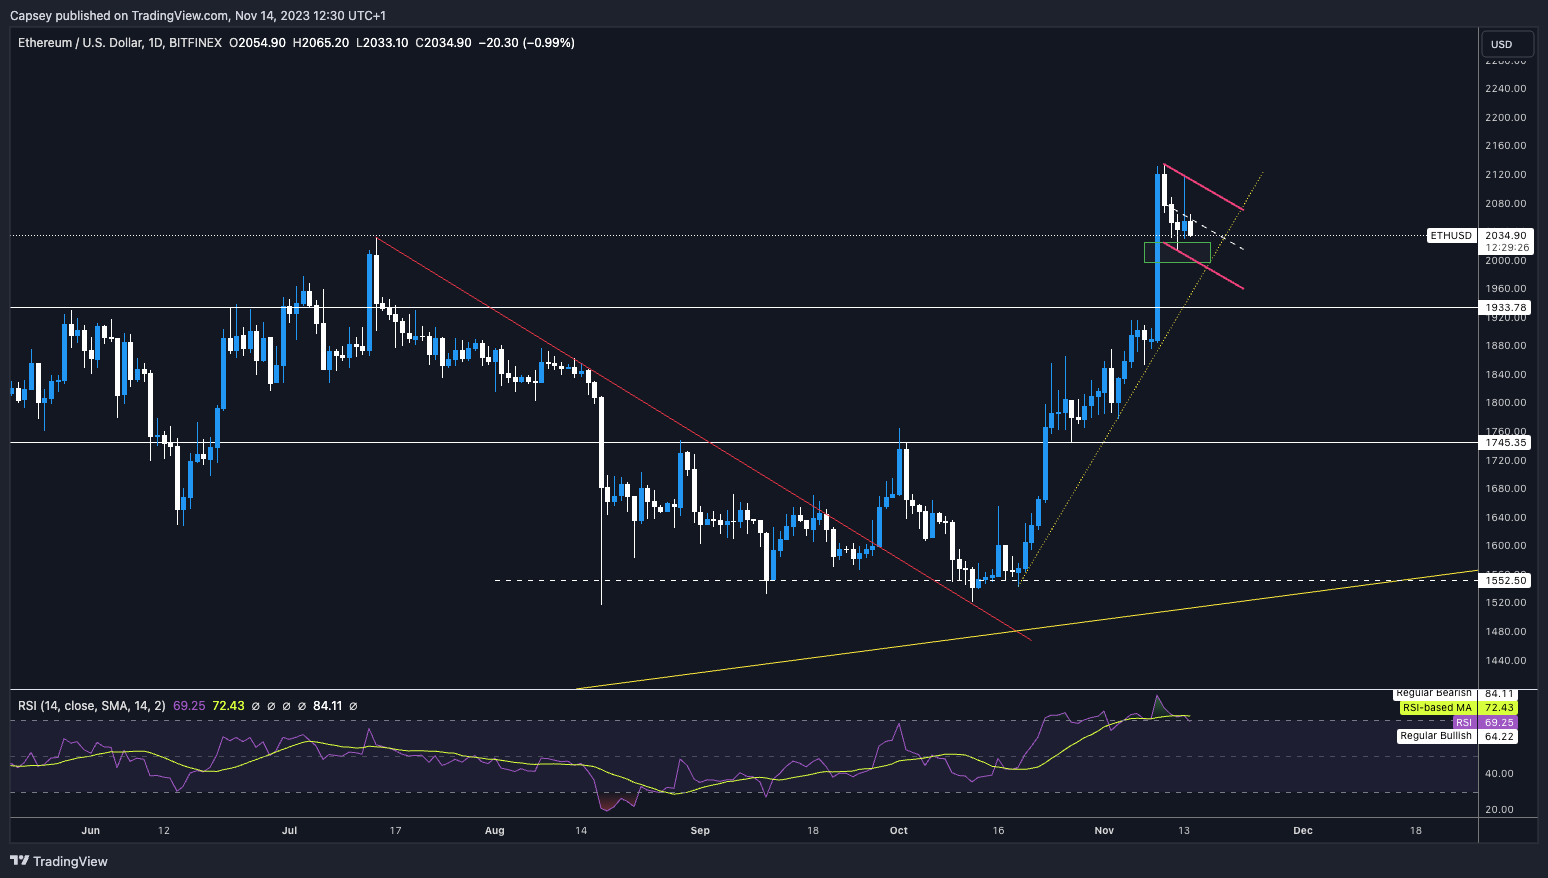
ETH has been brought down slightly by the general market moving lower. The $2,120 level is the key horizontal resistance for price to break above. If this happens, we will likely see a move to $2,340 in the short term.However, with BTC pulling back slightly, ETH hasn’t been immune. Local levels to the downside for ETH are the $2,000 to $2,020 area of support (green box in the chart); then, beneath that, the key level is $1,933. If $1,933 is reached, we will be DCA buyers of ETH there.
We are tracking ETH in a bull flag, so if the market can hold up, we believe ETH is technically set up to outperform.
On the RSI front, this is healthier than most. The daily and 3D timeframes are overbought, but they’re resetting, which is consolidatory and should be seen as positive for the market.
ETH 1D
Market mechanics
Mechanics-wise, ETH is similar to BTC but slightly better. We’re seeing the funding rate back to much healthier levels at 0.0120%, having been at 0.0530% just a few days ago. The open interest is still high, but it’s not at an overheated level that should worry us.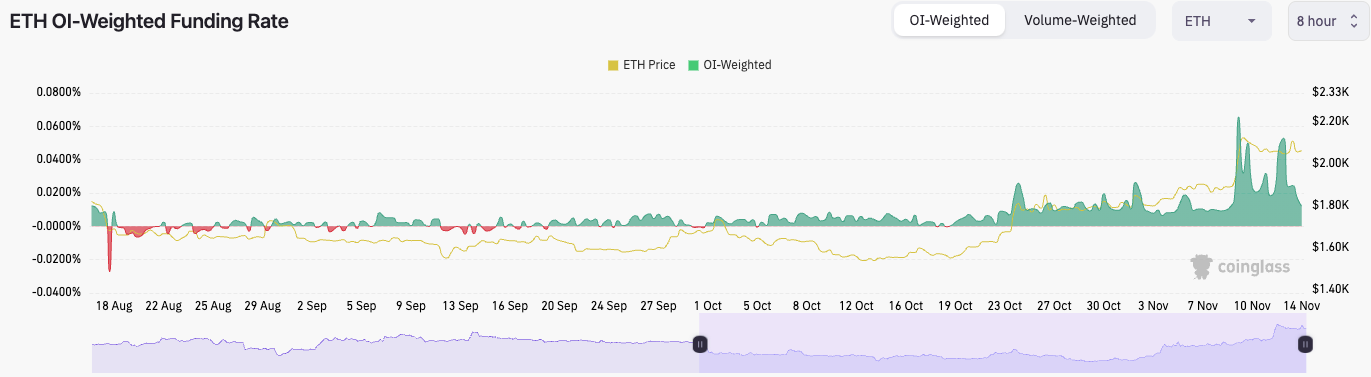
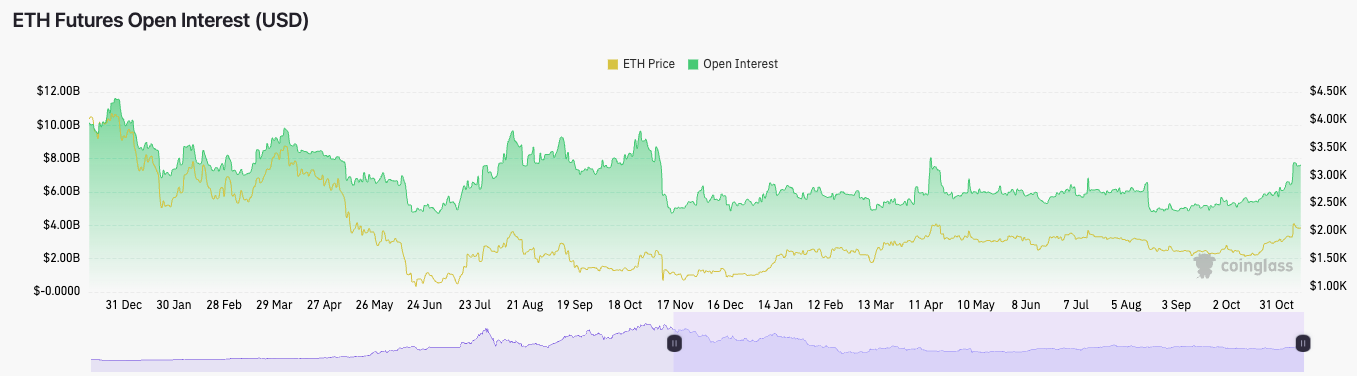
The above shows us that shorts have come in more in the past 24 hours, bringing longs and shorts into a healthier balance. There may be a slight flush out in leverage soon. However, the current level of open interest shouldn’t be enough to concern us reasonably.
Cryptonary’s take
As it has been for the past week, ETH is in a healthier position compared to BTC.If the market can hold up, ETH is the play that looks like it could get a more meaningful upside in the short term.
If the market can’t hold up, we would be DCA buyers with a long-term view sub $2,000, and we would be aggressive DCA buyers for the long-term between $1,850 and $1,933.
Recommended from Cryptonary


