Save 23% ($351) & Get a Free 1-1 Call with our Team ⏰ : 0d 2h 59m 44s

While ETH has managed to hold support around $1,933, bears remain in control below stiff overhead resistance at $2,120. However, indicators have reset from overbought levels, and on-chain data shows positioning is balanced. This suggests there is room for bulls to regain control if strong spot buying emerges.
But downside risks remain if Bitcoin falters from current levels – how should you play ETH from here?
TLDR
- ETH breaks the local uptrend but holds support around $1,933.
- The stiff overhead resistance at $2,120 is the next major hurdle.
- Indicators have reset from overbought levels, so ETH bulls are empowered to make a move.
- All in all, volatility is building as ETH stabilises around key levels.
Disclaimer: Not financial or investment advice. You are responsible for any capital-related decisions you make, and only you are accountable for the results. “One Glance” by Cryptonary sometimes uses the RR trading tool to help you quickly understand our analysis. They are not signals, and they are not financial advice.
Macro analysis
The macro context follows through to all other assets that essentially trade with a high correlation to other risk assets.ETH 1D
Technical analysis
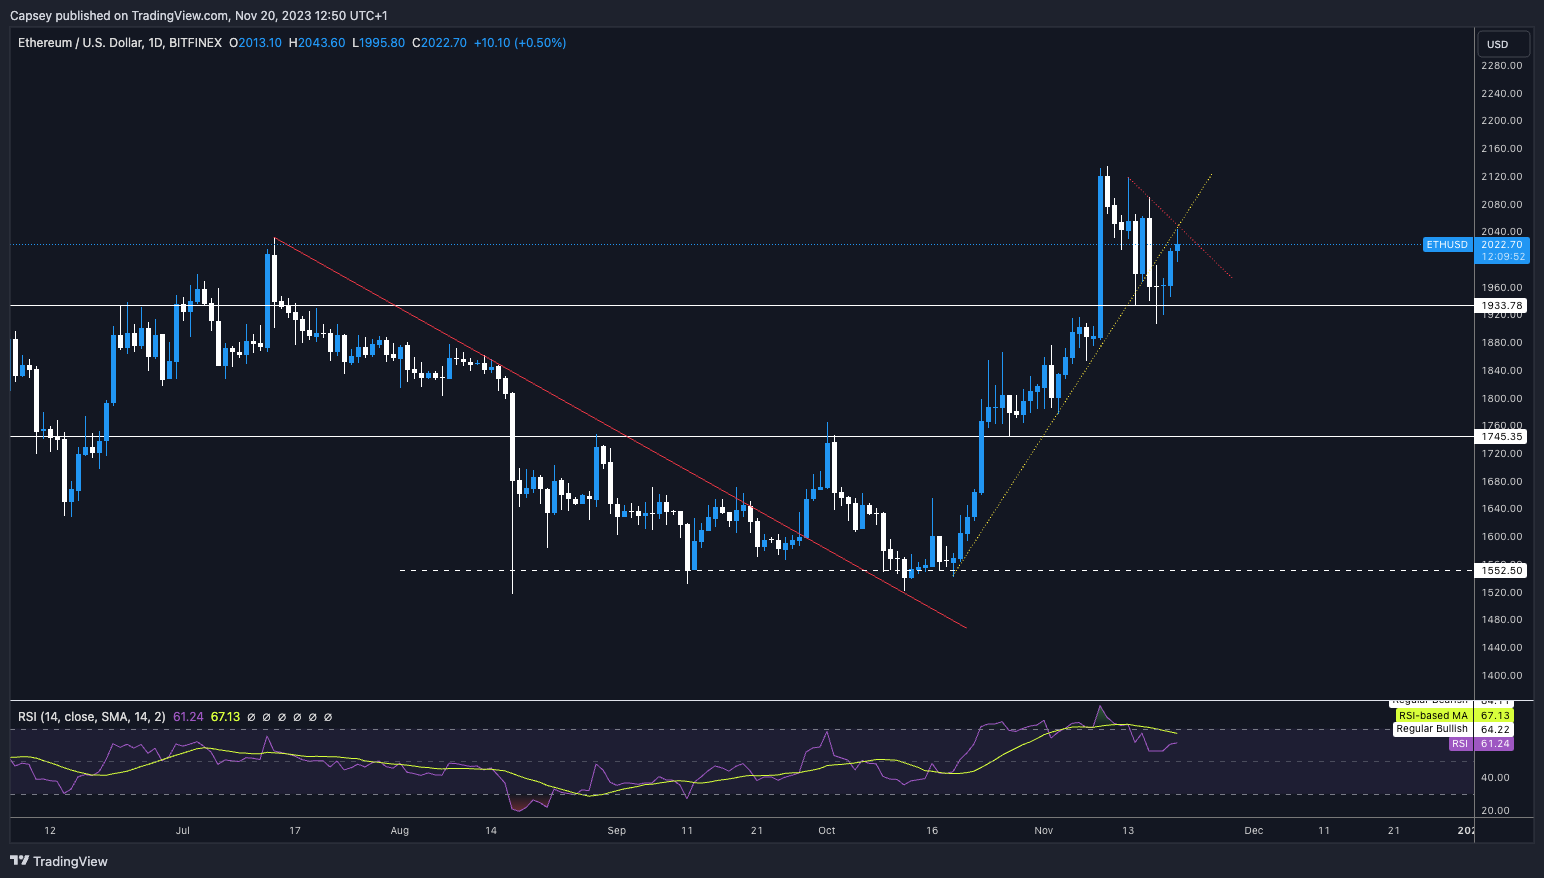
ETH has broken its local uptrend line but has held the $1,933 horizontal support.- ETH remains beneath its main uptrend line, and price has now moved up and tested the underside of the uptrend line, potentially as a new resistance.
- As price came down at the back end of the last trading week, ETH found support on top of the main horizontal support of $1,933. This is positive, and this level will need to remain as support; otherwise, price may move down to $1,850.
- The main horizontal resistance is at $2,120. If ETH clears this level, it would have a clear path to $2,340.
- The RSI on the 12hr and the daily timeframes have reset substantially, now well out of overbought territory - this is positive for price.
- The 3D and weekly timeframes are also ok here. The 3D is just about out of overbought territory, while the weekly is 62, so well below. Again, this should be positive for ETH's price, as there is room for further upside, as price is less exhausted to the upside.
Market mechanics
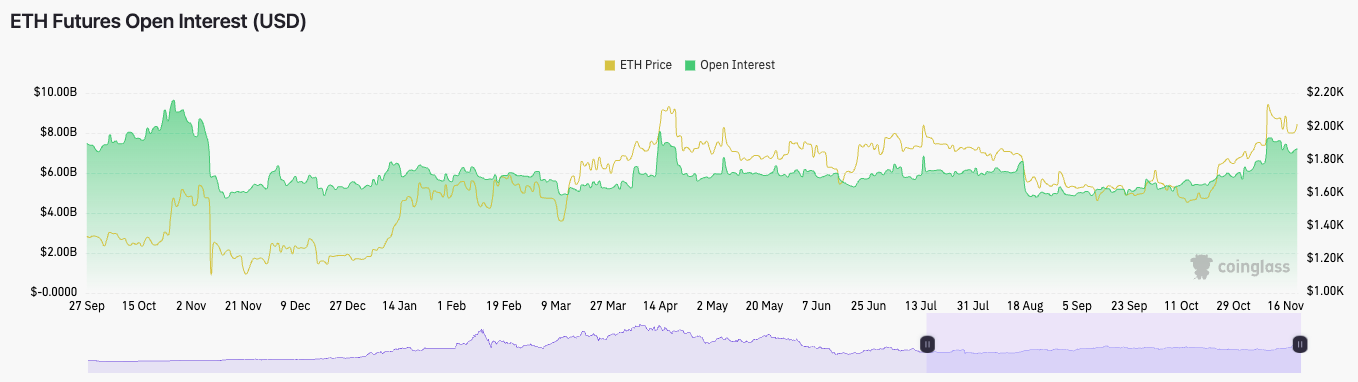
On the mechanics side of things, ETH looks relatively positive here.- ETH’s open interest slightly decreased to $7.22B from $7.75B a week ago. This is a higher level of open interest compared to prior months but not compared to prior years.
- The OI-weighted funding rate is at 0.0122%, which shows longs and shorts are in a more even balance.
- The long/short ratio is at 1.0392, so more participants have gone long than short over the past 24 hours, but this is not by a concerning amount.
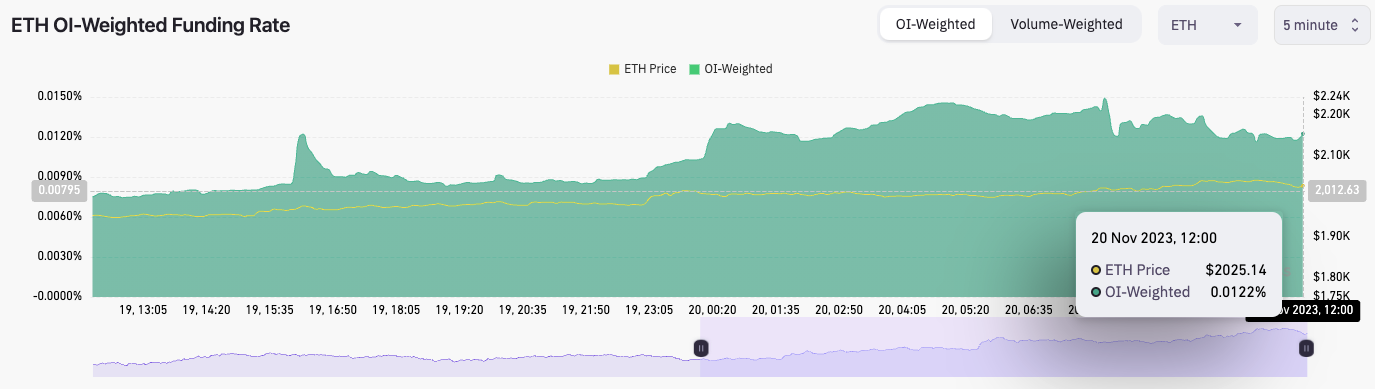
Overall, this is a relatively healthy setup for ETH as positioning is in a close balance. This, therefore, doesn’t provide many good risk/reward trading opportunities, but it’s a supportive mechanics setup for price to continue higher potentially.
Cryptonary’s take
Whilst the technicals are bearish, the indicators on the technicals are okay and suggest that there can be further upside if spot buyers step in. The mechanics are also in a healthy position, which could support higher prices. However, this assumes that BTC doesn’t reject from the late $37k. If Bitcoin rejects, this will likely bring the rest of the market lower.We are not taking active trades on ETH here. However, if price falls back to the low $1,900s, we will be DCA buyers of ETH.
Recommended from Cryptonary


