Save 23% ($351) & Get a Free 1-1 Call with our Team ⏰ : 0d 2h 59m 43s
Euphoria phase sets BTC, ETH, and other cryptos in motion
Crypto euphoria peaks with BTC nearing resistance while ETH, SOL, and POPCAT battle critical levels. As leverage skyrockets, is a market pullback looming, or will we see continued bullish action? Let's dive in.
Disclaimer: This is not financial or investment advice. You are responsible for any capital-related decisions you make, and only you are accountable for the results.
BTC:
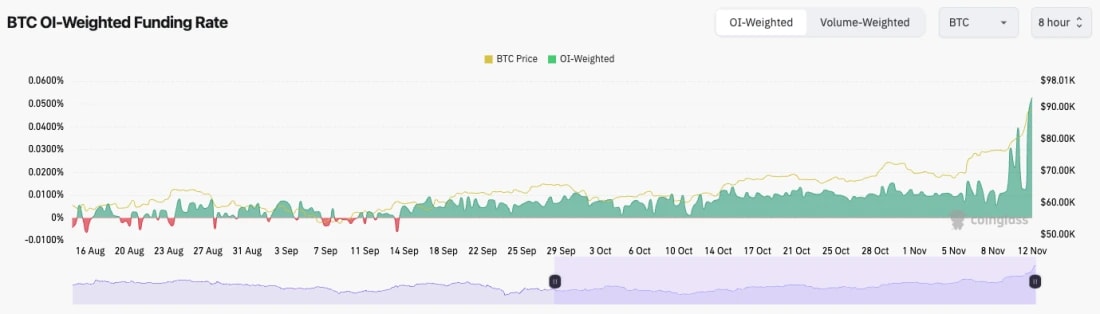
- Bitcoin's Open Interest is at a new cycle high (in terms of measuring by the number of coins), and it's at an all-time high in USD terms.
- The Funding Rate is also very high and now at alarming levels, at 0.07%. This is 75% annualised. So, traders are paying 75% per year to Shorts to hold their current Longs. Excessive.
- This setup likely needs and often results in a flush-out. We expect that this will also be needed here.
Technical analysis
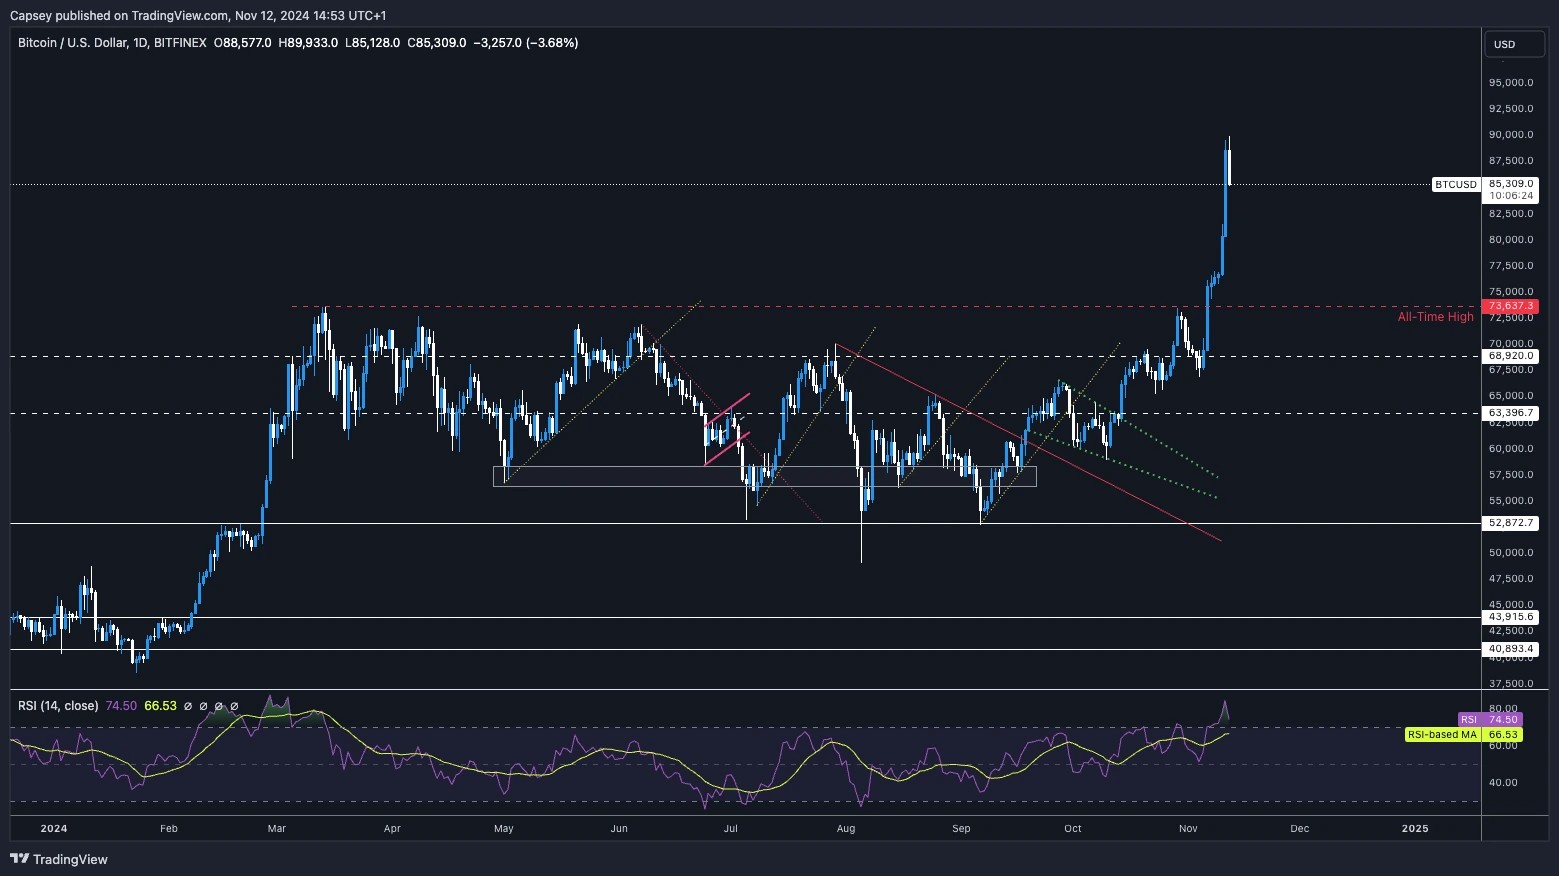
- Overall, this chart is great, and we've seen a high timeframe breakout, which has seen BTC visit close to $90k. Mega.
- The move has been basically straight up, and even though it was, for the most part, driven by Spot buying, straight-up moves can have, and need pull backs.
- The last major resistance that was broken to the upside was at $73,600. It's now more tricky to find a new potential area of support.
- Looking at the lower timeframes, there is local support here at $85,500. But Funding is still high, and OI hasn't been flushed yet, so there's probably more downside to come to generate that flush out.
- Therefore, the possible support we're looking at is between $81k and $82k.
- To the upside, the all-time high is the next resistance.
- The RSI is also extremely overbought at 75. This suggests some downside, or at least a period of consolidation is needed for this indicator to reset.
- Next Support: $81,000 - $82,000
- Next Resistance: $89,000
- Direction: Neutral/Bullish
- Upside Target: $89,000 (and then $100,000)
- Downside Target: $82,000
Cryptonary's take
We now fully expect that we're in the "euphoria" phase of the cycle, so we're expecting at least a number of months of strong upside price action. However, in the immediate term, BTC looks overbought here, while the leverage is high and overpositioned. It's likely we'll se a flush out of that leverage, and the price will likely pull back because of that.But major dips are for buying. So far, we've seen BTC and DOGE begin their breakouts. In the coming weeks, the rest is likely to follow.
Keep leverage light, preferably none at all. Dips are for buying, and the clue as to when to buy is when Funding Rates reset.
ETH:
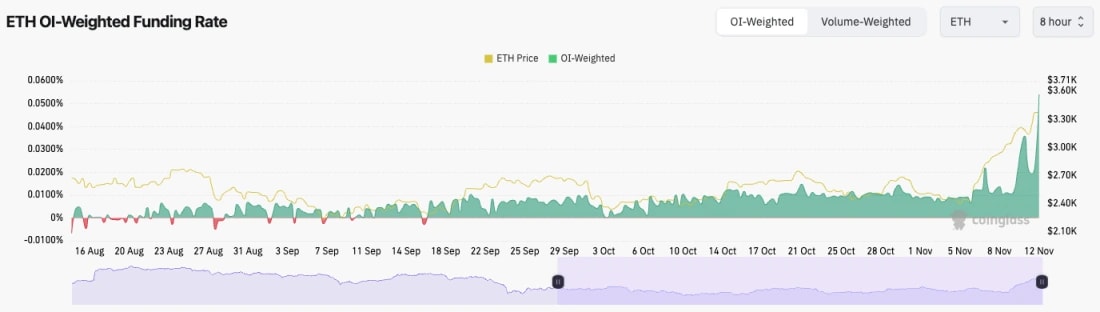
- ETH's Open Interest has hit an al-ltime high in both USD terms and the number of coins (ETH) terms.
- However, ETH's funding is high here at 0.06%, 66% annually.
- This suggests a flush out is needed here also as there's a lot of leverage overly positioned one-sided, Long.
Technical analysis
- It is a massive breakout and potentially a game changer for ETH, with a Trump victory providing hope for a new regulatory regime.
- ETH smashed through two major horizontal levels, the first at $2,875 and the second one at $3,240.
- Price has now moved up to the next horizontal resistance at $3,480, and it has pulled back from there. Expected after such a huge move higher.
- Price is now battling to find and maintain support at the $3,240 horizontal level. It would be very positive for Price to hammer this level in as new support and spend some time cementing itself above this level.
- The RSI for ETH is also very high at 73. It's likely we need to see more of a pull back for price or at least a period of price slowing down and consolidating, ideally in the range above $3,200.
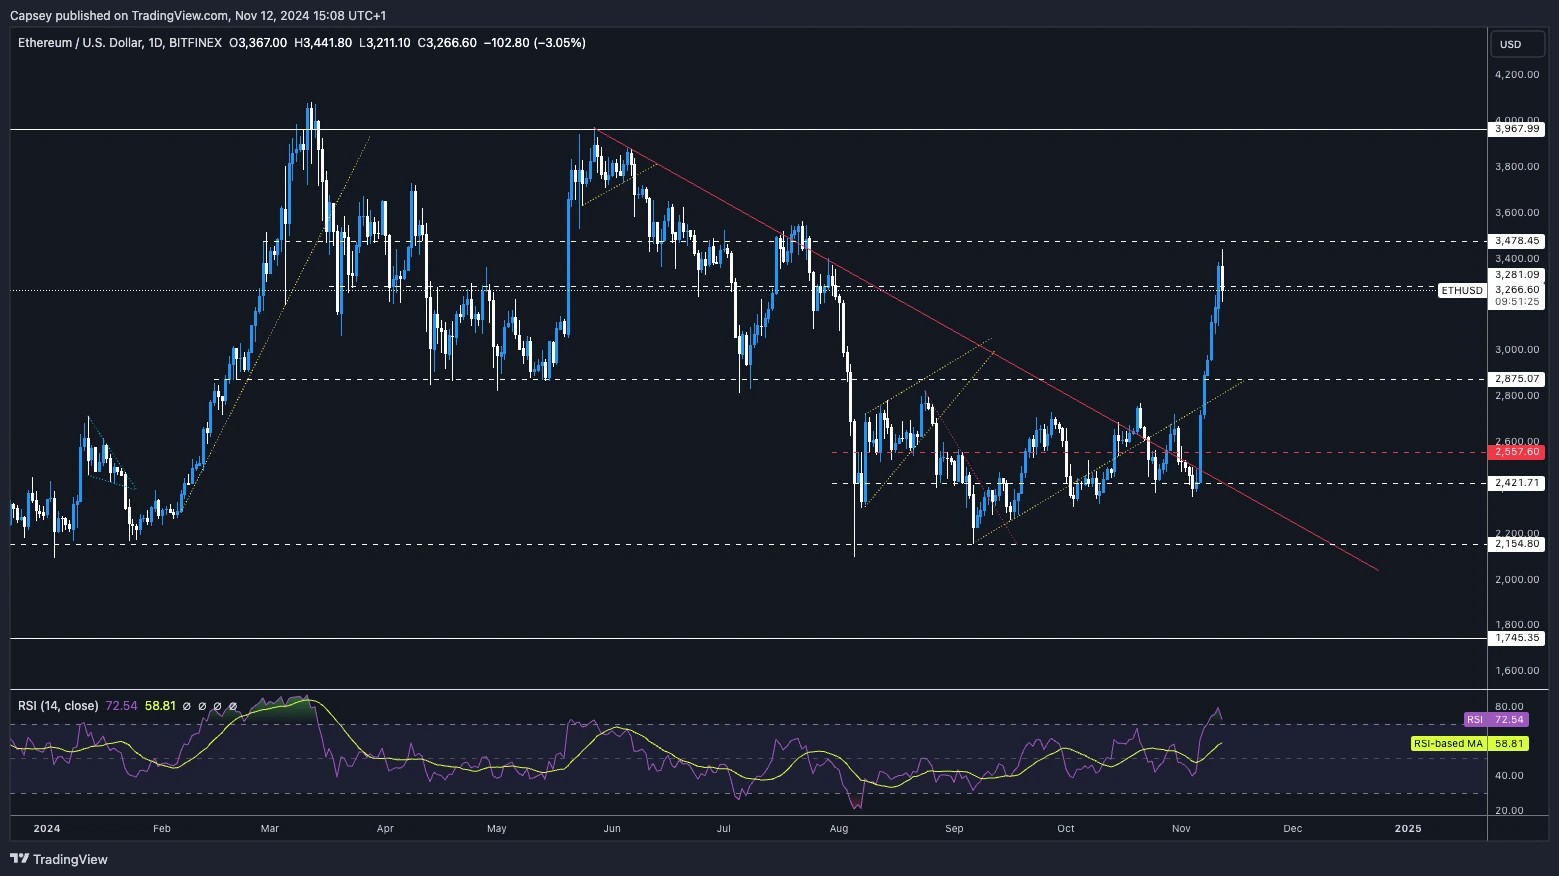
- Next Support: $3,100 to $3,240
- Next Resistance: $3,480
- Direction: Neutral
- Upside Target: $3,480 (and then $4,000)
- Downside Target: $3,100
Cryptonary's take
The Trump win has absolutely given fresh life to ETH and just generally the DeFi space. We expect price to slow down here, and ideally to just consolidate for a week or so between $3,200 and $3,400. This would give Alts/Meme's more room to breath and go higher, so we'd see that as positive. However, if there is a slight further pull back for ETH here, we wouldn't rule out a re visit to $3,100.SOL:
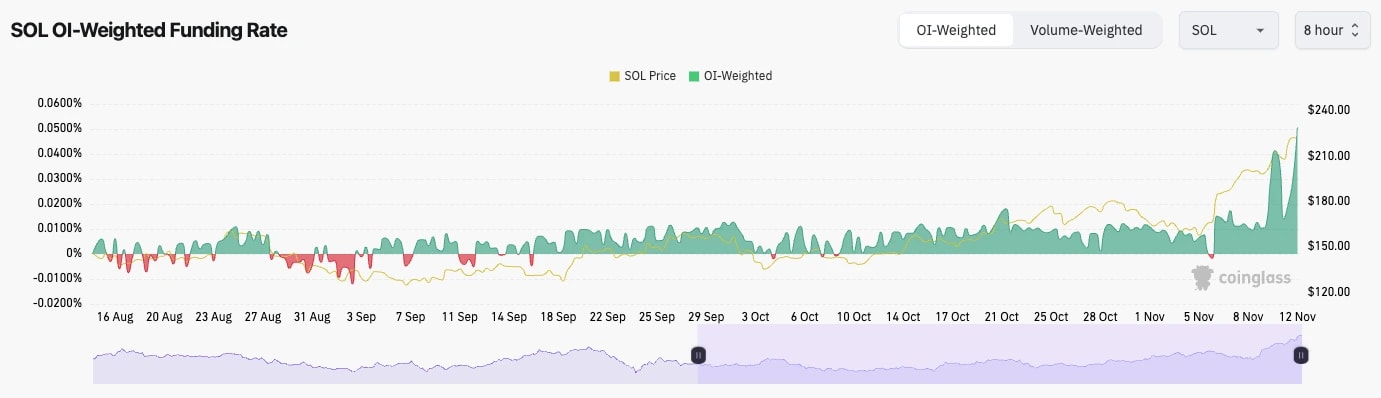
- SOL's Open Interest, by a number of coins, is at a new cycle high.
- SOL's funding rate is 0.07% or 76% annually. This is very high. It can go higher, but this is very high.
- Like BTC and ETH, we would expect a leverage flush out for SOL here. This doesn't mean price will collapse, but a 10% pull back from the highs is possible.
Technical analysis
- A huge move up that's seen SOL breakout above its major resistance at $203$205.
- Price became very overbought and has now pulled back slightly. What's really positive is that price is pulling back to $203 and now using that area as new support. Resistance flipped into new support.
- To the upside, the horizontal resistance is at $220 and then the all-time high of $255.
- On the downside, we would expect $190 to $205 to be a good area of support if there is a more meaningful price pullback.
- The RSI was overbought but it has now pulled back. If price consolidates for a period of time (say a week), this'll reset the RSI without price needing to have a major pull back to reset it.
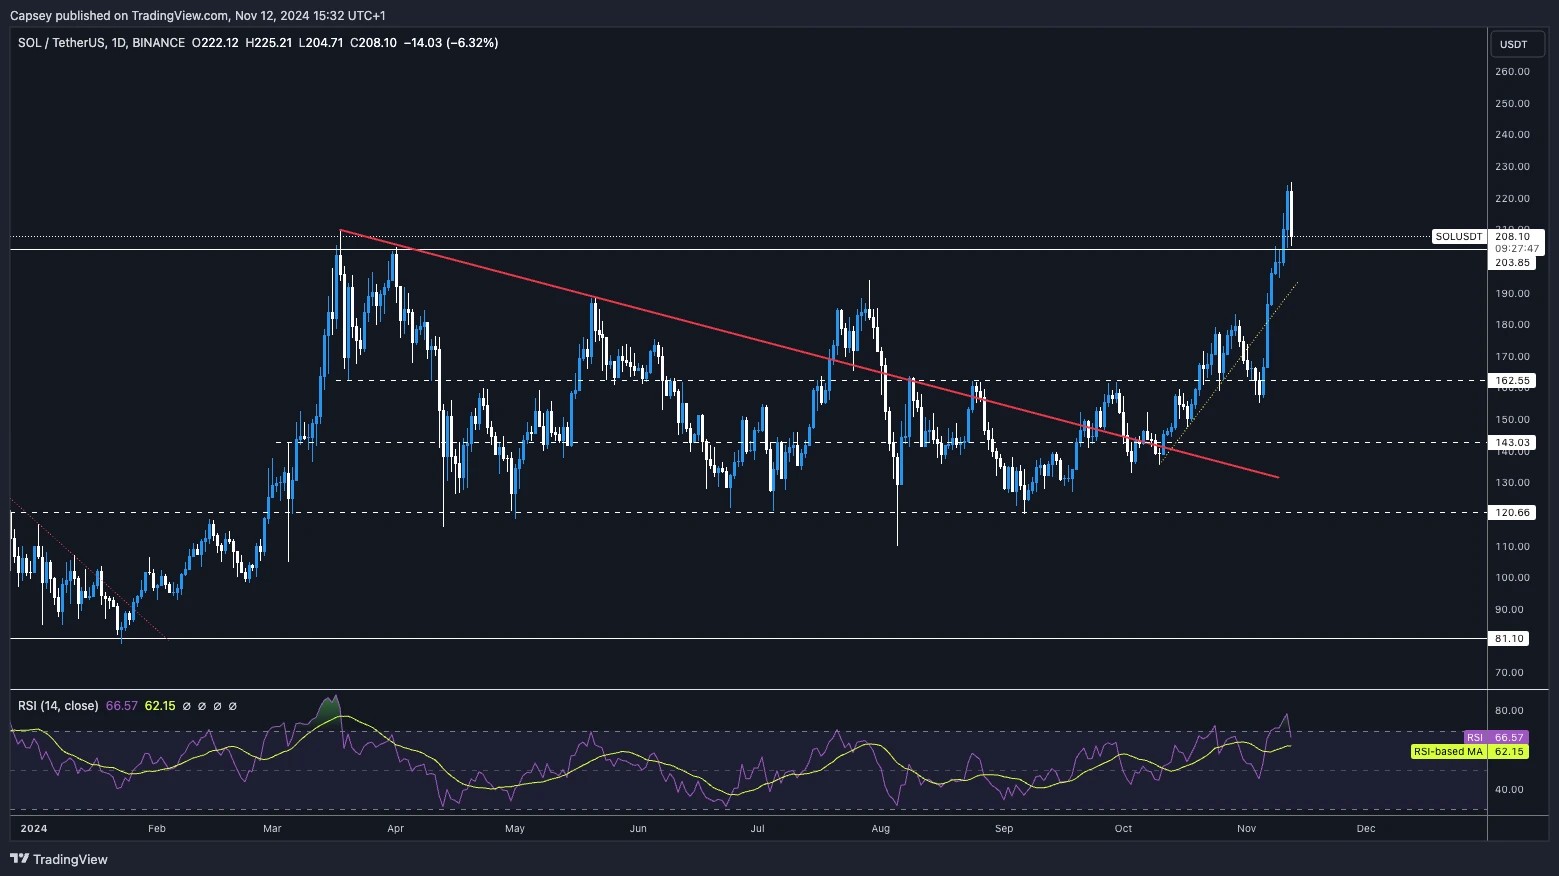
- Next Support: $190 to $203
- Next Resistance: $220
- Direction: Bullish
- Upside Target: $220 (and then $255)
- Downside Target: $190
Cryptonary's take
SOL looks good here, having broken out of all the major horizontal resistances and now potentially pulling back and using the $203 horizontal resistance as new support.We expect price to remain range-bound at these higher price levels for at least a few days. But, this would be positive in our view as it would likely help to reset some of the indicators, and therefore allow the next leg higher. $190 to $205 should be a strong support zone.
WIF:
- A really nice move from WIF and getting back well into the $3's.
- To the downside now, we'd like to see the $2.70 to $2.80 area hold as support. A pullback to here and a price to consolidate between here and $3.20 would also reset the RSI.
- To the upside, the target is $3.40 and then $4.00 (psychological level).
- It's possible that if there is a flush out, WIF will revisit $2.55. If it did, we'd see this as a gift and add it again to our WIF bags.
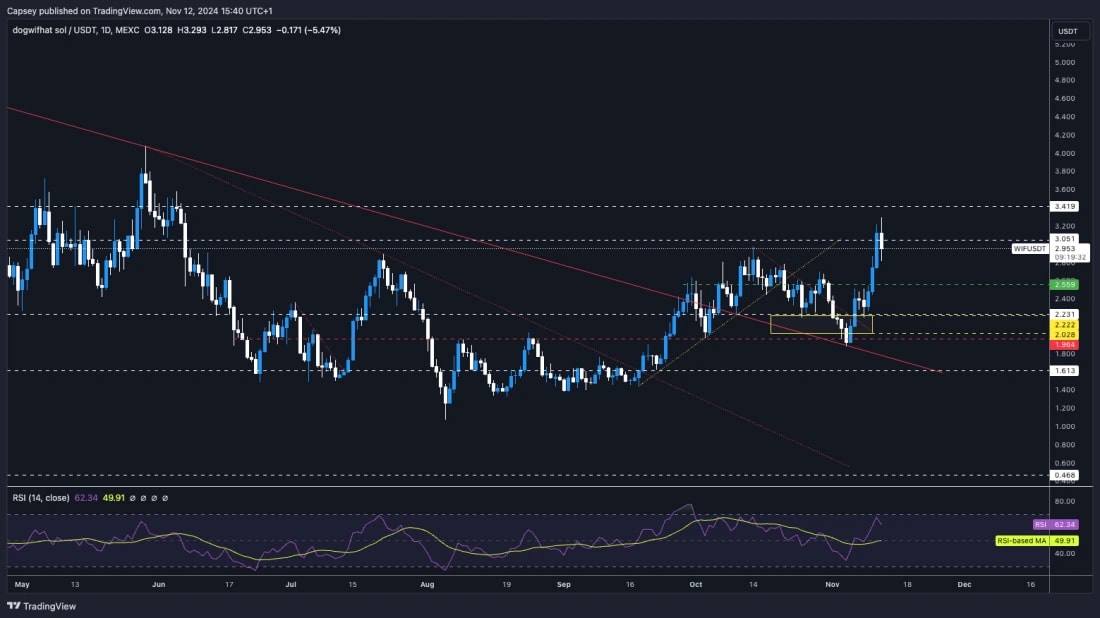
- Next Support: $2.70
- Next Resistance: $3.40
- Direction: Bullish
- Upside Target: $3.40 (and then $4.00)
- Downside Target: $2.55 to $2.70
Cryptonary's take
It's possible that WIF has a brief spell of consolidating between $2.70 and $3.20 over the coming days as we expect the majors to do the same. However, this might be front run and we see Meme's break out upon a period where Bitcoin calms down. If price revisits anywhere close to $2.50, we'd be adding more size.We've seen DOGE rocket higher, and put on about $30b in MCap over the last fortnight - WIF is currently sub $3b MCap, for some perspective. This has personally made myself (Tom) revise my WIF targets much higher. We expect that when retail comes back, the new coins will get major attention, and therefore upside. Patience with WIF. Likely we're at $5 and then $10, sooner than you think.
POPCAT:
- Considering POPCAT was up 200% between the start of September thought to the end of October, it has done well to hold at it's highs.
- POP remains range-bound and consolidates between $1.40 and $1.60, with the occasional push up to the $1.70's.
- The main resistance for POPCAT will be $1.73 and then $1.81. A break above that likely swiftly sends POP to $2.00.
- The RSI remains in very middle territory (at 54) as POP hasn't broken out, but rather just consolidated.
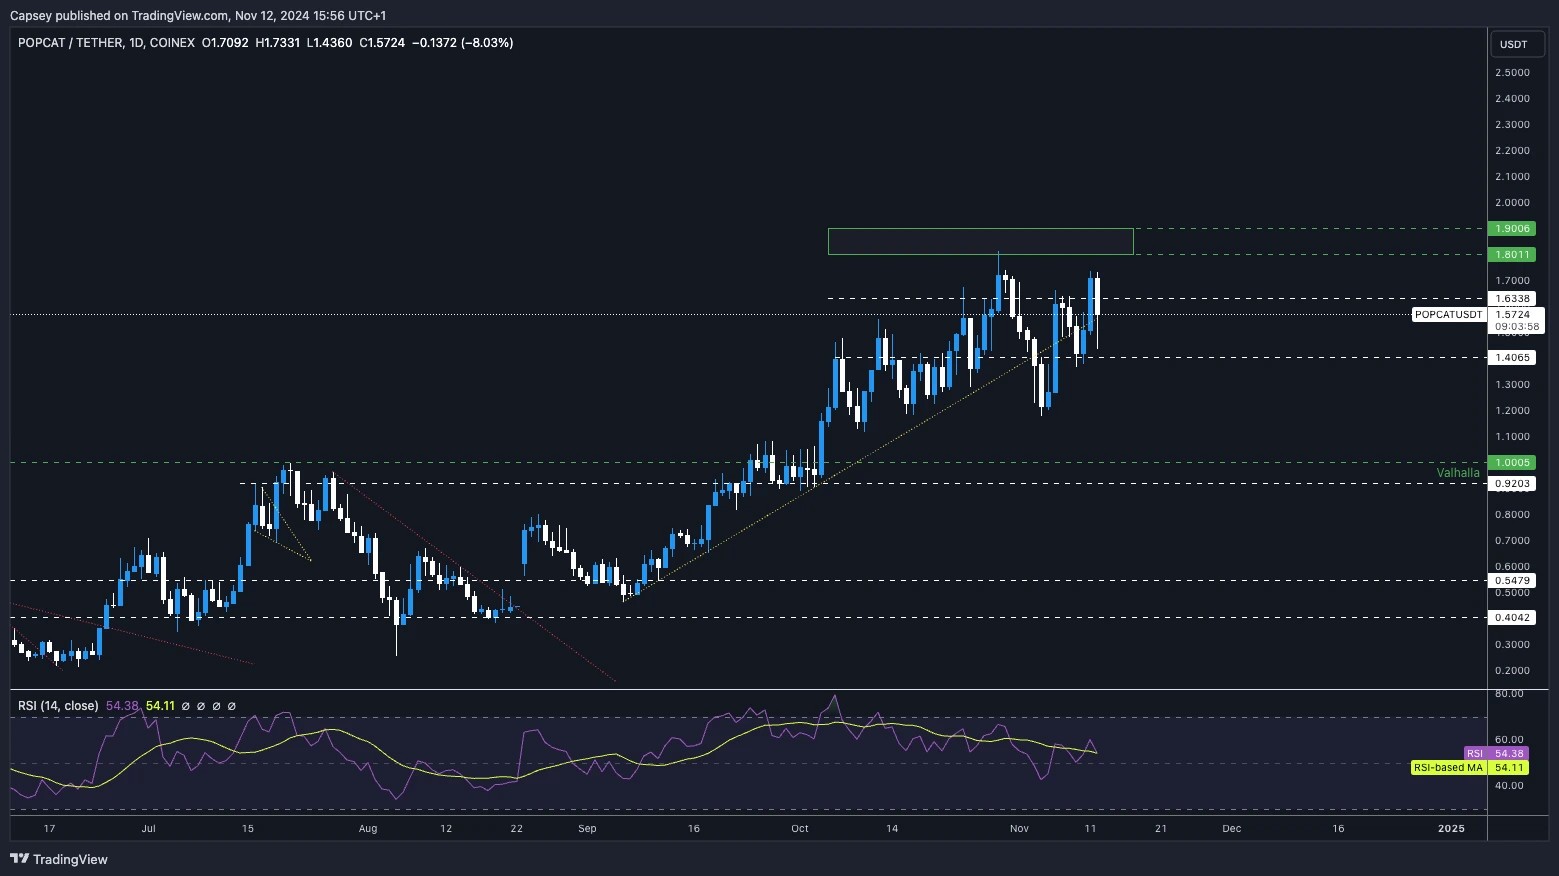
- Next Support: $1.40
- Next Resistance: $1.73
- Direction: Neutral/Bullish
- Upside Target: $1.70 (and then $2.00)
- Downside Target: $1.40
Cryptonary's take
Despite BTC and SOL's breakout, POPCAT hasn't run higher, even with WIF breaking out back above $3.00. POPCAT has remained towards the top of its range, and it has consolidated between $1.40 and $1.70. This has allowed some of the indicators to reset.We would expect that when Bitcoin slows down and consolidates, WIF and POPCAT can both run. WIF run, and then POPCAT follows. A break above $1.80-$1.90 and we could see POPCAT re-price considerably higher.
SPX:
- SPX has broken below its main uptrend line and back beneath the $0.75 horizontal support.
- However, price is now attempting to bounce from the $0.65 area, although it may find that $0.75 horizontal level and the underside of the main uptrend line, may act as new resistance.
- Beneath current price, the support is at $0.65 and then $0.55. If $0.65 is broken, it's possible we see a revisit to the $0.50 to $0.55 area.
- Volume did pick up over the last 48 hours. However, it was selling rather than buying volume.
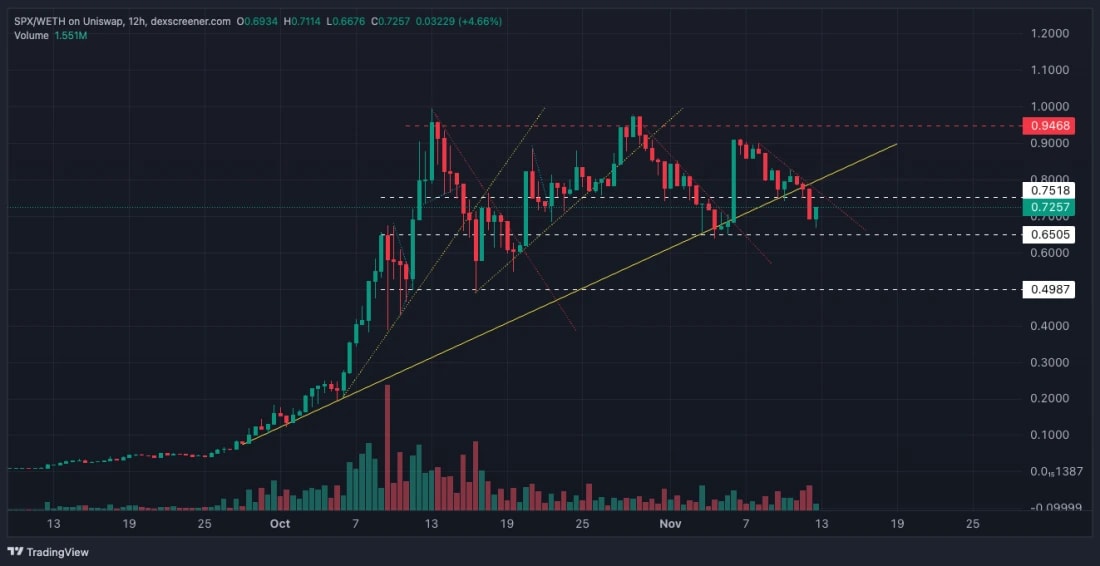
- Next Support: $0.65
- Next Resistance: $0.75
- Direction: Neutral
- Upside Target: $0.75
- Downside Target: $0.55
Cryptonary's take
SPX is still at a relatively high level, and it has now had a number of pullbacks where it's able to find support. Unfortunately, SPX is beneath its horizontal level of $0.75 (likely now new resistance), and it's also out of its main uptrend.If SPX can reclaim both, then expect a swift revisit back to the highs of $0.94. However, this may be tricky as there are a number of resistance overheads.
Recommended from Cryptonary


