Save 23% ($351) & Get a Free 1-1 Call with our Team ⏰ : 0d 2h 59m 43s

The big question is, what type of rate cuts do we get?
If it's a normalisation rate cut, the market will rally, and then the election narrative will take over. However, if it is an aggressive rate cut, it suggests that the Fed is late to the rate-cutting party, and the market will tank.
In today's update, we will dive into how the markets have been whipsawed recently by the macro data and then how this affects crypto.
Let's go!
Key questions
- What crucial economic indicators are currently whipsawing the markets, and how might they impact crypto?
- Is the Fed walking a tightrope between normalising policy and stimulating a weakening economy?
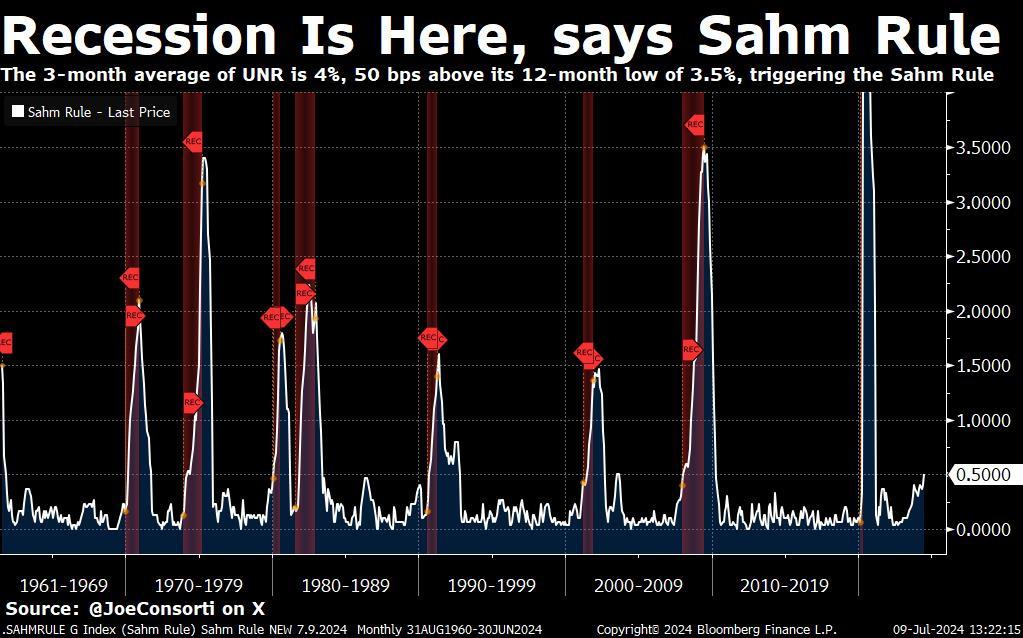
- Could an obscure recession indicator called the "Sahm Rule" be triggered soon, and what would that mean?
- Why are investors suddenly shifting away from Big Tech, and how could this benefit crypto?
- What type of interest rate cuts should crypto investors be hoping for in September?
- How might the upcoming macro data and potential Fed actions shape crypto's trajectory leading into the US presidential election?
Disclaimer: This is not financial or investment advice. You are responsible for any capital-related decisions you make, and only you are accountable for the results. "One Glance" by Cryptonary sometimes uses the RR trading tool to help you quickly understand our analysis. These are not signals, and they are not financial advice.
Markets whipsawed by macro data
Firstly, we'll start with what this all means and why the markets are paying such close attention to each macro data point. The Fed has operated off of forward guidance. This is where they (Chair Powell) tell the market what their thinking is and what they're looking for in the data to then (in this case) potentially lower the Interest Rate.There is a Fed Meeting on July 31st, and the next one is September 20th. The Fed hasn't recently forward-guided to the market that they're looking to begin cutting Interest Rates at the July Meeting, so if they did cut rates at the July Meeting, this might panic the market, as it would go against the Fed's recent practice, i.e., forward guiding what they're going to do (with regards the Interest Rates) well ahead of making a move.
This closes the door to an Interest Rate cut at the July Fed Meeting.
So, the market is now watching every data point to see when rate cuts are likely to come and, more importantly, what type of cuts they'll be.
The risk the Fed has with continuing to hold Interest Rates where they are is that if the economy continues to moderate, the moderation might turn to outright weakening, and then the Fed won't be cutting Interest Rates to moderate policy (bring Interest Rates into better balance against Inflation) but they'll be cutting Interest Rates more aggressively to stimulate an economy falling into a recession.
The latter is not good for risk assets (crypto), and the former is good for risk assets.
Currently, the data is still ok. We have a continuation of disinflation, whilst GDP came in at 2.8% yesterday (growth is still good), well above the previous 1.4% figure.
We also had Jobless Claims stay relatively low, or at least not markedly up ticking. However, we have seen a slowdown in the consumer, with ISM Services coming in below 50, retail sales coming in flat (0.0%), and the labour market has also shown some weakness.
The expectation is that the Unemployment Rate is going to come in at 4.2% next Friday. This would trigger the Sahm Rule if so. The data is starting to look slightly more mixed, and it suggests that the Fed needs to get on with cutting interest rates.
Education: The Sahm Rule is a recession indicator used by the Fed to determine if the economy is entering a recession. The rule states that if the 3-month average of the Unemployment Rate increases by 0.5% or more above its lowest point in the previous 12 months, the economy is likely in the early stages of a recession.
If the Unemployment Rate comes in at 4.2% next Friday, the Sahm rule will be triggered. This would be concerning to some market participants.
Sahm Rule
Over the last few days, the fear has been that maybe the economy is moderating/weakening faster than first anticipated. This has come via earnings, where some of the companies that have reported this week have suggested that they expect a weaker outlook going forward as they've seen the consumer pull back from more willing spending recently.
This fear has made the market slightly more cautious, where we've seen Big Tech sell off (which has brought the S&P and the Nasdaq down), Bonds being bid, and the Russel 2000 (Small Cap companies) continuing to get a bid.
S&P 1D Chart:
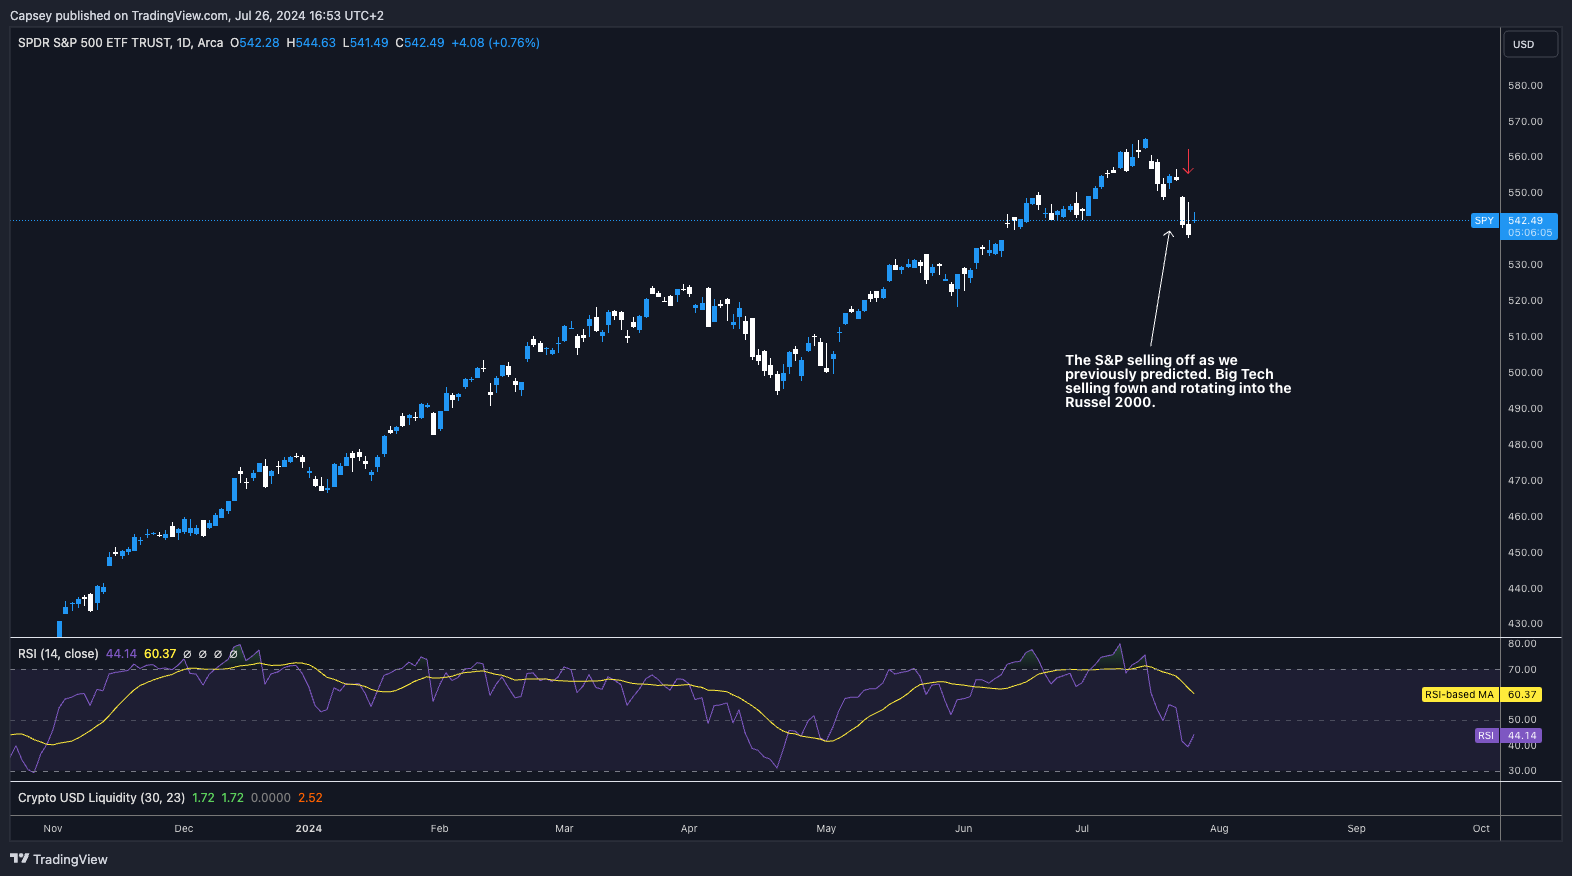 S&P 500 ETF Trust price chart showing sell-off prediction, with Big Tech rotation into Russell 2000 and RSI indicator
Russel 2000 1D Chart:
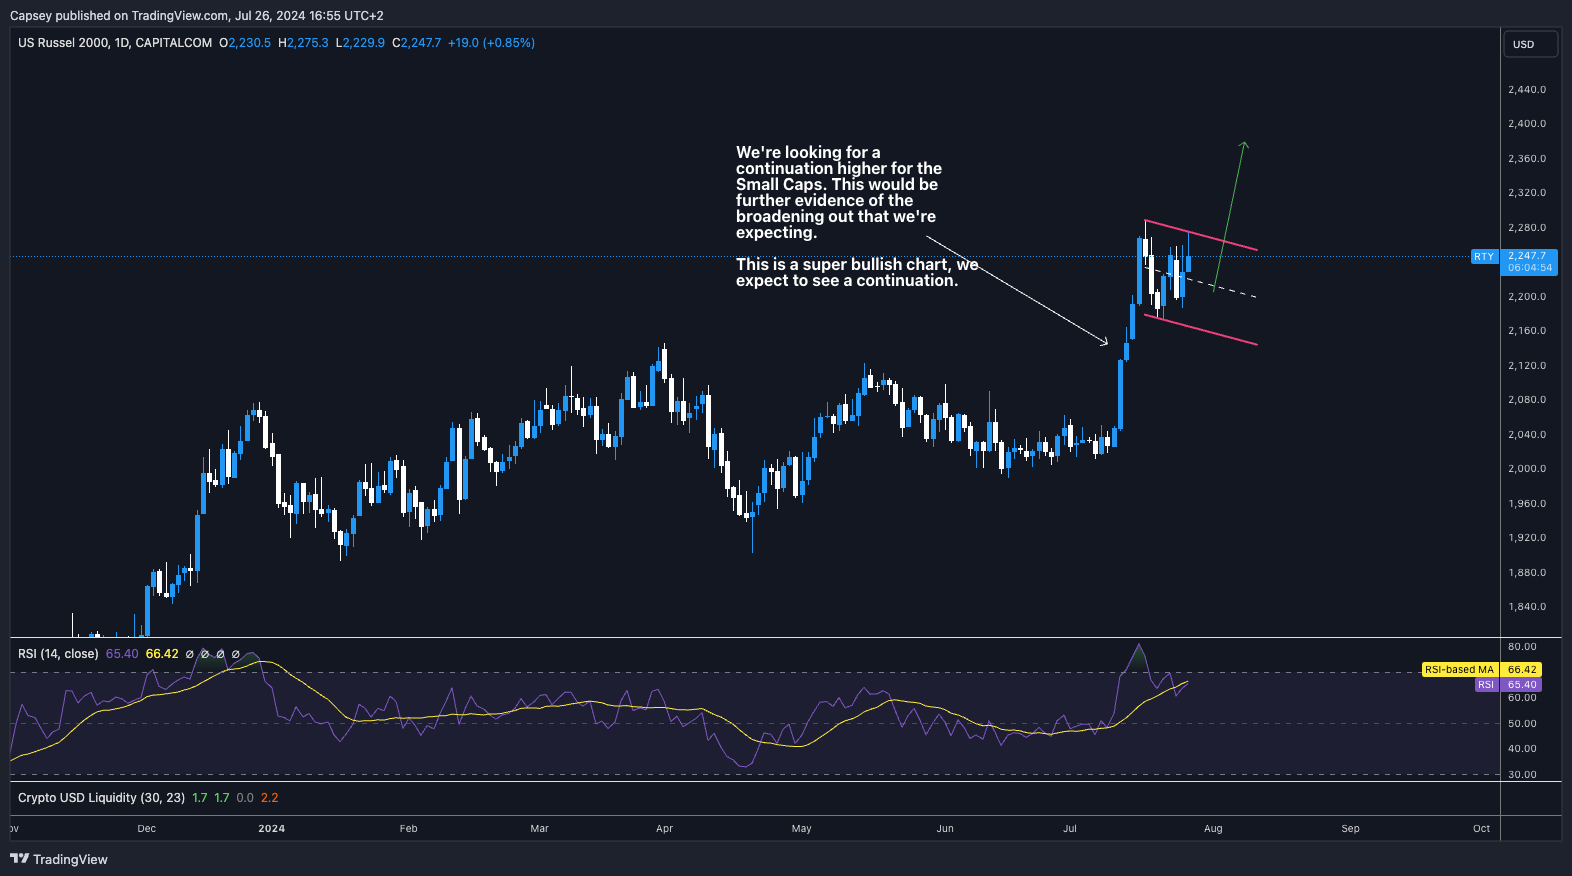 US Russell 2000 price chart showing bullish continuation pattern with RSI indicator and prediction for higher small cap performance
US 2Y Bond Yield:
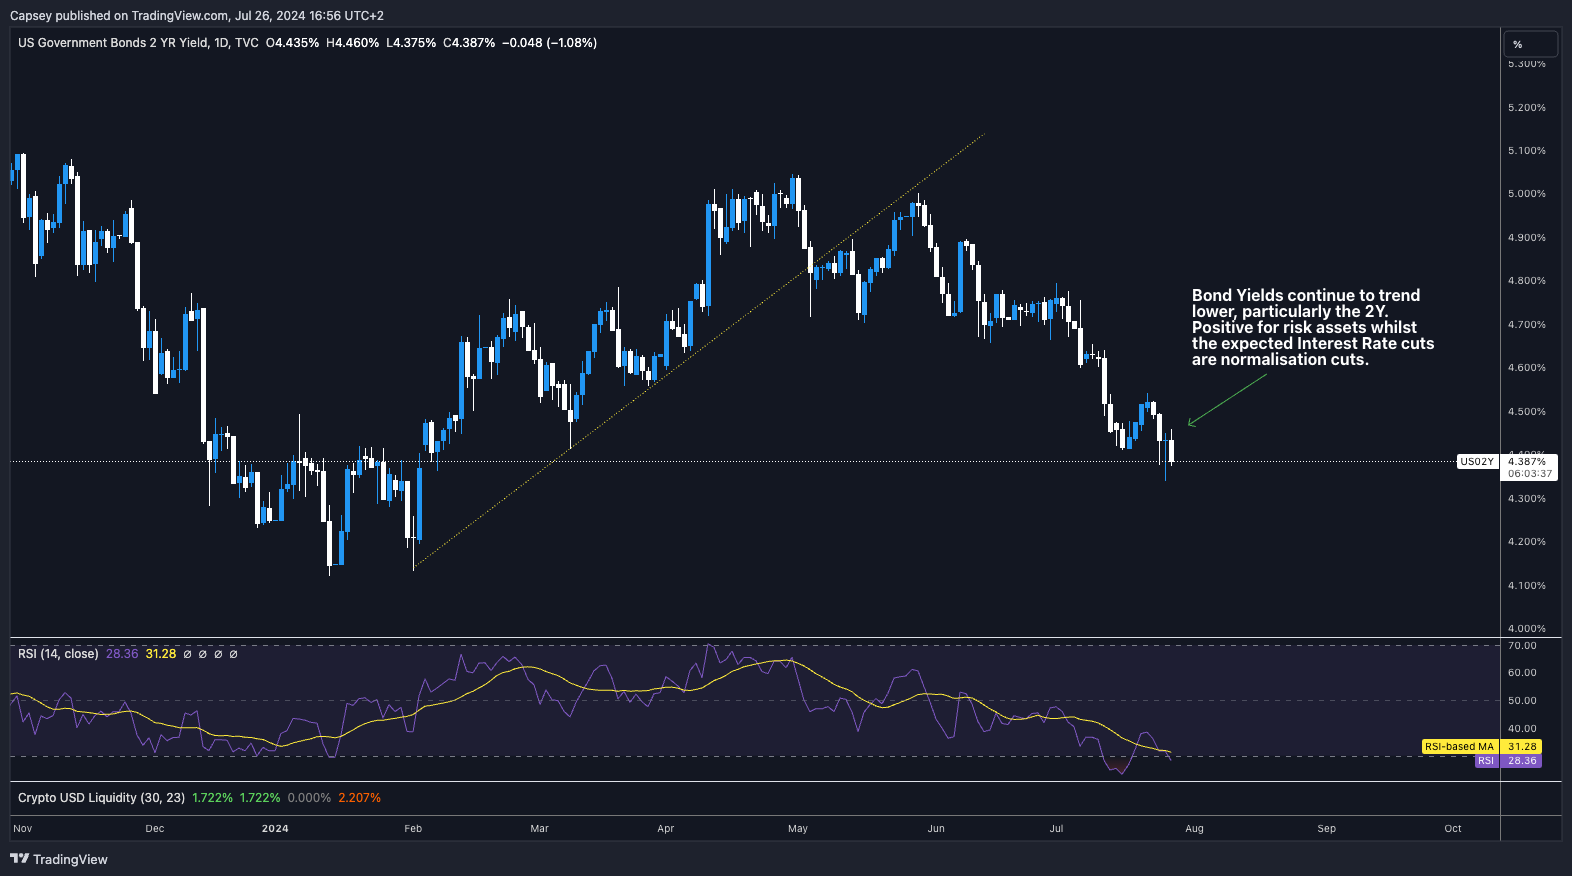 US Government Bonds 2-year yield chart showing downward trend with RSI indicator and impact of expected interest rate cuts
Key takeaways from the macro situation
What can we take away from the above, and what is the key to all this and for crypto?Currently, we're seeing a diversification trade out of Big Tech into the 2Y bond yield and into Small Cap companies (Russel 2000), and a continuation of this. This is because the market is pricing in that Interest Rate cuts are going to come, and the cuts are normalisation cuts rather than panic Interest Rate cuts.
So, the 2Y yield will come down (the Bond will be bid/bought), and Small Cap Companies will also be bid/bought. These companies currently have high debt servicing costs, so lower Interest Rates lower their cost of debt, improving their margins, meaning they're more profitable; hence, their stocks are then bid/bought by the market.
This diversification trade has a positive carry-over effect for crypto. Crypto is also seen as a slight diversification trade, and crypto is bid when Interest Rate cuts get priced into the market.
The key is that the Interest Rate cuts that come in September are normalisation cuts when they come. If the data materially weakens between now and September 20th, the market will price in panic Interest Rate cuts rather than normalisation rate cuts. This pricing-in will see risk assets move materially lower, and crypto won't be immune.
This is why macro data is so important and why we're seeing significant volatility each day in the markets as new data comes out. The Fed are beginning to run a close line between cutting Interest Rates for normalisation of policy rather than aggressive cuts, whose purpose is to stimulate the economy.
Cryptonary's take
The above can be summarised in this most basic form.If the Fed Interest Rate cuts that come in September are normalisation cuts, between now and then, crypto and risk assets are likely to see further upside, even if there is a continuation of the pullback in the S&P and the Nasdaq.
However, if the macro data materially weakens over the coming weeks, the markets may begin to price-in the Fed being late to the interest-rate-cutting table. This would result in all risk assets selling off, with crypto not being immune to this. The key is the macro data.
So, we're keenly watching the macro data and looking for the data to continue showing a slowing in the economy but not an outright weakening. If we continue to see this, and we're expecting we will, but we're highlighting the biggest risk we see currently, then crypto can perform well between now and mid-September. The narrative will then shift to the US Presidential Election.
The key is watching macro data between now and then to have an idea of what type of rate cut it is likely to be. Continue following cpro so you aren't caught unaware of whatever way this breaks.
BTC 1D Chart:
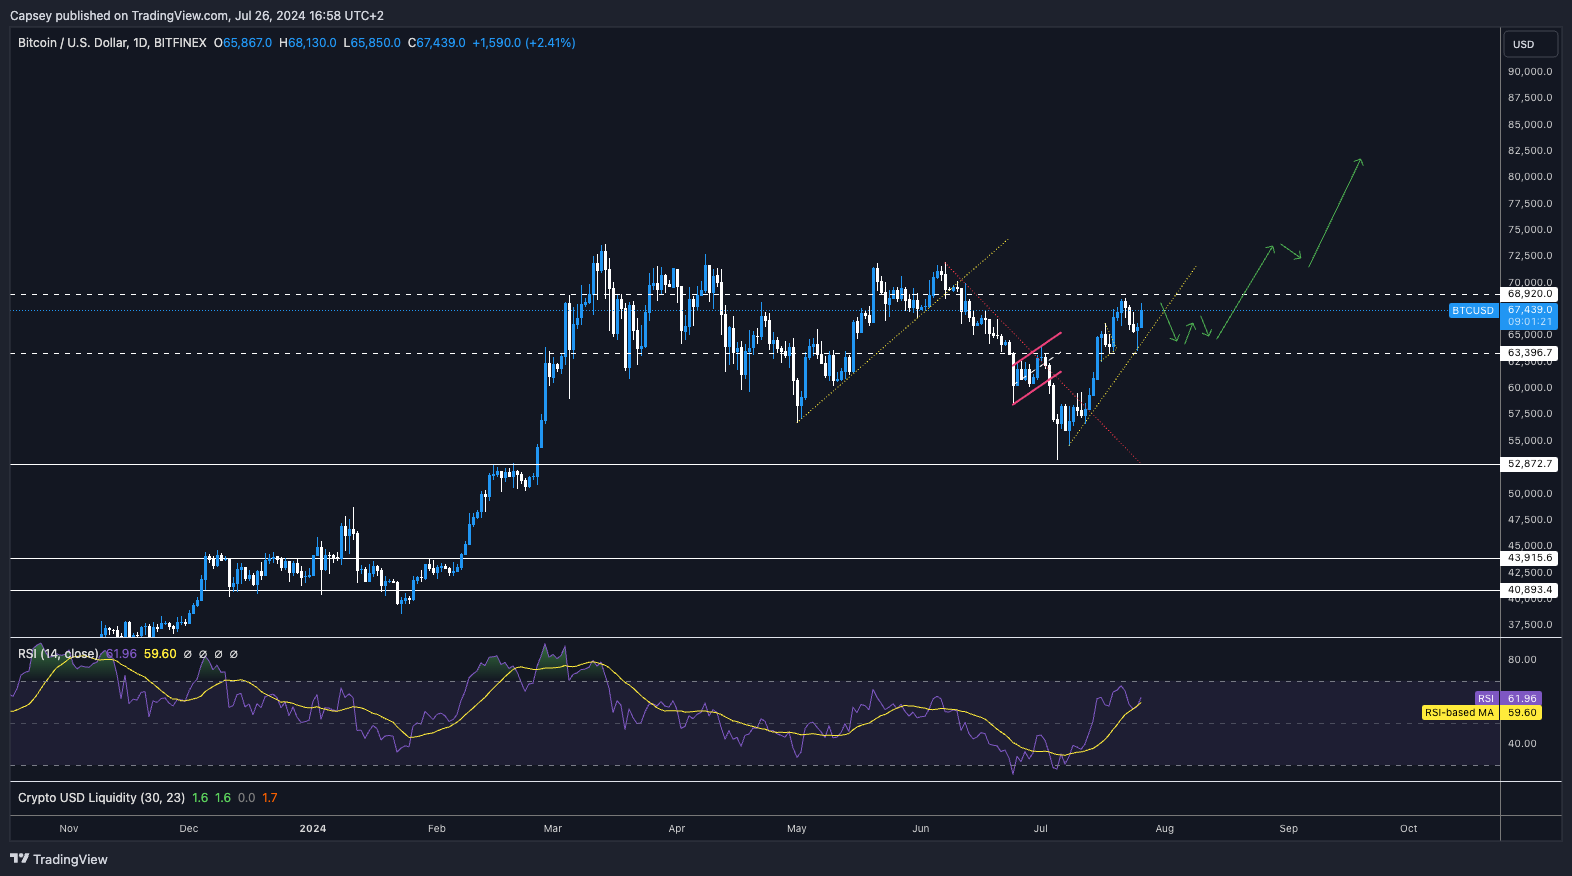 Bitcoin USD price chart showing key support and resistance levels with RSI indicator and potential upward trend predictions
Recommended from Cryptonary


