Log in

Home
Research
Analysis
Community
  1. Cryptonary
  2. Market Analysis
  3. FTM price prediction & analysis today: Is $0.3850 the key level?
Technical Analysis

FTM price prediction & analysis today: Is $0.3850 the key level?

Updated: Aug 27, 2024
Published: Aug 22, 2024
0
Share:

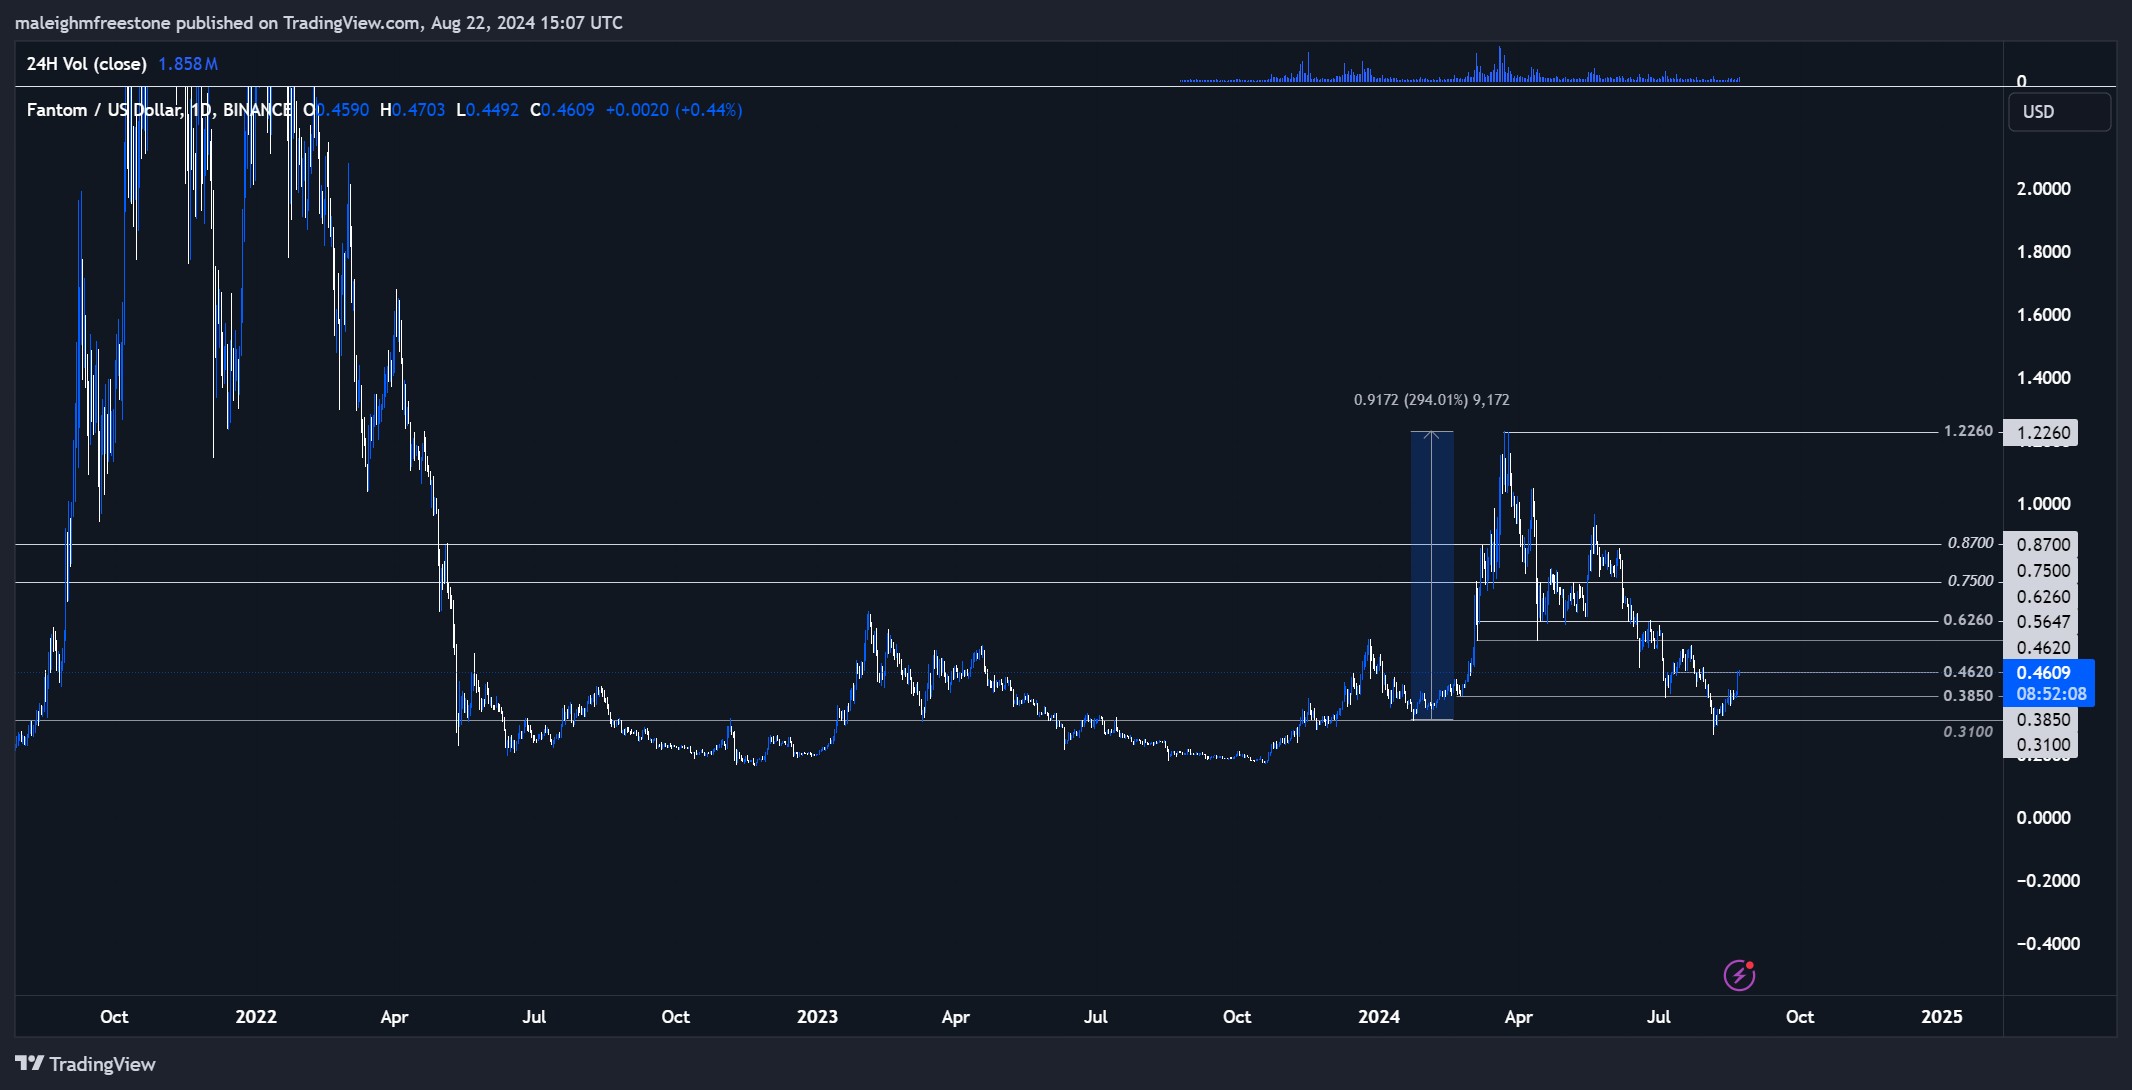
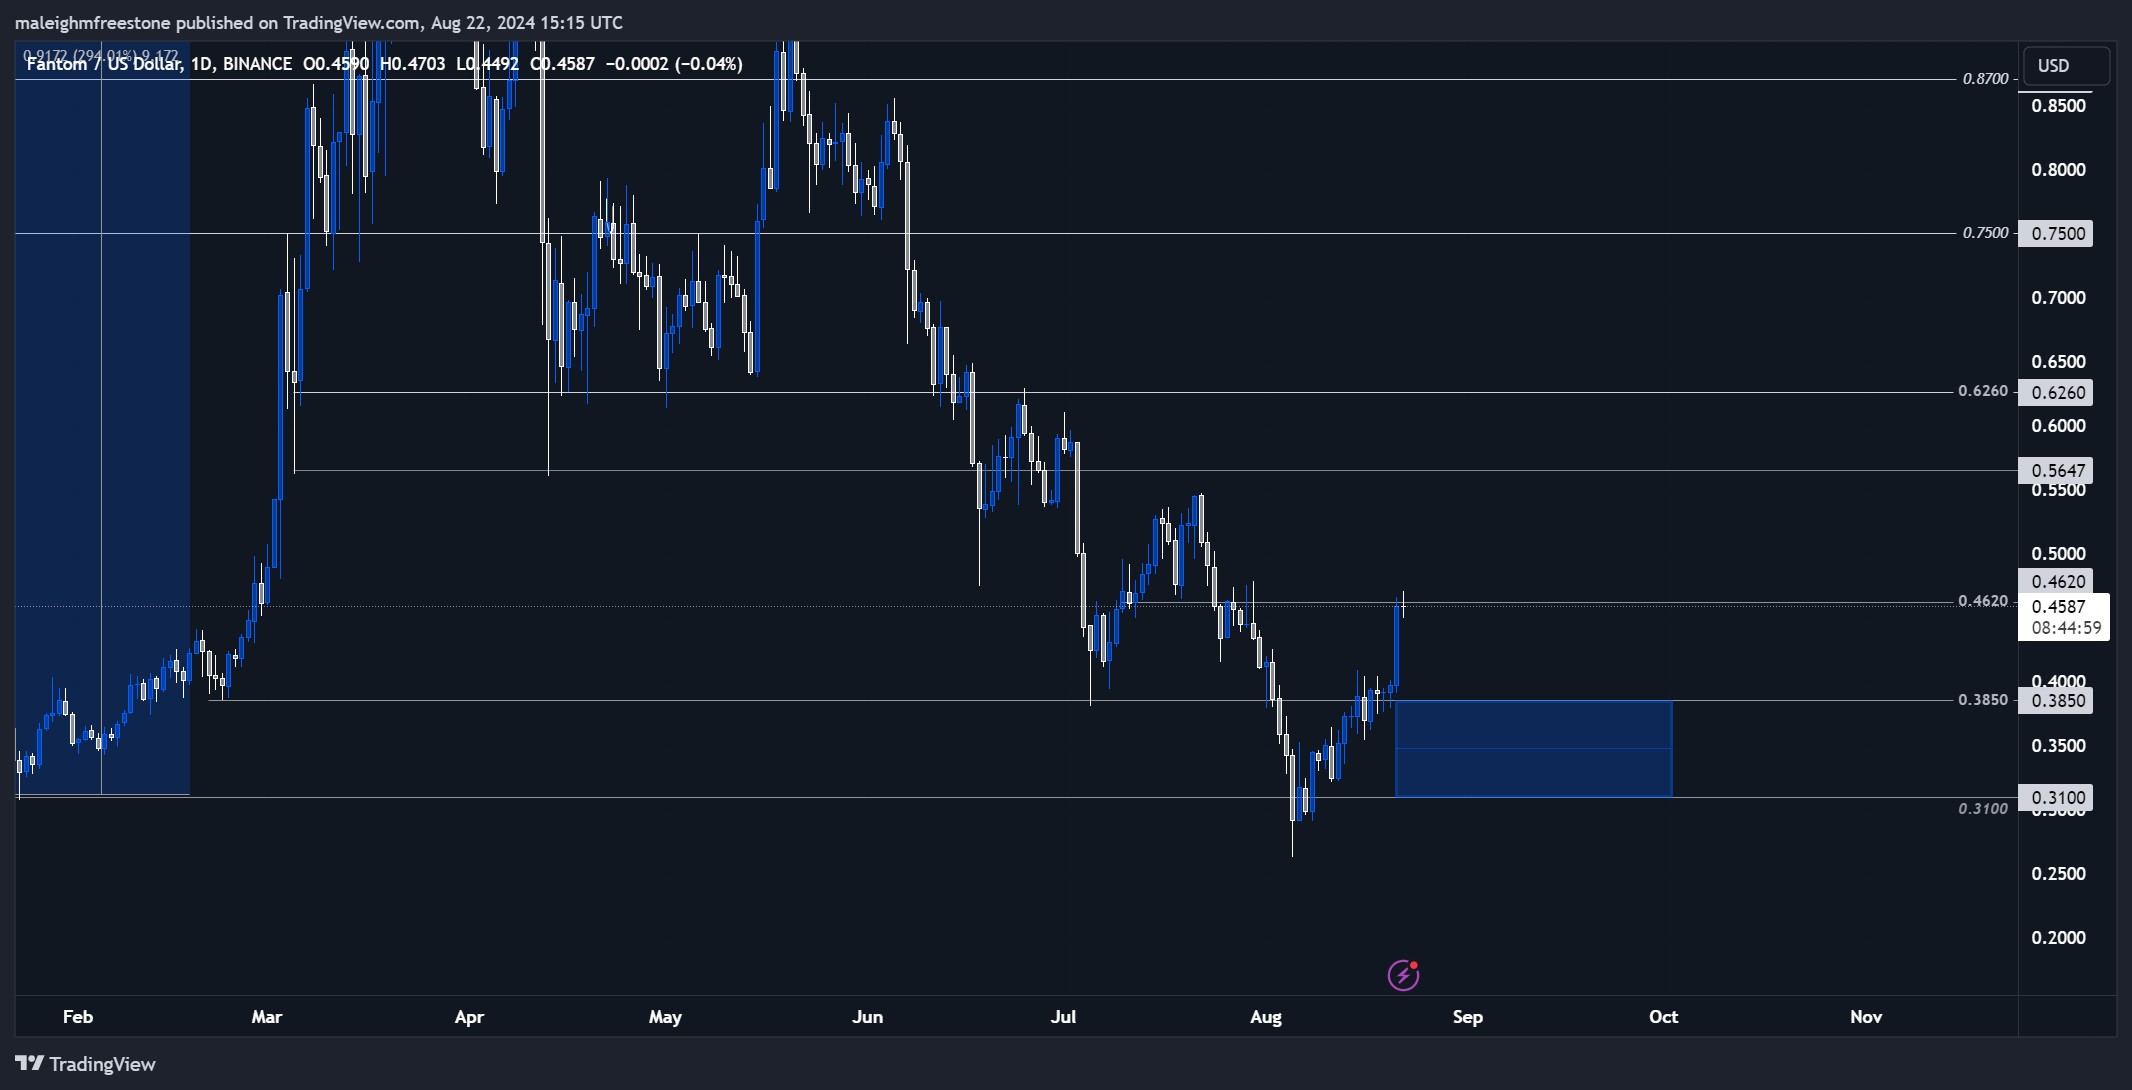
Fantom (FTM) is an interesting asset because, while its been around for previous cycles, just like some other altcoins which are really suffering, it's only really retraced back down to the January 2024 low.

Post Feature Image


That’s the level that sparked the 300% move from $0.30 to $1.20. So, this price point around $0.30—more specifically, we've labeled it at $0.31—is actually responsible for a huge swing where demand was found. The October lows are further down, around $0.17, which we’re still nowhere near. Recently, we saw a really nice bounce between the 7th and 8th of August, up around 50% to $0.4620.

Disclaimer: This is not financial or investment advice. You are responsible for any capital-related decisions you make, and only you are accountable for the results.
aligncenter size-full wp-image-299159

Liquidation Heatmap

When we look at the liquidation heat map for the asset, we can see liquidation leverage on the buy side building up just below that $0.385 price point. That’s where we've seen a really strong daily candle form yesterday. A lot of buys came in around there to push the price upwards. Going forward, we could potentially see a price reset back down to that $0.3850 level as well.
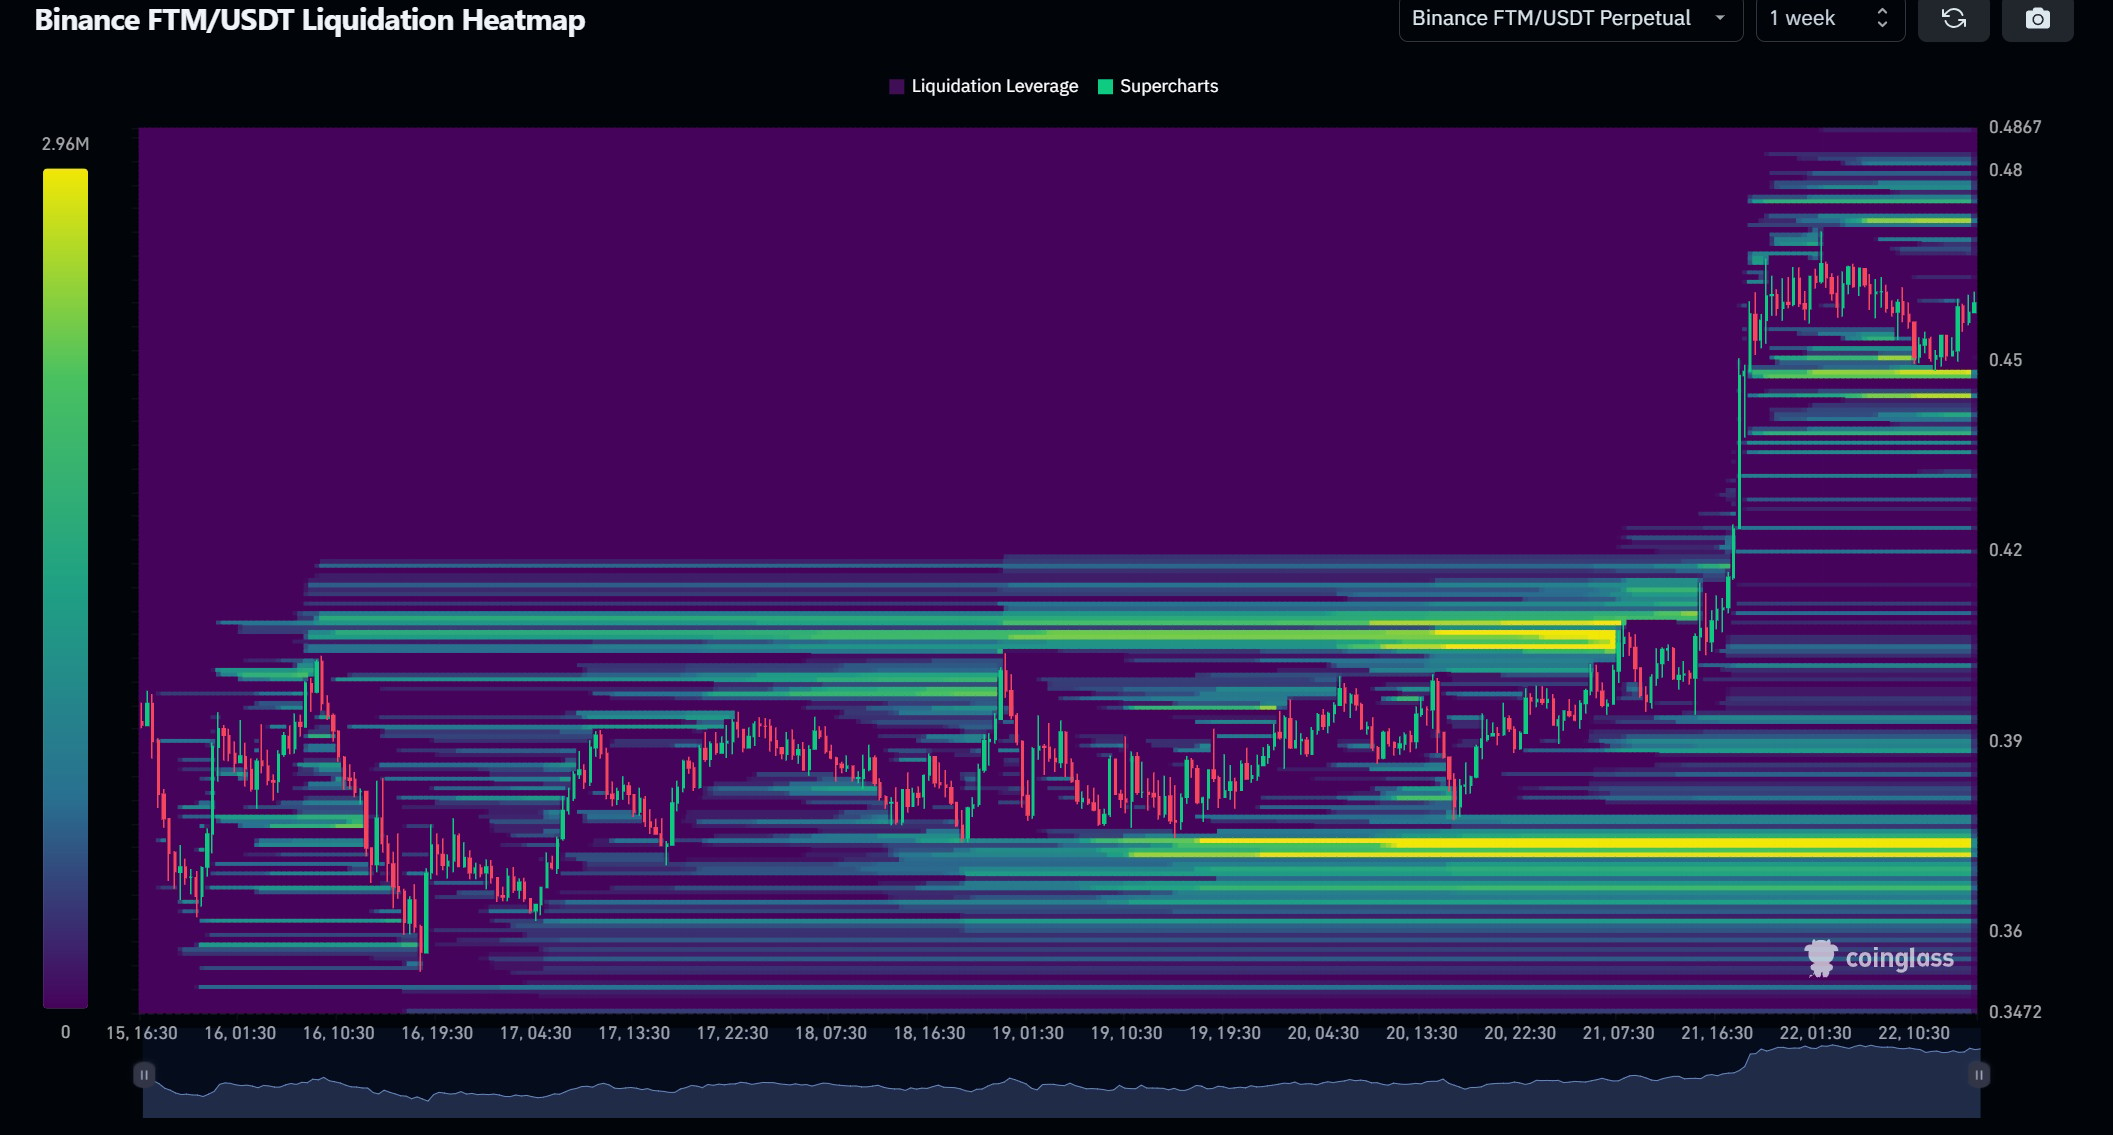
A heatmap showing liquidation levels for the Fantom FTM USDT trading pair on Binance, with leverage positions indicated in different colors, over a one-week

Market Mechanics

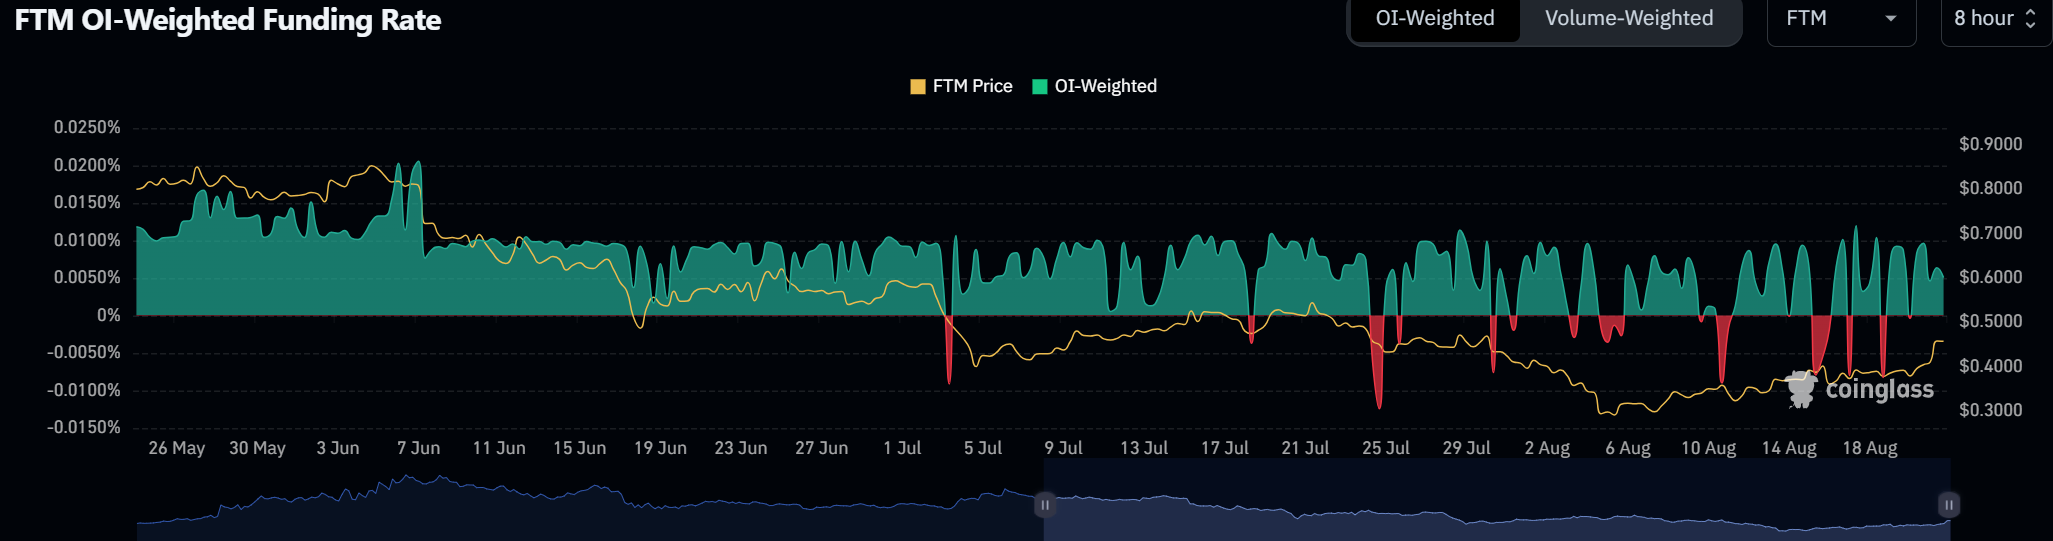
There isn’t a great deal to go on in terms of other market mechanics, but we’ll touch on them.

Funding: Funding is very evenly balanced between buyers and sellers—nothing much to note here. It means there is no impact that we need to consider from a bias on the long or short side

Chart showing Fantom (FTM) OI-Weighted Funding Rate with FTM price, highlighting positive and negative funding periods

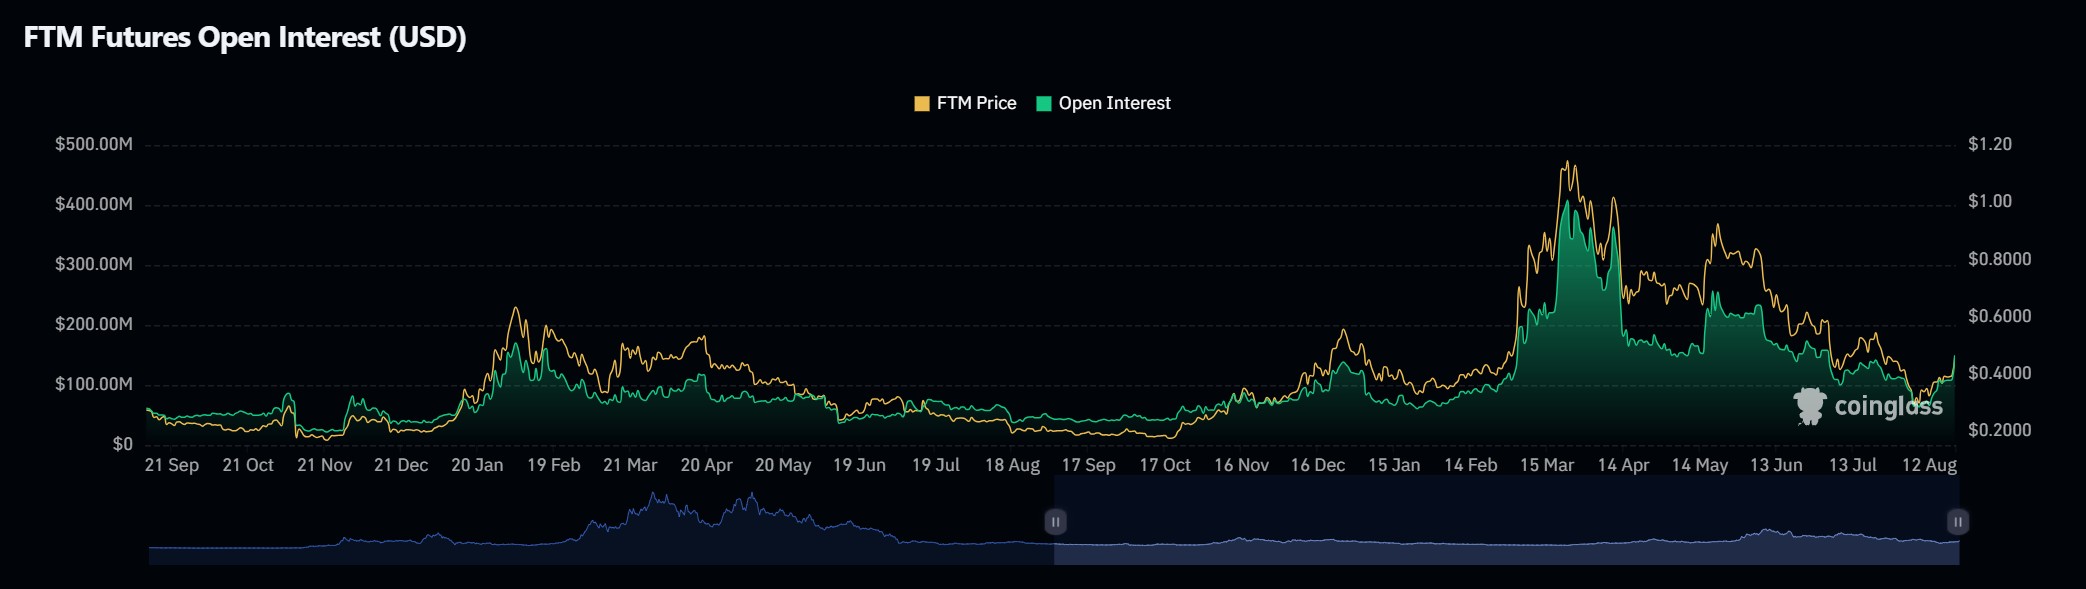
Open Interest: Open interest was at some pretty significant levels around $3.4 billion on March 23rd. Since then, leverage has been steadily leaving the system, and it’s currently at lows around $150 million. While there’s been a slight ramp-up over the last 24 hours, it’s really nothing to write home about.

Which gives us clear headroom and a balanced perspective and no worries of an unhealthy market needing to balance out.
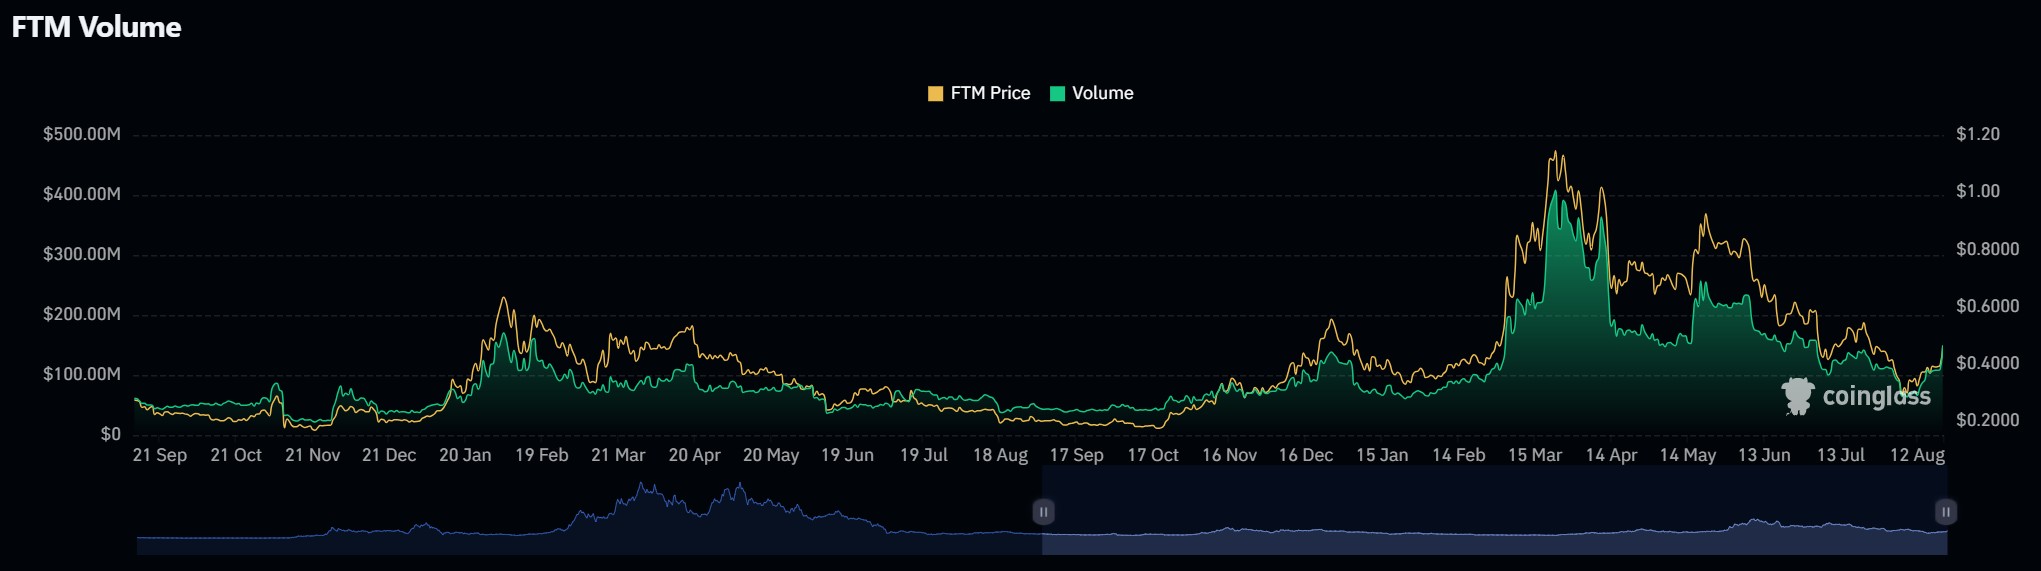
aligncenter size-full wp-image-299162

Volume

Volume is mimicking open interest—very low and not showing anything significant. It’s repeating the same sort of price pattern, which is still very low as well. So, market mechanics aren’t showing much, and we’re going to focus more on the charts and how to play this based on liquidation leverage.

We know there were buyers around that $0.385 price point, which pushed the price upwards. Sometimes these levels work as magnets and with there not really much else to touch on this can help as it allows us to narrow down the the metric with the most influence which in this case is the build up of liquidation levels which may attract price.

Chart showing Fantom (FTM) trading volume with FTM price, highlighting trends and volume fluctuations over time.

Playbook

Hypothesis

FTM's historical behavior shows that the $0.31 level is a key demand zone, as seen with the 300% rally from this point earlier this year. Given the recent bounce and the build-up of buy-side liquidation leverage just below $0.385, these levels could serve as prime areas to consider building spot positions for long-term play.

Key Levels

$0.3850: A critical level where recent buyer activity has been concentrated, making it a key area to consider for spot bids. $0.31: Another crucial accumulation zone tied to previous significant price movements.

Risk Management

Spot Accumulation: Given the strong historical bounce from $0.31 and the recent activity around $0.3850, the safest approach is to build spot positions around these two levels. This strategy allows for holding through market swings with a focus on long-term gains.

Something to think about:

Bear in mind, FTM has underperformed compared to many other assets across the board, but the downside moves and bearish price action are still correlated with the rest of the market. It’s not doing badly in that context. The swings to the upside, even during bearish periods, have been relatively positive, like this recent bounce. The fact that it hasn’t traded below the October lows suggests it might be performing a bit stronger than other older altcoins.

A candlestick chart showing the price of Fantom (FTM) against the US Dollar (USD), highlighting support and resistance levels

Cryptonary’s Take

Given the market mechanics, including the liquidation leverage and the historical significance of the $0.31 and $0.3850 levels, accumulating spot positions within this range seems like a solid strategy. If you're looking to take action, it might be wise to split spot bids across these two key levels and hold for a long-term play in the cycle.


Get started for free

Create your free account or log in to read the full article.

​

Germany

By signing up, you agree to our Terms & Conditions
Recommended from Cryptonary
BTC, ETH and More: Downside Targets Hit, All Eyes on the Recovery
PRO
Market Direction
BTC, ETH and More: Downside Targets...Bitcoin flushed into the Monthly OB at $65,650 before bouncing back, while Ethereum and Solana both ...
14 min read
Feb 6, 2026
Market Update: Bitcoin Approaches the Buy Zone
PRO
Market Updates
Market Update: Bitcoin Approaches t...Disclaimer: This is not financial or investment advice. You are responsible for any capital-related ...
9 min read
Feb 6, 2026
BTC, ETH and More: Markets Flush to Major Lows
PRO
Market Direction
BTC, ETH and More: Markets Flush to...Markets just snapped lower after BTC lost $80.5K and flushed into the $74K liquidity zone. Now we’re...
13 min read
Feb 3, 2026
Market Pulse: Jobs Data Surges, Rate Cut Odds Recede
PRO
Market Pulse
Market Pulse: Jobs Data Surges, Rat...Nonfarm payrolls smashed expectations, sending traders scrambling to reprice rate cut timelines. Wit...
3 min read
Feb 11, 2026
BTC, ETH and More: Relief Rally Stalls, Downside Risks Emerge
PRO
Market Direction
BTC, ETH and More: Relief Rally Sta...Last week’s relief rally played out with precision across majors, but the follow-through never came....
10 min read
Feb 10, 2026
Market Update: Broader Bottoming Process Expected
PRO
Market Updates
Market Update: Broader Bottoming Pr...We’ve likely seen the panic low; now comes the patience phase. Bitcoin’s move off $60k has eased imm...
7 min read
Feb 9, 2026
BTC, ETH and More: Downside Targets Hit, All Eyes on the Recovery
PRO
Market Direction
BTC, ETH and More: Downside Targets...Bitcoin flushed into the Monthly OB at $65,650 before bouncing back, while Ethereum and Solana both ...
14 min read
Feb 6, 2026
Market Update: Bitcoin Approaches the Buy Zone
PRO
Market Updates
Market Update: Bitcoin Approaches t...Disclaimer: This is not financial or investment advice. You are responsible for any capital-related ...
9 min read
Feb 6, 2026
BTC, ETH and More: Markets Flush to Major Lows
PRO
Market Direction
BTC, ETH and More: Markets Flush to...Markets just snapped lower after BTC lost $80.5K and flushed into the $74K liquidity zone. Now we’re...
13 min read
Feb 3, 2026
Research
Top PicksDeep DivesPassive IncomeAirdrop Reports
Analysis
Market UpdatesMarket DirectionMarket PulseLivestreams
Tools
Market DirectionAssets & PicksAirdropsPortfolio Tracker
Cryptonary
Affiliate programEducationPrivacy PolicyTerms & ConditionsContact UsWrite for usTeam
Stay connected
Disclaimer: The information provided on this website is for educational and informational purposes only and does not constitute financial, investment, legal, or tax advice. Cryptonary is not a licensed financial advisor. All content is shared without any guarantee of accuracy or completeness. You are solely responsible for your investment decisions. Always do your own research and consult with a licensed professional before making financial choices. Past performance is not indicative of future results.

×
popupimage
Our Latest Utility Token Research ReportPreviously locked for Pro members, now available to read in full.
  • tickThe utility token we're tracking closely
  • tickWhy we believe it's still early in the cycle
  • tickWhat we're watching to confirm a structural shift
​
Germany

No spam. No hype. Just the research.