Save 23% ($351) & Get a Free 1-1 Call with our Team ⏰ : 0d 2h 59m 43s
Helium (HNT) price prediction: Bullish potential after 600% surge
Helium (HNT) has shown notable price action on the monthly time frame, particularly since October 2023, where it experienced an impressive 600% surge. This rally was followed by a corrective phase, bringing the price back down through June. Now, there are signs that Helium might be establishing a swing low, potentially setting the stage for another upward move and the formation of a new high.

Key observations: significant rally and correction:
Helium surged by 600% since October 2023, a move that underscores strong demand. The subsequent correction was expected, and the price action suggests that Helium might be setting up for another upward expansion. 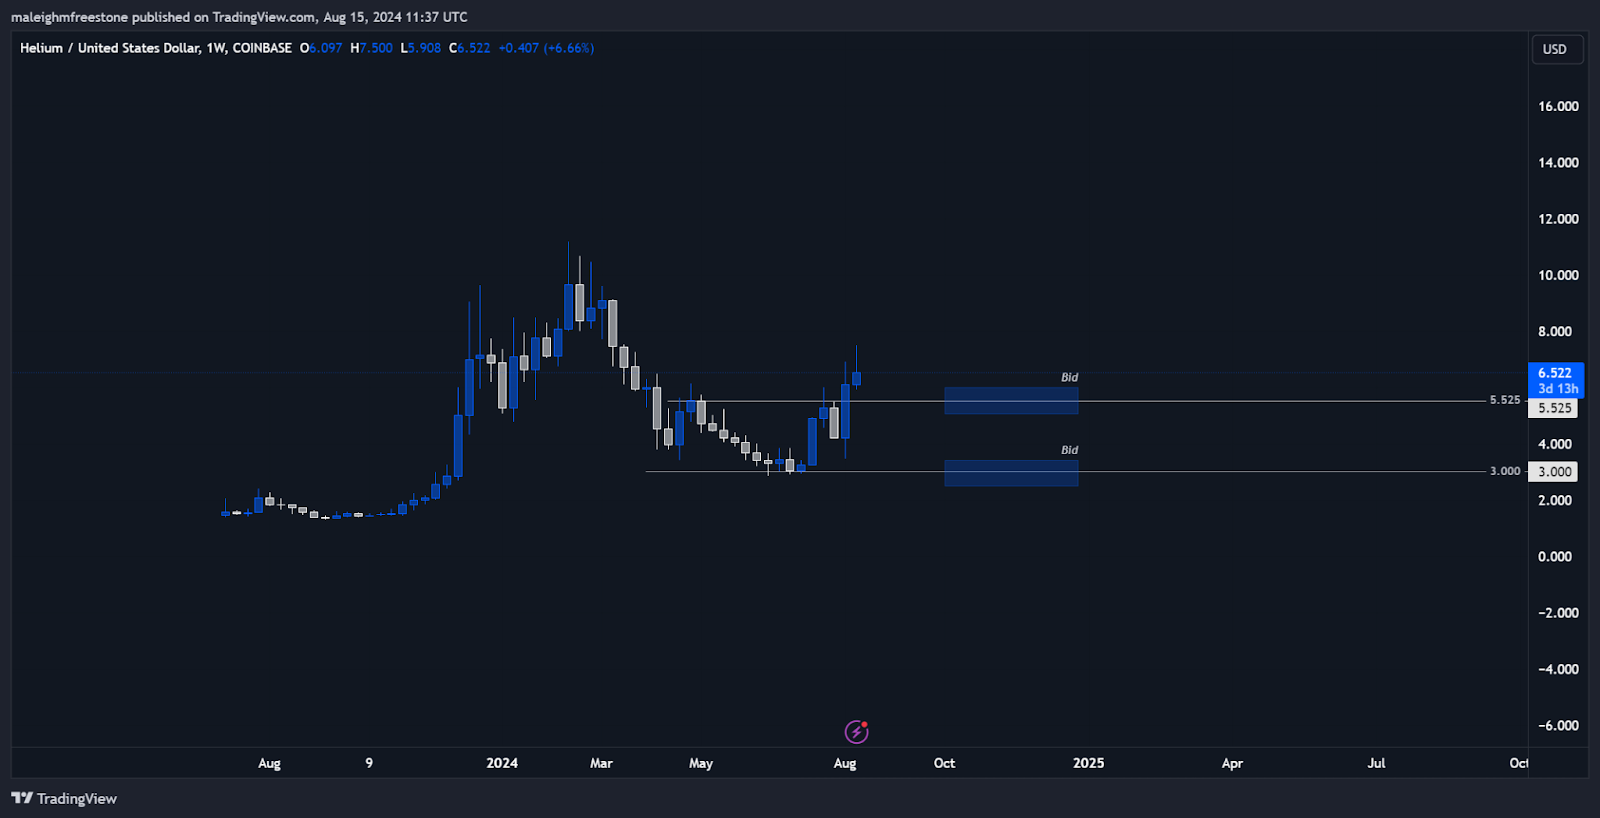
Encouraging price action:
The recent monthly candles—particularly those in July and August—are showing strength and resilience. These candles indicate that Helium is holding up well, with its price action relatively uncorrelated with broader market trends. 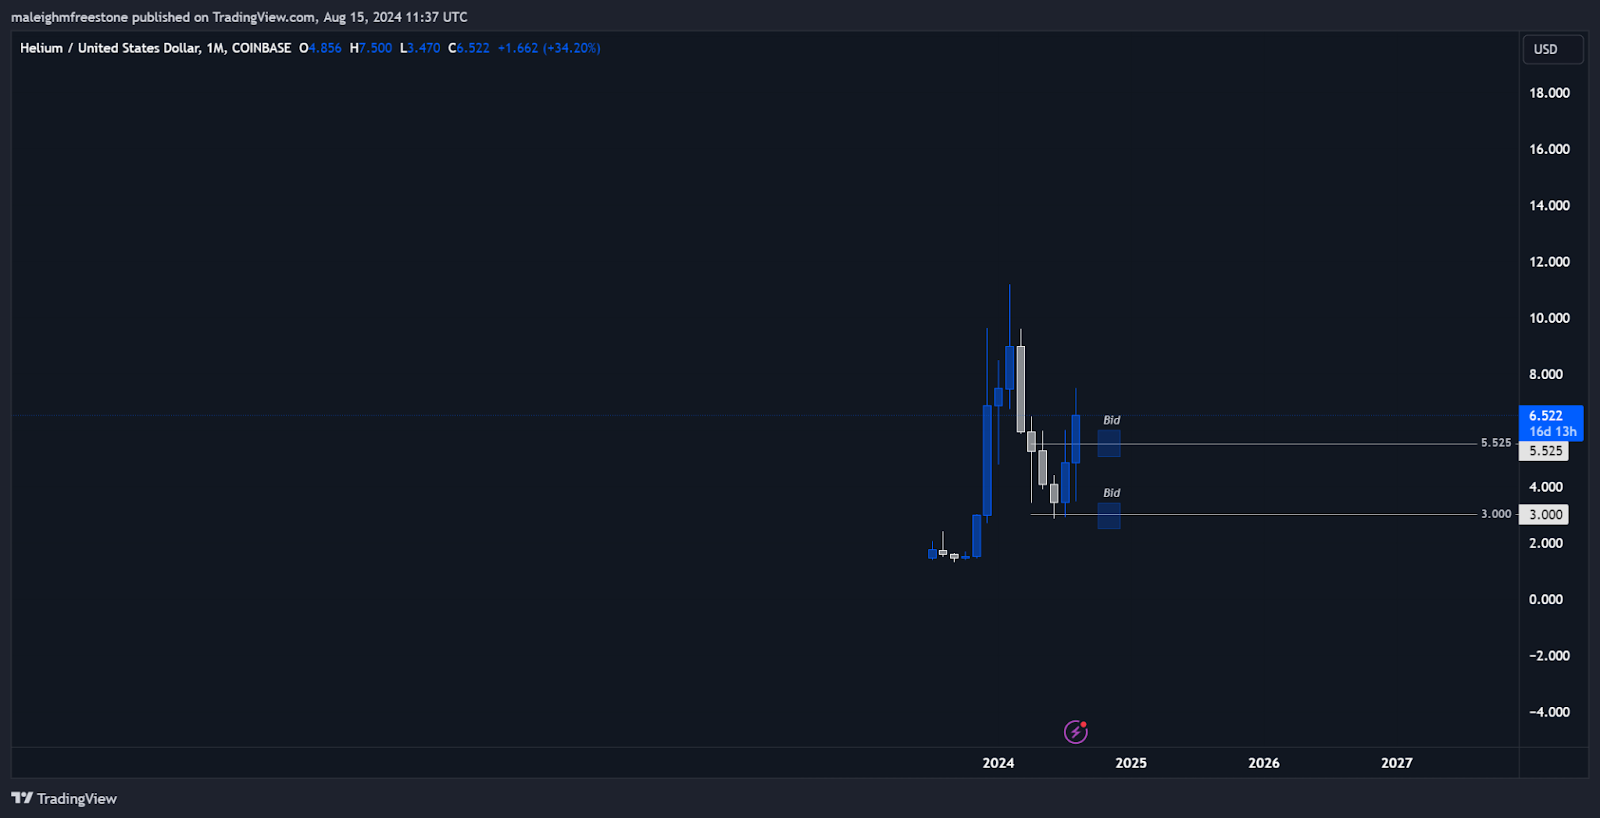
Breakout above key resistance:
In April, a swing high and a lower high were set at 5.525. Last week, Helium broke above this level, closing significantly higher and currently trading above it. This breakout could signal the end of the short-term bearish structure, indicating a potential shift towards a bullish trend.
Potential scenarios: Bullish accumulation strategy:
Bidding around the 5.525 level could be a strategic move for a light spot position, considering the recent breakout. Trading above this level reduces the likelihood of a significant retracement, suggesting it might now act as a support zone where demand could be found. If the price pulls back slightly, another entry point could be around the $3.00 level, although the break above 5.525 indicates a shift in sentiment towards a more bullish outlook. Bullish continuation:
The flip in sentiment, as indicated by the break of the lower structure and the current strong monthly candles, often suggests a shift towards a more bullish market outlook. Helium’s chart shows signs of strength, positioning it as one of the stronger assets within its class.
Disclaimer: This is not financial or investment advice. You are responsible for any capital-related decisions you make, and only you are accountable for the results.
Conclusion: Bullish/Positive:
Helium's chart is demonstrating strong bullish potential, particularly after breaking above the 5.525 level. The recent monthly price action suggests resilience and a potential shift away from the previous bearish structure. Accumulating around the 5.525 level could be a prudent strategy, as this level may now act as a support zone. Helium's technical setup looks strong, offering a promising outlook compared to many other assets in the market.
Recommended from Cryptonary


