Save 23% ($351) & Get a Free 1-1 Call with our Team ⏰ : 0d 2h 59m 44s

Therefore, we don't recommend taking any mad leverage trades here; we'll look to add the coins that we like upon revisiting the lows or the horizontal supports.
Currently, I (Tom) have a big exposure to majors (BTC, ETH and SOL) and memes (WIF and POPCAT). So, the plan here for myself is to accumulate more SOL, which I'd then look to put to work in the coming weeks and months when liquidity conditions improve.
I'll add to my SOL bags on more major dips, and then when liquidity improves, I'll put that SOL into altcoins (likely SOL ecosystem plays) and potentially more memes (again, likely to be memes on SOL).
In this kind of market condition, lots of leverage swing trades can actually do more damage to your portfolio. In a month, you may look back and see that you have lost a significant percentage of your portfolio, yet prices may be where they are currently or 5% higher, say.
You'll then ask yourself, "Why didn't I just leave it alone? I'd be better off."
We see Q3 onwards as the time when crypto really gets going again, and BTC and altcoins see new highs.
We hope the above helped explain where we see things currently. Now, in today's market direction, we dive into some analysis of the fan favourites.
TLDR
- The market is broadly range-bound; caution is advised against excessive leverage trades currently.
- Bitcoin is consolidating in a bull flag pattern, ranging between $56K and $66K, which may persist for weeks.
- We view SOL as an attractive buy under $131 for long-term accumulation.
- RUNE is stuck in a bear flag, adding exposure only considered at $4.78 support.
- LINK's technicals appear bearish; we would only consider light buys considered under $13.11.
- RNDR is outperforming; a bullish breach of $10.66 resistance could fuel further gains.
Disclaimer: This is not financial or investment advice. You are responsible for any capital-related decisions you make, and only you are accountable for the results. "One Glance" by Cryptonary sometimes uses the RR trading tool to help you quickly understand our analysis. These are not signals, and they are not financial advice.
BTC
We'll keep the BTC analysis short and sweet before we discuss more of the altcoin plays we cover less regularly.The mechanics for Bitcoin are much better here than they have been for some time. Open Interest is still at moderate levels, while the Funding Rate remains between 0.00% and 0.01%, indicating a relatively even positioning between Longs and Shorts—this is a healthy setup.
- Bitcoin has remained in the bull flag pattern, which we first called for on April 5th, very early on.
- Zooming in, price has fallen below the local level of $63,300 which we have identified as a key local support/resistance, depending on where price is.
- Price is now at the prior local support of $61,200, which was the previous low before we saw a break down to $57k.
- However, price does remain in the top half of the bull flag, which then technically leans to a bullish setup.
- This period of price consolidation is meaningfully resetting the RSI on the larger timeframes, such as the 3D and the Weekly. This is positive in the mid-and long-term.
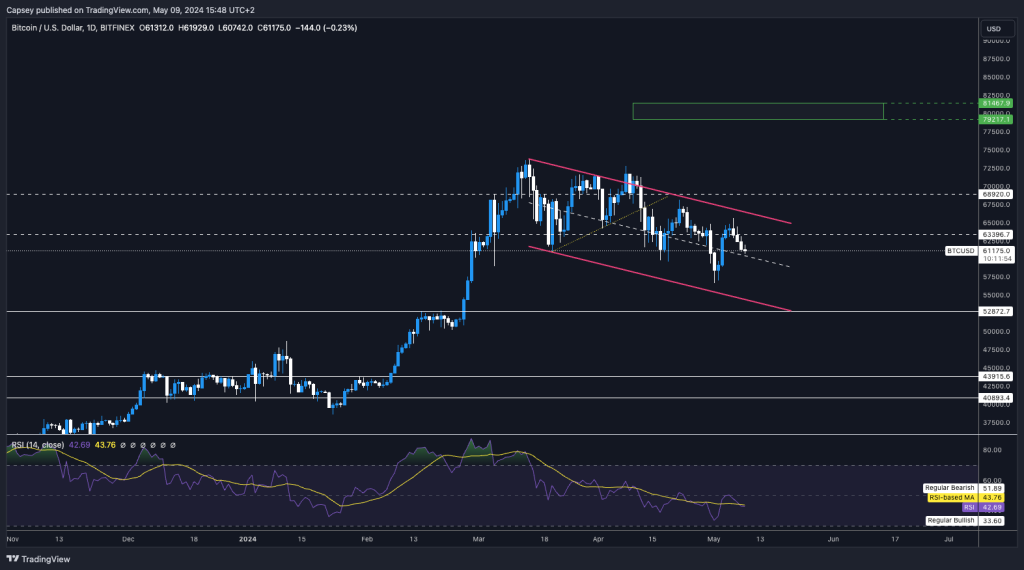
Cryptonary's take
This current range-bound price action in the larger bull flag should be no surprise to us.This is something we called for in early April, and we've waited for pullbacks in prices to add to our bags. It's likely we will remain range-bound between $56k and $66k for more weeks (maybe another month or two) to come.
While we don't rule out a BTC move to the low $50K area, it's not our most likely outcome. We believe that price will remain range-bound for now. We're not looking to add BTC at current prices, but we would consider adding BTC again at $56k or $57k or below this level if there is a breakdown.
If there is a breakdown, we would expect it to be relatively swift as it'll likely be bought up quickly.
SOL
Like BTC, SOL's mechanics are clean. We have Open Interest at the mid-levels, well off the excessive levels we saw a few months back.Alongside this, Funding is at 0.01%, meaning there's a slight bias to be Long rather than Short, but not an overly positioned unhealthy bias.
- Overall, SOL is fine from a leverage point of view and nowhere close to any levels of excess, which is essentially what we look at mechanics for.
- SOL has remained range bound also, between the support of $131 and the resistance of $151.
- We can see that when price has dropped below $131, there's been lots of liquidity/bids for SOL, especially if SOL has touched $120 or slightly lower.
- The RSI has reset on all major timeframes, which is positive for the price in the mid-term.
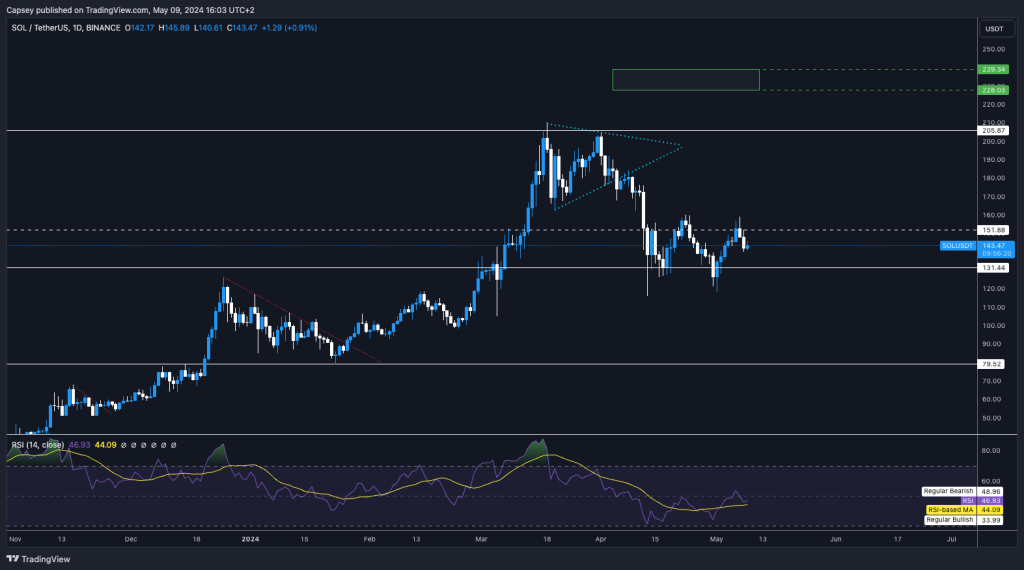
Cryptonary's take
Again, we're just going to keep this simple for now while the price is between $131 and $151. We believe that the price will eventually break out of $151 and close positively, pushing it substantially higher.However, until then, we'll look to keep hold of our bags—we're not looking to sell at these prices—and if SOL does drop below $131 and into the $120s, we'll look to add to our bags. SOL sub $131 is an attractive entry for the long term. We'll remain patient here, and we'll look to consistently add to our bags sub $131.
RUNE
RUNE plummeted from the high of $11.02 and has formed a bear flag/channel pattern. This flag pattern has also formed between a horizontal support of $4.78 and a resistance of $6.08.- Price is currently at the resistance level of the horizontal resistance and the top border of the flag and may, therefore, find it hard to break out.
- RUNE may need the market as a whole to break out in order to aid its own breakout.
- If RUNE can break out, the first target would be $7.28.
- The RSI has now reset on all major timeframes following this more than 50% correction from RUNE.
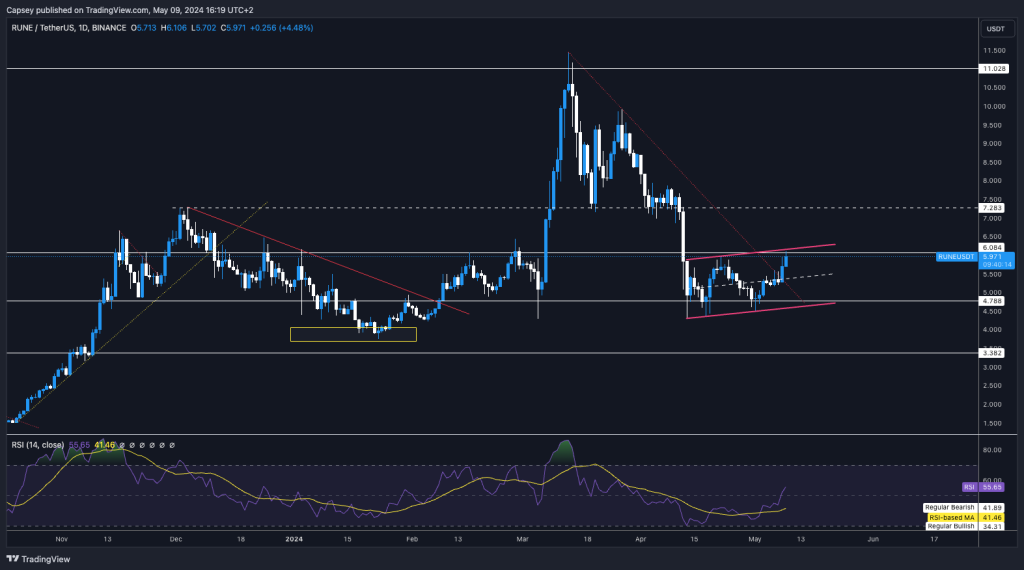
Cryptonary's take
I (Tom) personally do not hold any RUNE. However, if I were looking to accumulate more RUNE, I'd look to add towards the bottom of the range, which is the horizontal support at $4.78.LINK
This is another coin that has created a large bear flag pattern after its more significant price drop from $17.74.- Price has found support and did initially bounce from the horizontal support of $13.36 and then Yellow Buy Box between $13.11 and $14.11.
- Price is currently below the 50% midline of the bear flag, which is not positive for price, but it is currently above the horizontal support of $13.36.
- LINK had created two bull divs, which is possibly why we got the slight bounces; however, you'd have expected them to be more.
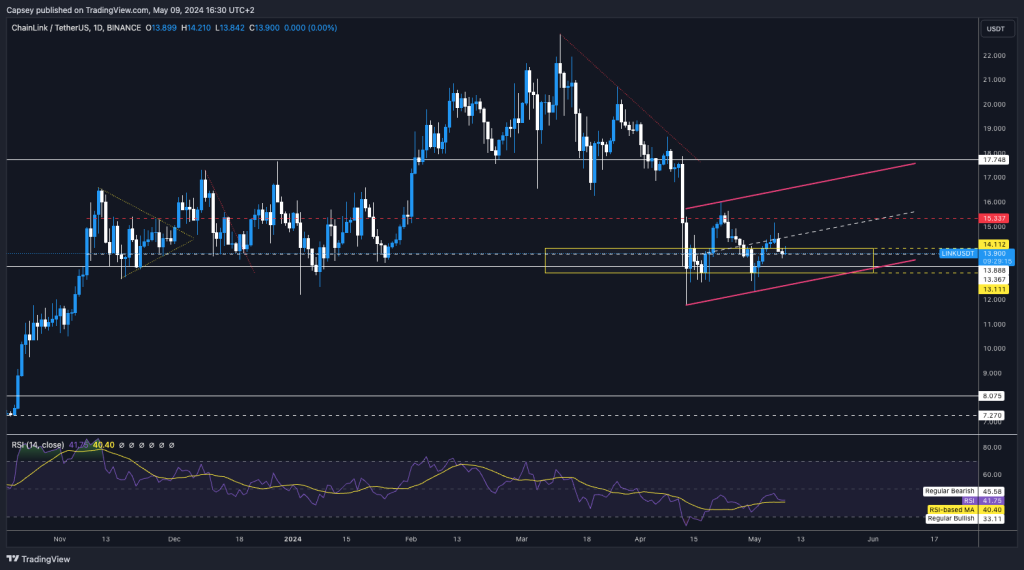
Cryptonary's take
From a TA perspective, LINK doesn't look great here in this bearish formation. However, if price does fall below $13.11, we'd likely look to add a small amount simply just to have some very light exposure and with what would look to be long-term attractive prices.RNDR
- RNDR has absolutely been one of the coins that has recovered the best from the lows that were put in around April 12th.
- Price then put in a bull div with the new low a few weeks later whilst the RSI set a higher low. This was enough to fuel the move higher.
- We have identified a resistance zone rather than a resistance line. This zone is between $10.30 and $10.66. Price is currently above this level. If we can get a positive close above this grey box/resistance zone, and price can build support on top of it, that'll be very positive for price in the short and medium term.
- If price does reject, there is a local support at $9.30.
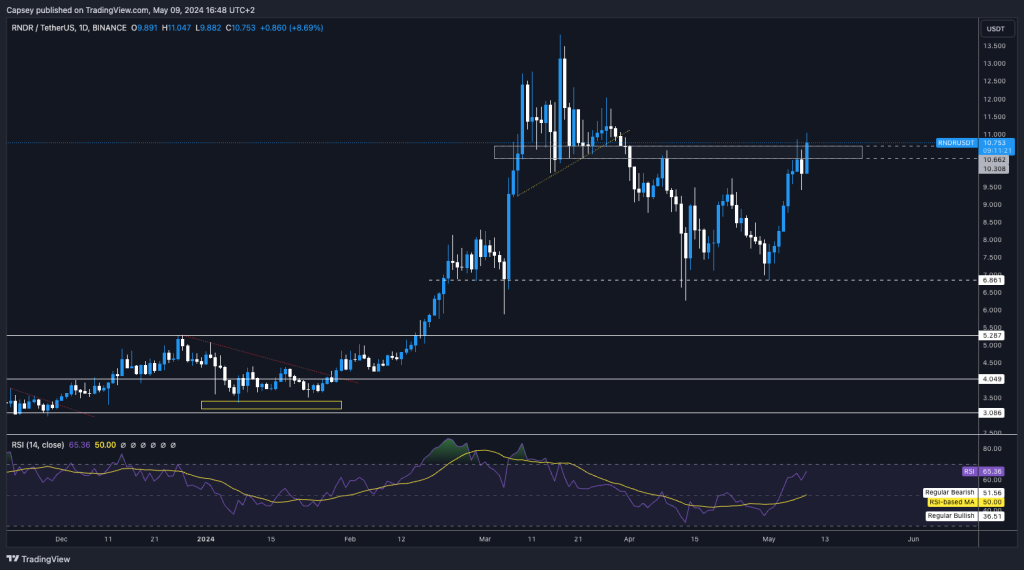
Cryptonary's take
Render is a SOL ecosystem play that has performed very well, particularly in comparison to other coins. RNDR is now at a crucial resistance level. A positive close above $10.66 and then price hammering out support above this level would be very good for future positive price action. We wouldn't look to add at current prices as the level to add was in the $7.00 range.Recommended from Cryptonary


