Save 23% ($351) & Get a Free 1-1 Call with our Team ⏰ : 0d 2h 59m 43s
This is what BTC will do now... | Jan 19th
Your time will come. Don't rush. Treat your portfolio like a collection of valuables and have faith in the process. The market is NOT primed for all-time highs right now. However, there are still countless opportunities out there if you know where to look, and that's what we will be doing in this week's report.
Disclaimer: Not financial or investment advice. You are responsible for any capital-related decisions you make, and only you are accountable for the results.
TLDR
- We believe The Total Market Cap will surpass $1T again in the coming weeks.
- Bitcoin and Ether need to hold their 2017 all-time highs to prevent downside.
- Is there more upside to come? YES. We believe there is more upside to come from this rally. Keep reading to find out why.
Total Market Cap
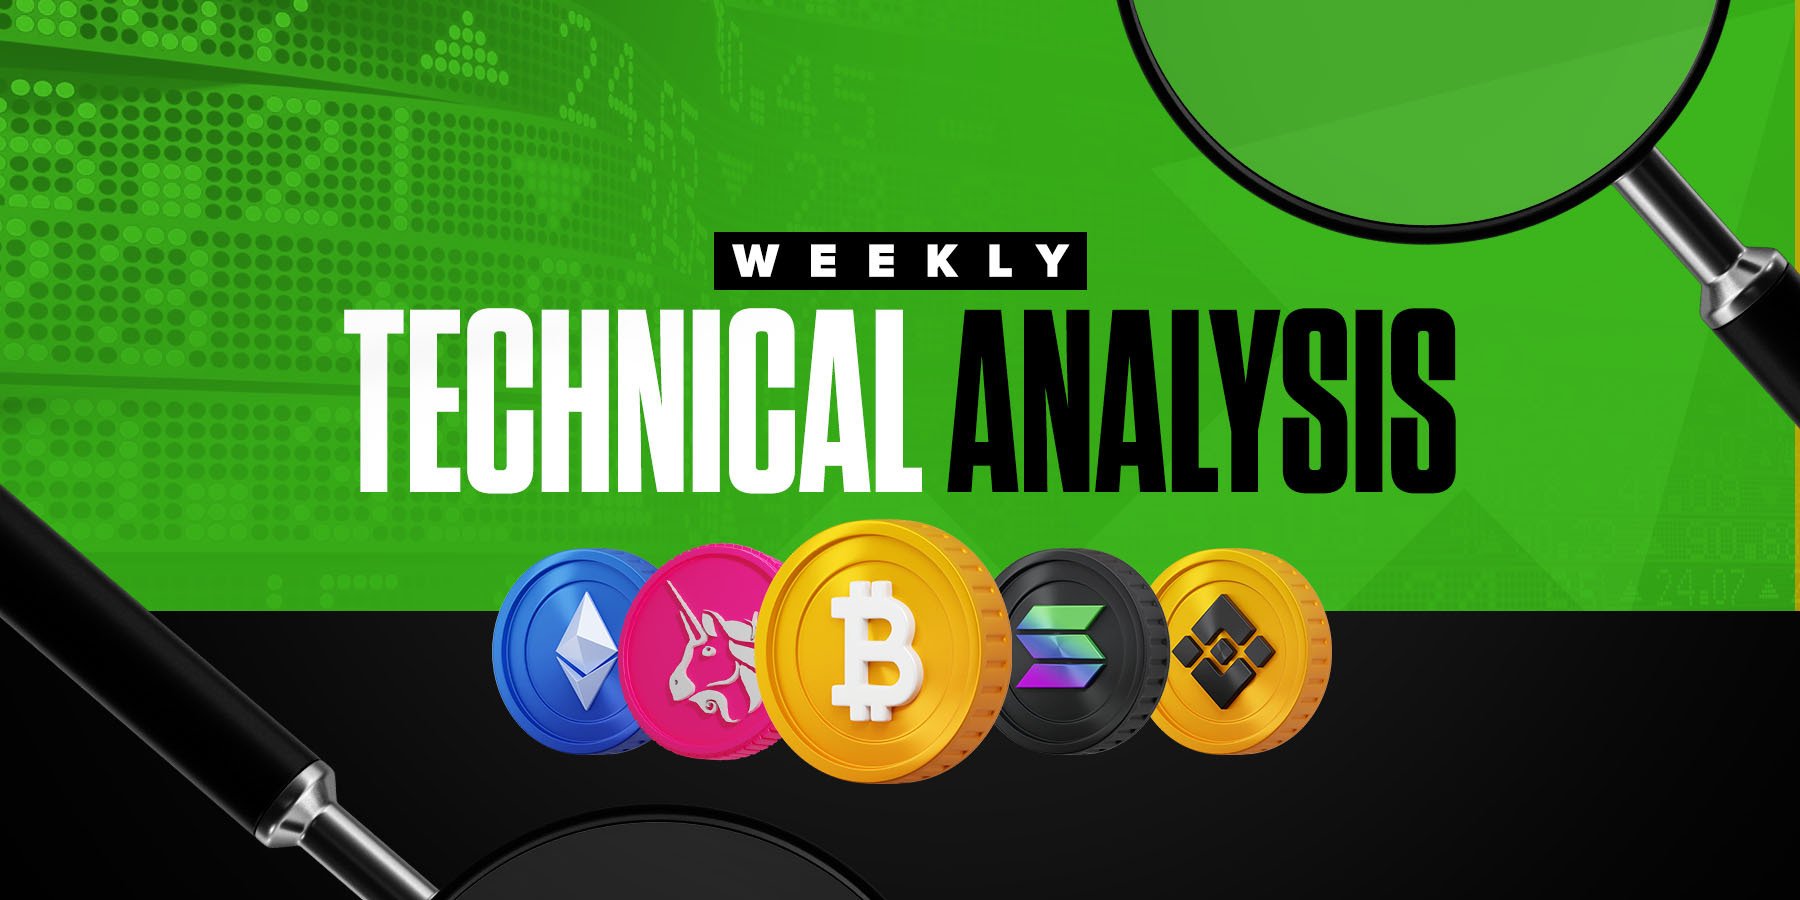
The Total Market Cap index represents the entire valuation of the cryptocurrency market. We track this index to understand where the market is now and where it will go. Every pack of wolves has an alpha male - this chart is the alpha male of the crypto pack because where this goes, the entire market follows.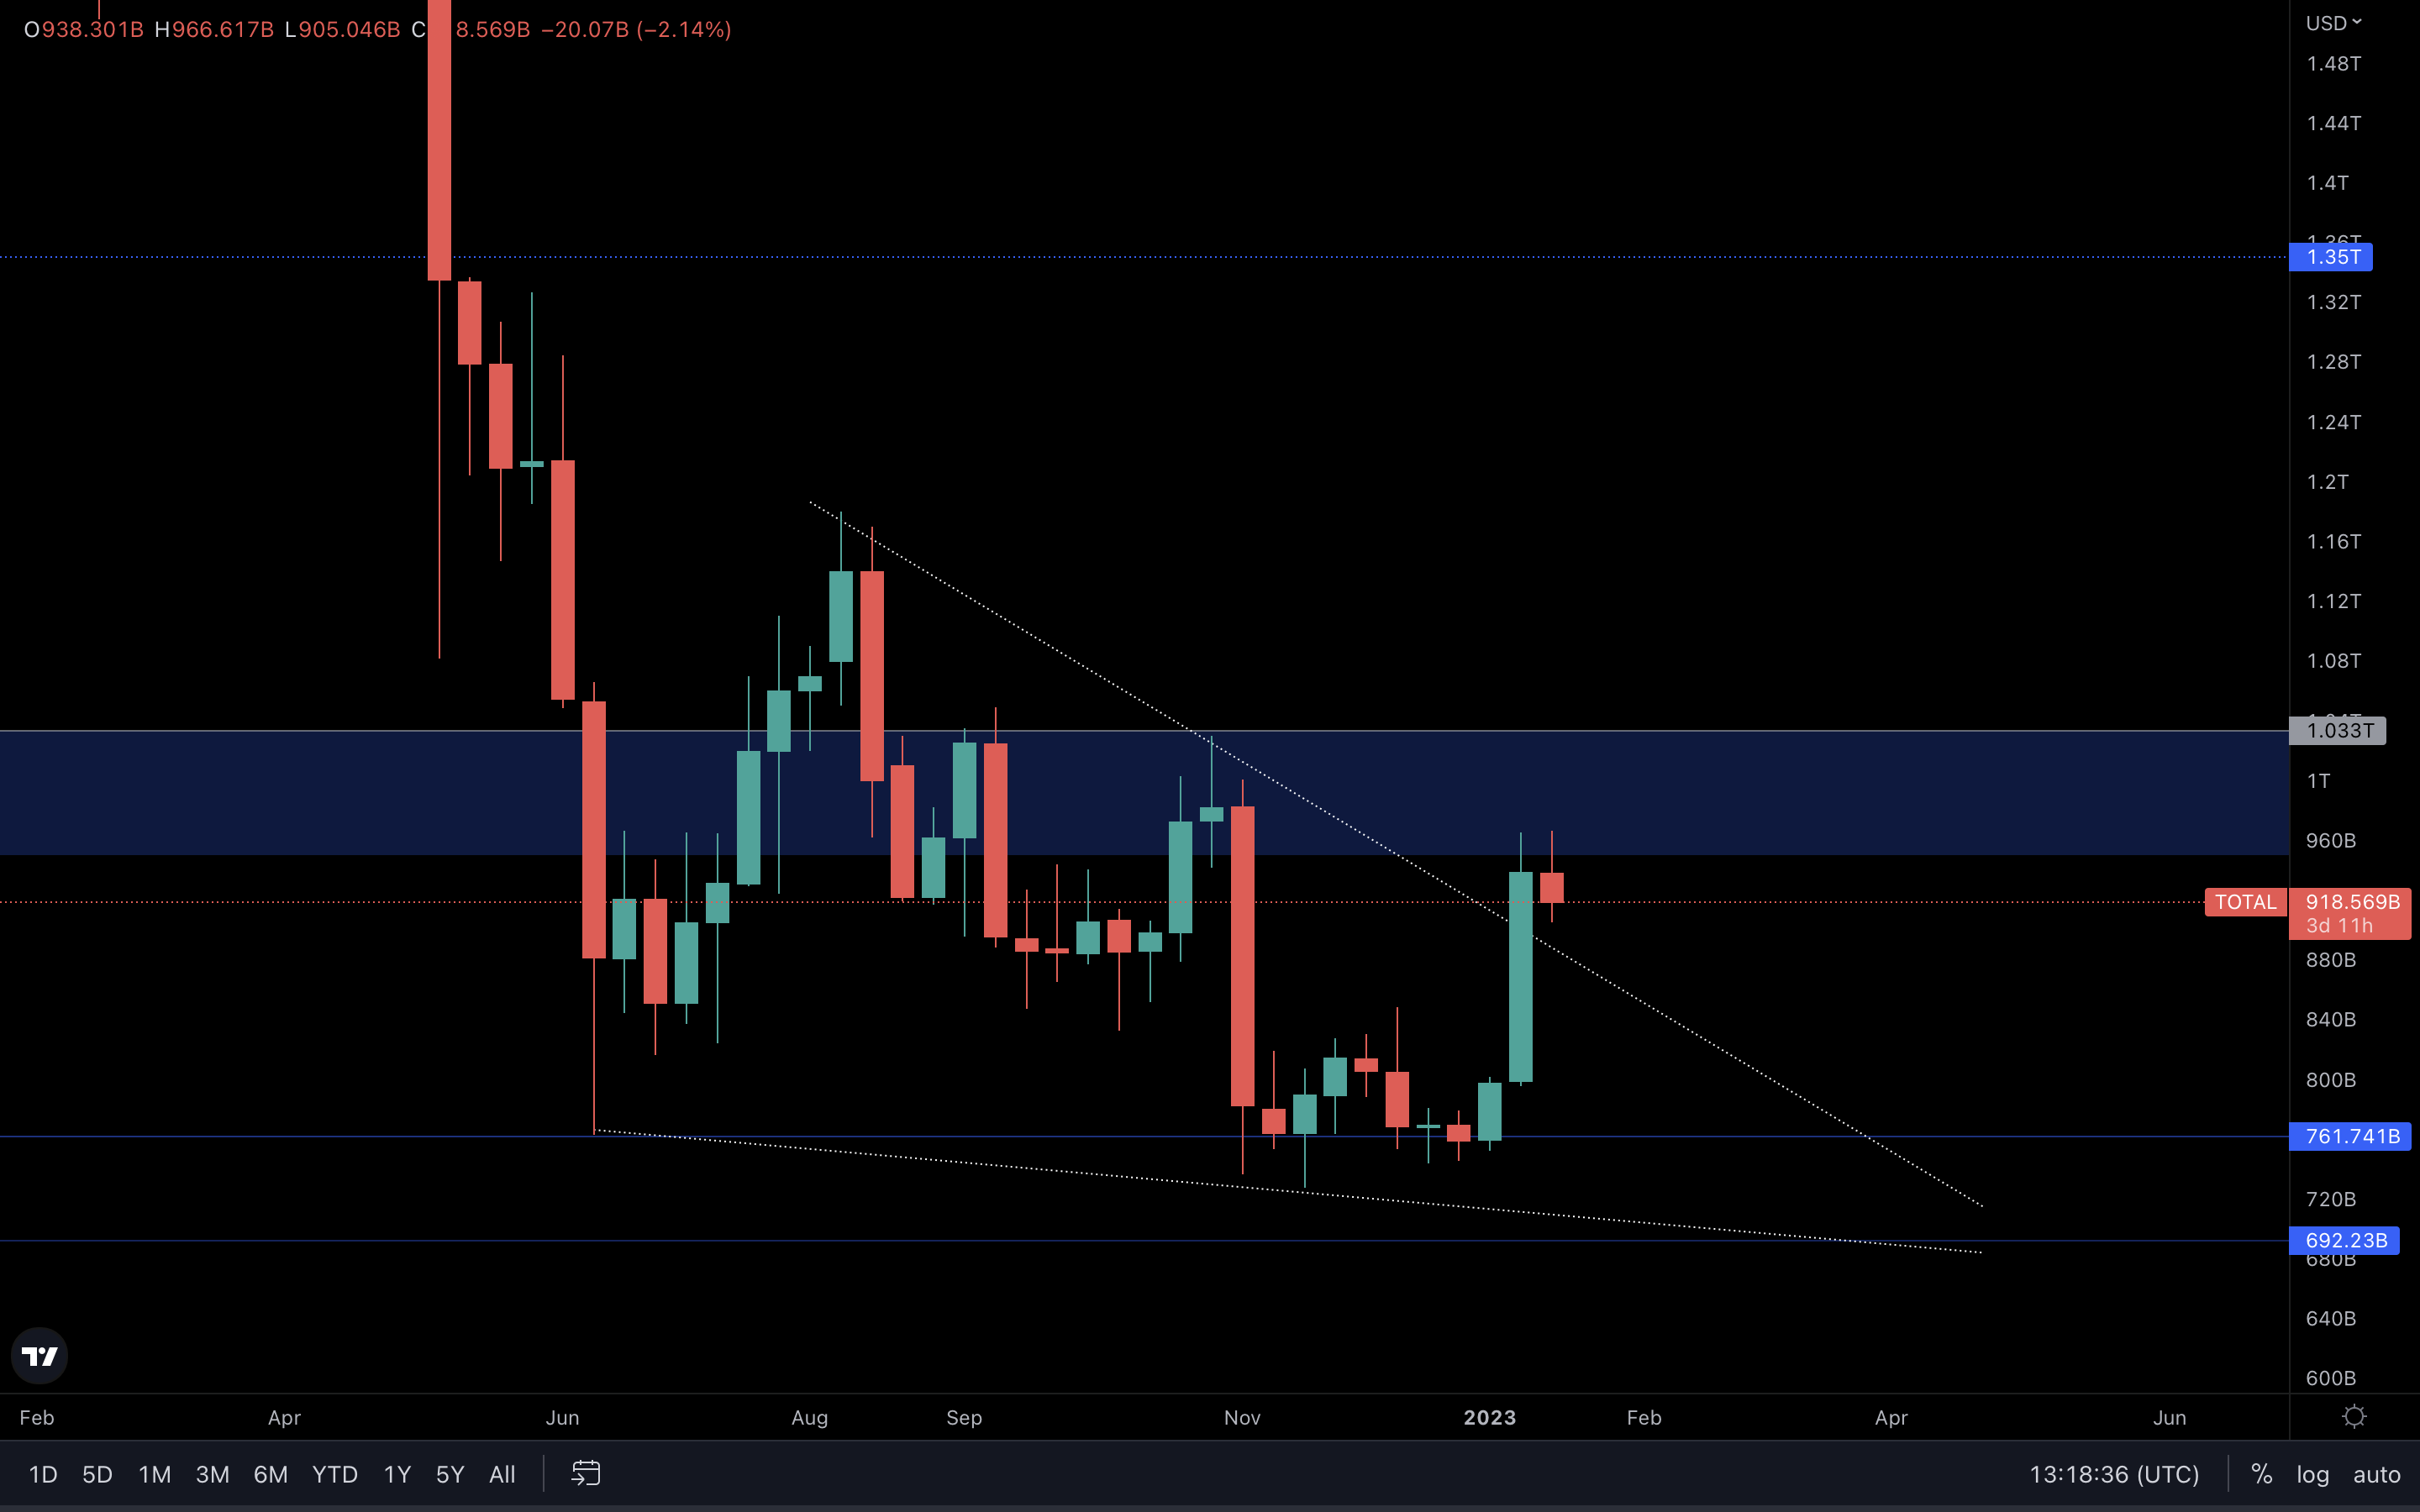
The Total Market Cap is still above the previous resistance trend line that was broken last week. This leaves room for a move to $1.03T which is ~11% away from the current price.
We could see the index slow down in the short term after buyers stepped in aggressively last week and pushed the index ~21% in 7 days, with no pause whatsoever. If you’ve been checking our Discord, then you already know that the RSI (Relative Strength Index) indicator has previously reached a value of 89 on the daily timeframe, indicating sellers might step in and calm the waters for a while.
What you’re seeing on this chart remains a valid breakout for now. A move to $1.03T will likely happen in the next few weeks. If we manage to see a reclaim of that level, then $1.35T is next.
Altcoins Market Cap
The Altcoins Market Cap index represents the entire valuation of the altcoins market. Imagine all altcoins in one basket and Bitcoin in another one.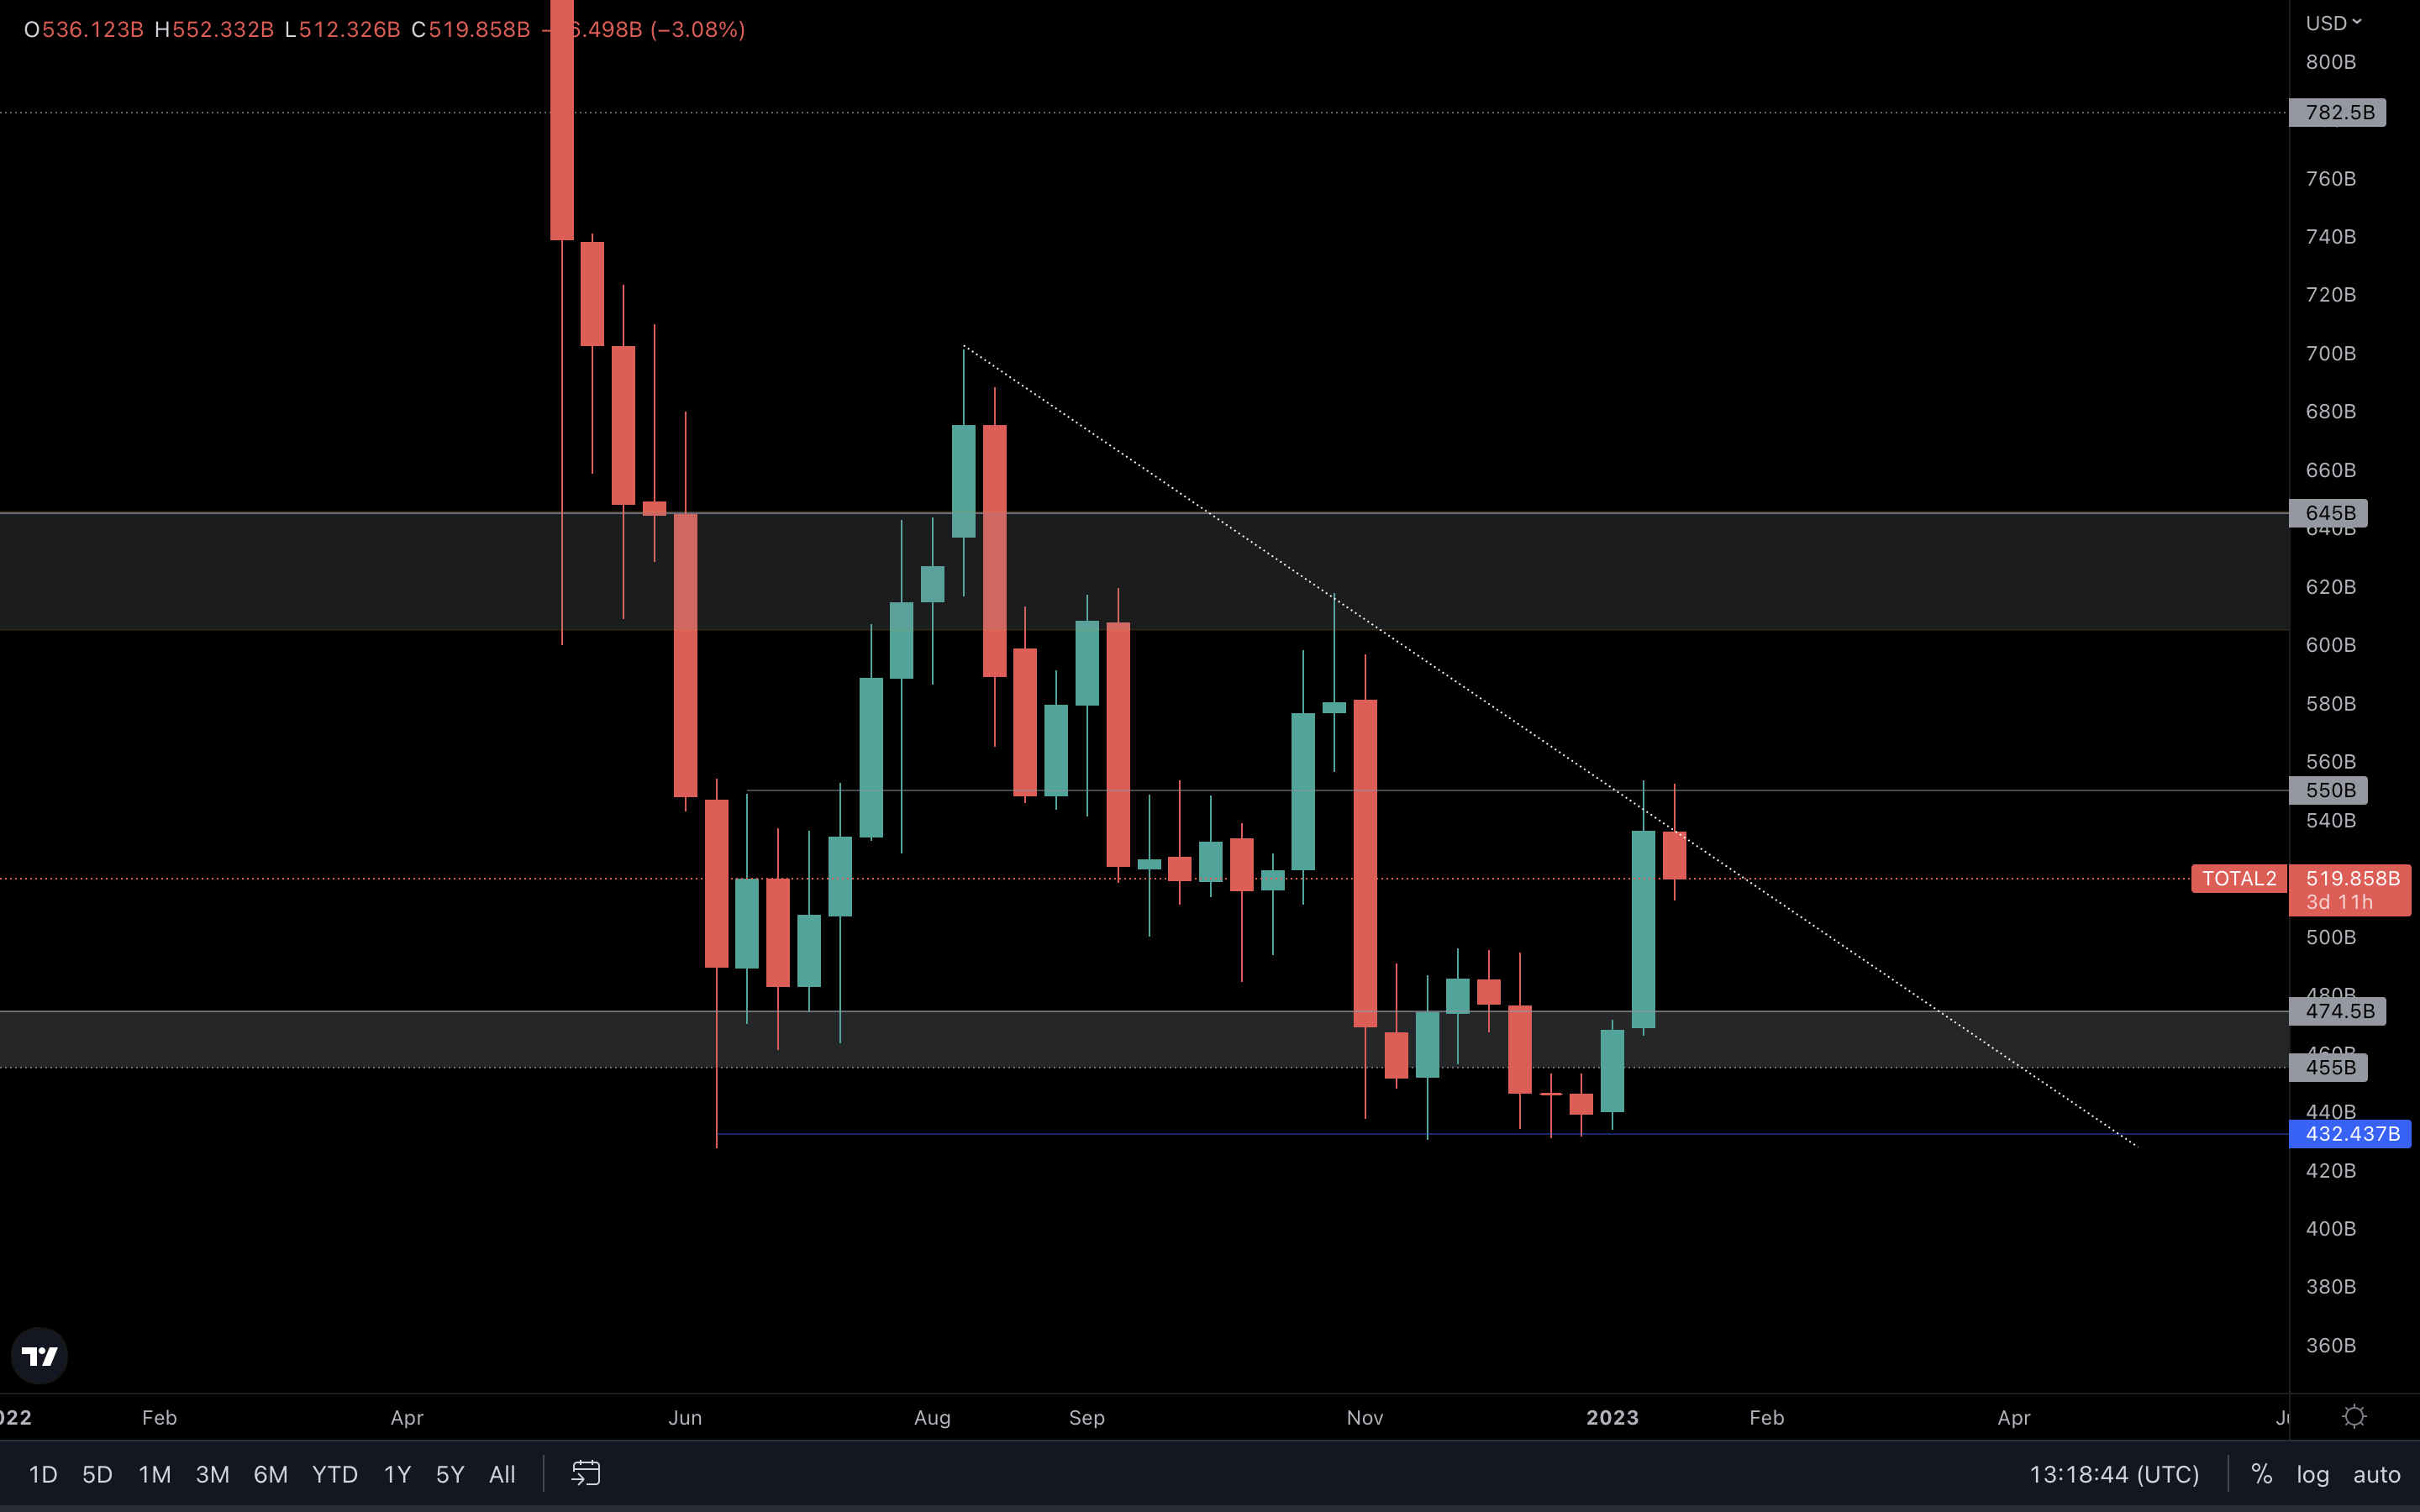 This index is currently trying to break a solid resistance on the weekly timeframe. Both the trend line and the $550B level act as resistance This might make it difficult for the Altcoins Market Cap to break above it and head to $645B.
However, the Total Market Cap index is the one that truly matters, as it forms the entire valuation of the market. If the Total Market Cap index rises to $1.03T, we can expect the Altcoins Market Cap index to break resistance and test $645B in the coming weeks.
This move will bring great opportunities to the altcoins market, so pay attention to those once a breakout occurs on this chart.
BTC | Bitcoin
 The 2017 all-time high (~$19,666) was reclaimed on the weekly timeframe last week, which means it was flipped into support. As long as Bitcoin holds that level, we will slowly grind toward the $25k - $26k area, the final target for the falling wedge.
For now, Bitcoin is testing resistance at its first target from the wedge. A reclaim of ~$21,450 is necessary for further upside. In the meantime, a retest of the 2017 all-time high is on the cards, especially after last week’s price action.
ETH | Ethereum
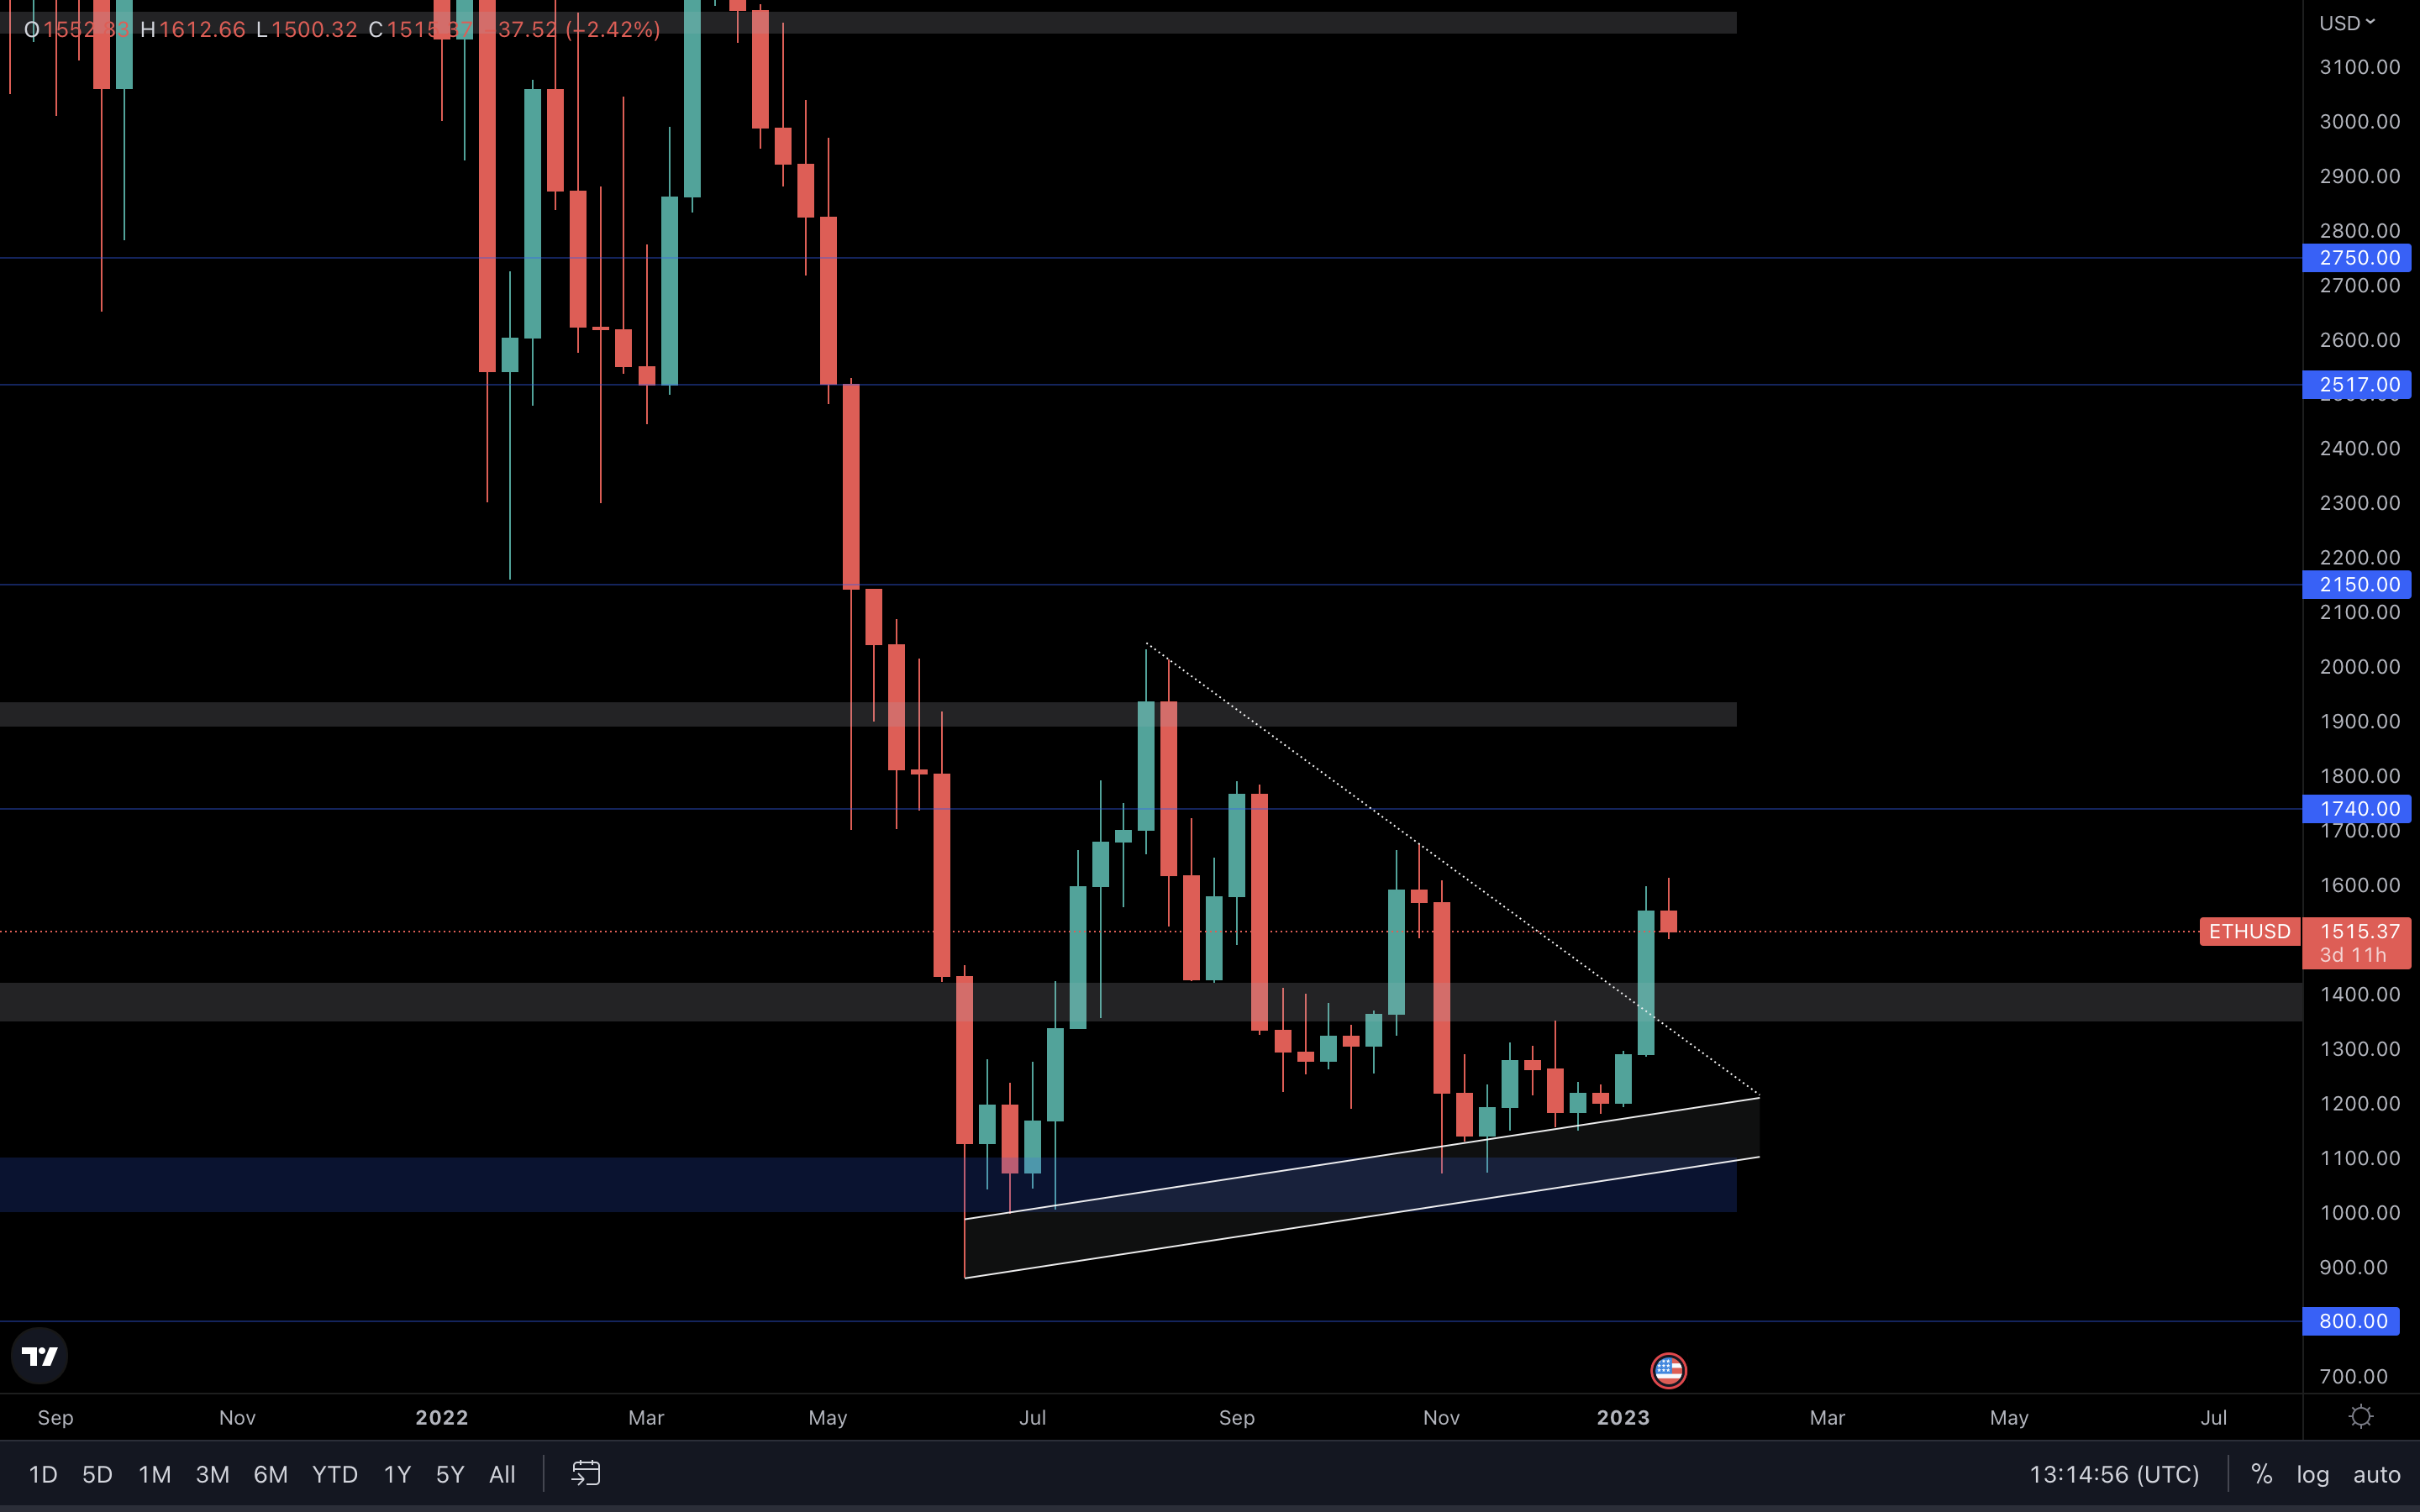
Very similar scenario to that of Bitcoin - Ether has broken above its 2017 all-time high of $1420 and flipped it into support. Now, holding this level is absolutely necessary for further upside. Otherwise, a move to $1740 and $1900 respectively, will be invalidated, as will the symmetrical triangle you see on the chart.
If $1420 holds, Ether will test $1740 and $1900 in the following weeks, both of which are major weekly levels and have been accurate in the past.
SOL | Solana
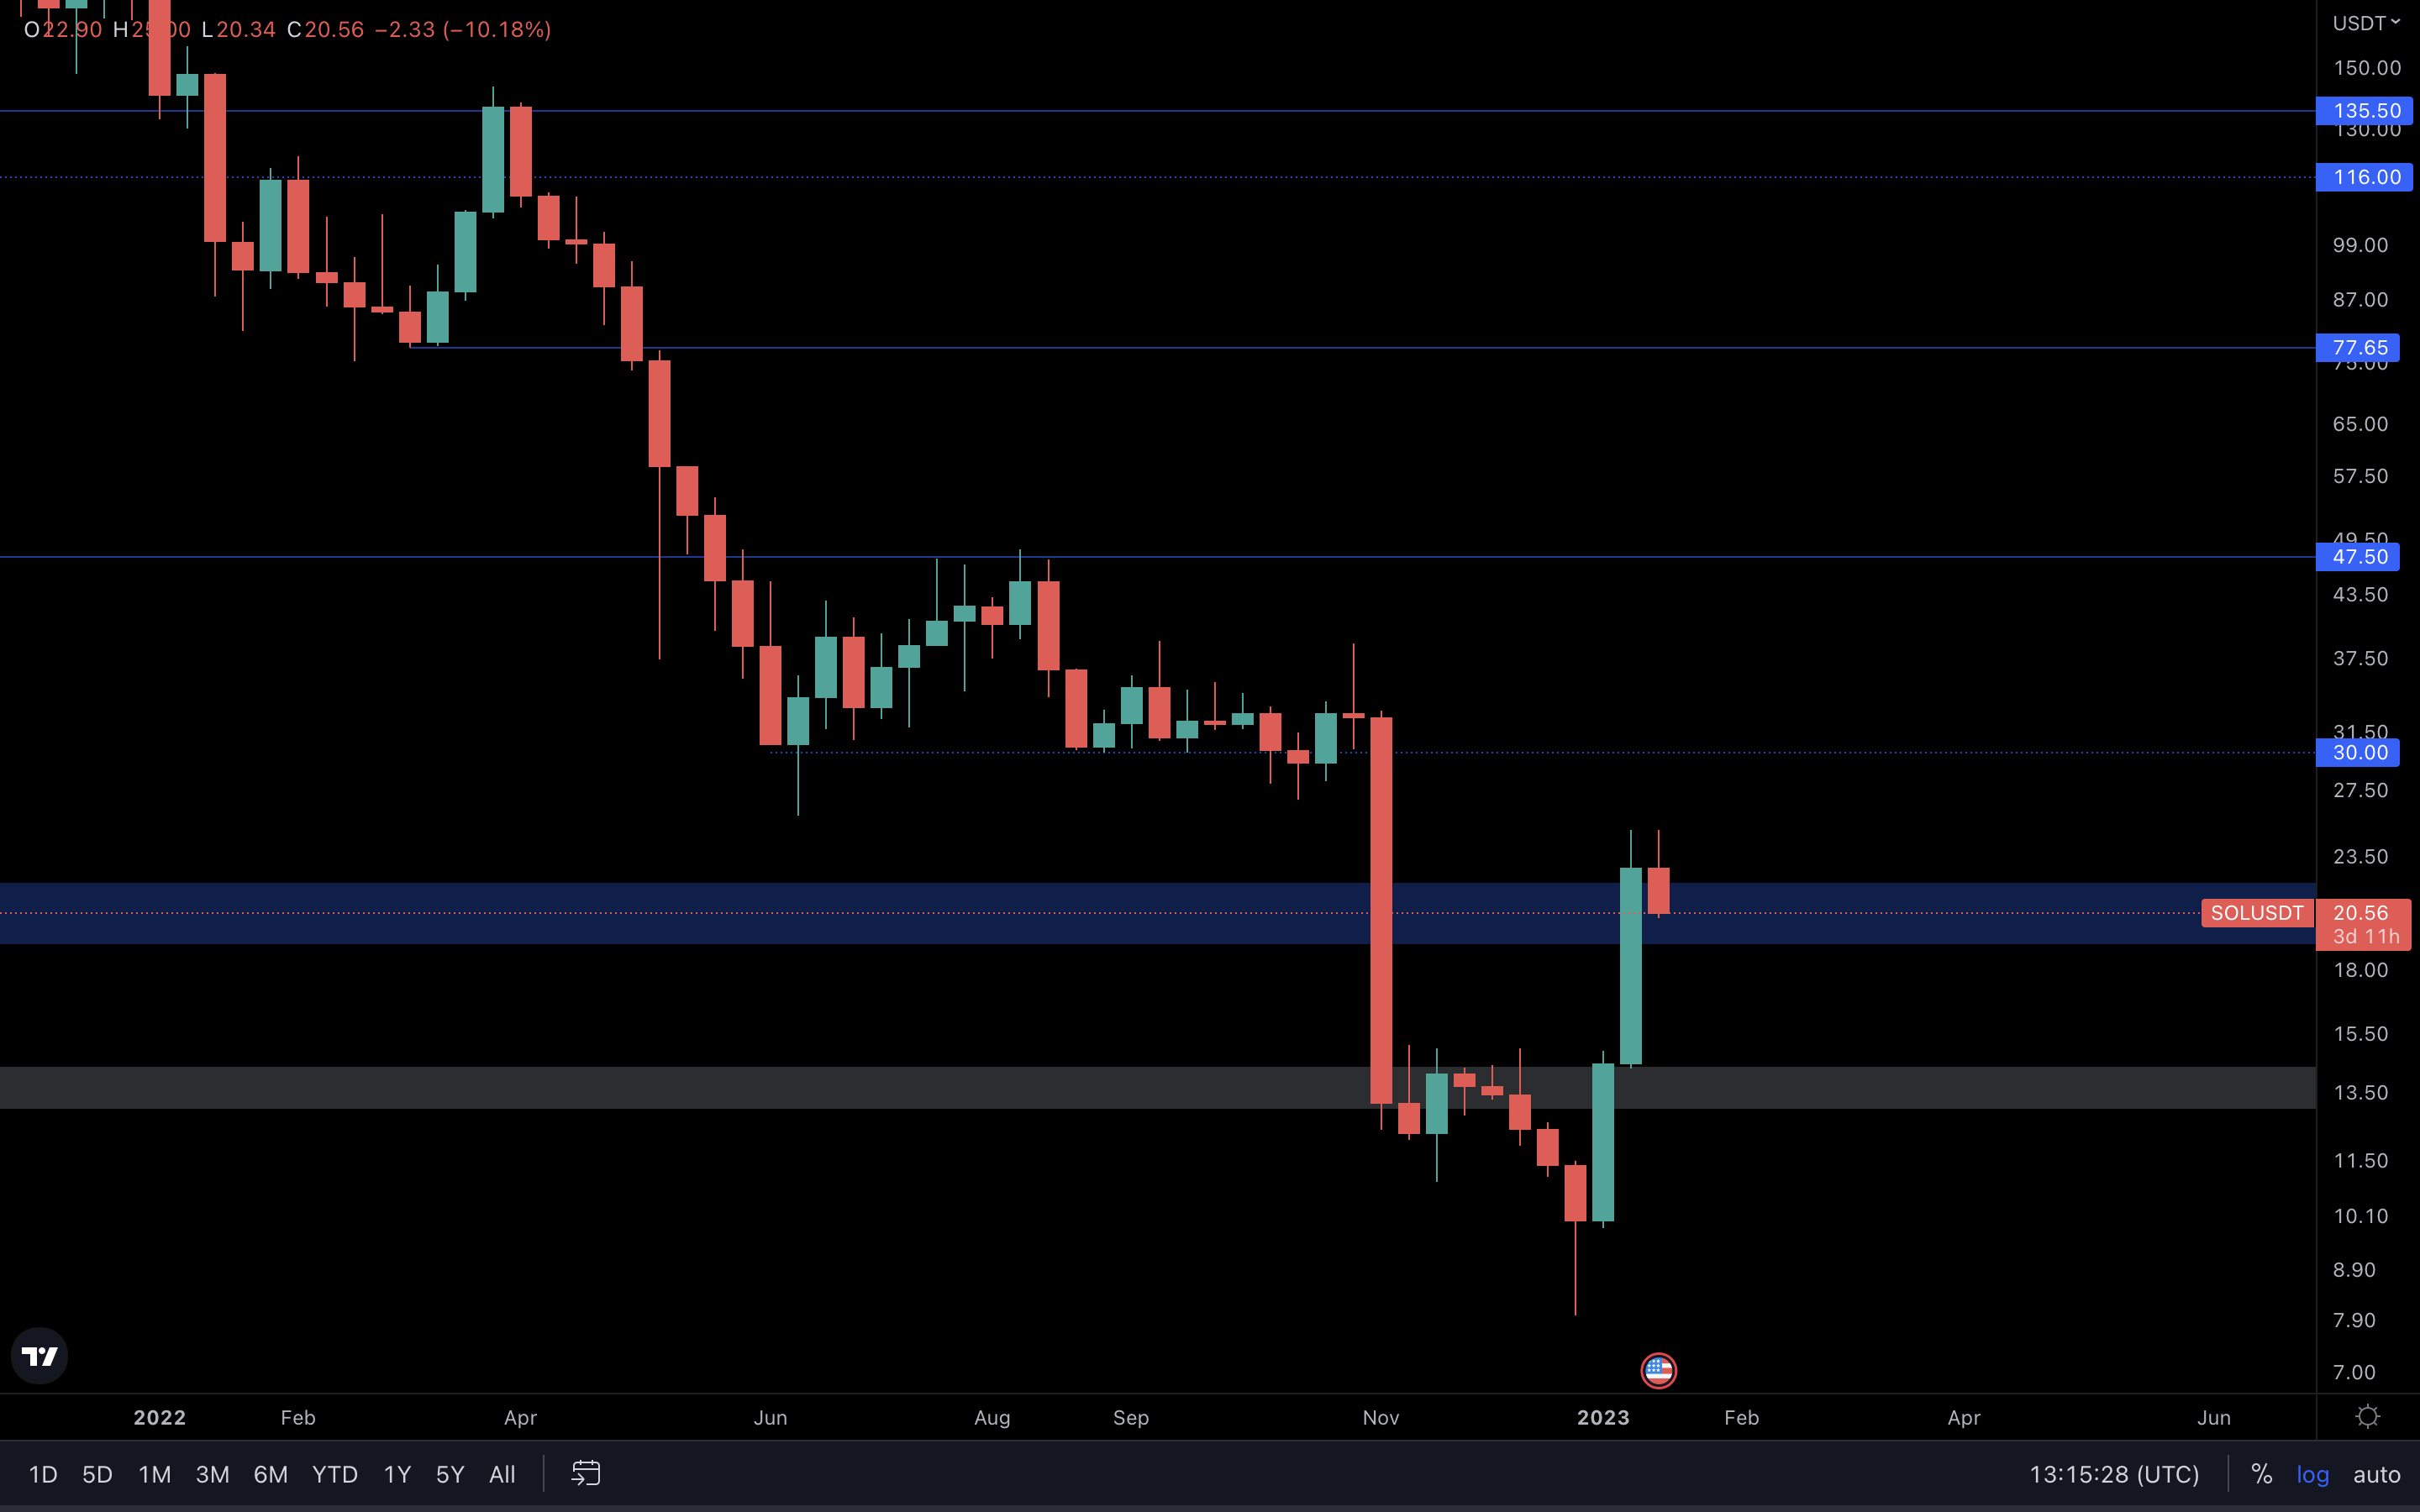
Last week, SOL reclaimed this resistance ($19 - $22) by closing a candle above $22. This area now acts as support, and only a loss of $19 will invalidate further upside. If $19 holds, we could be looking at a $30 SOL soon, which is in confluence with our view on the Total Market Cap analysed above.
BNB | Binance
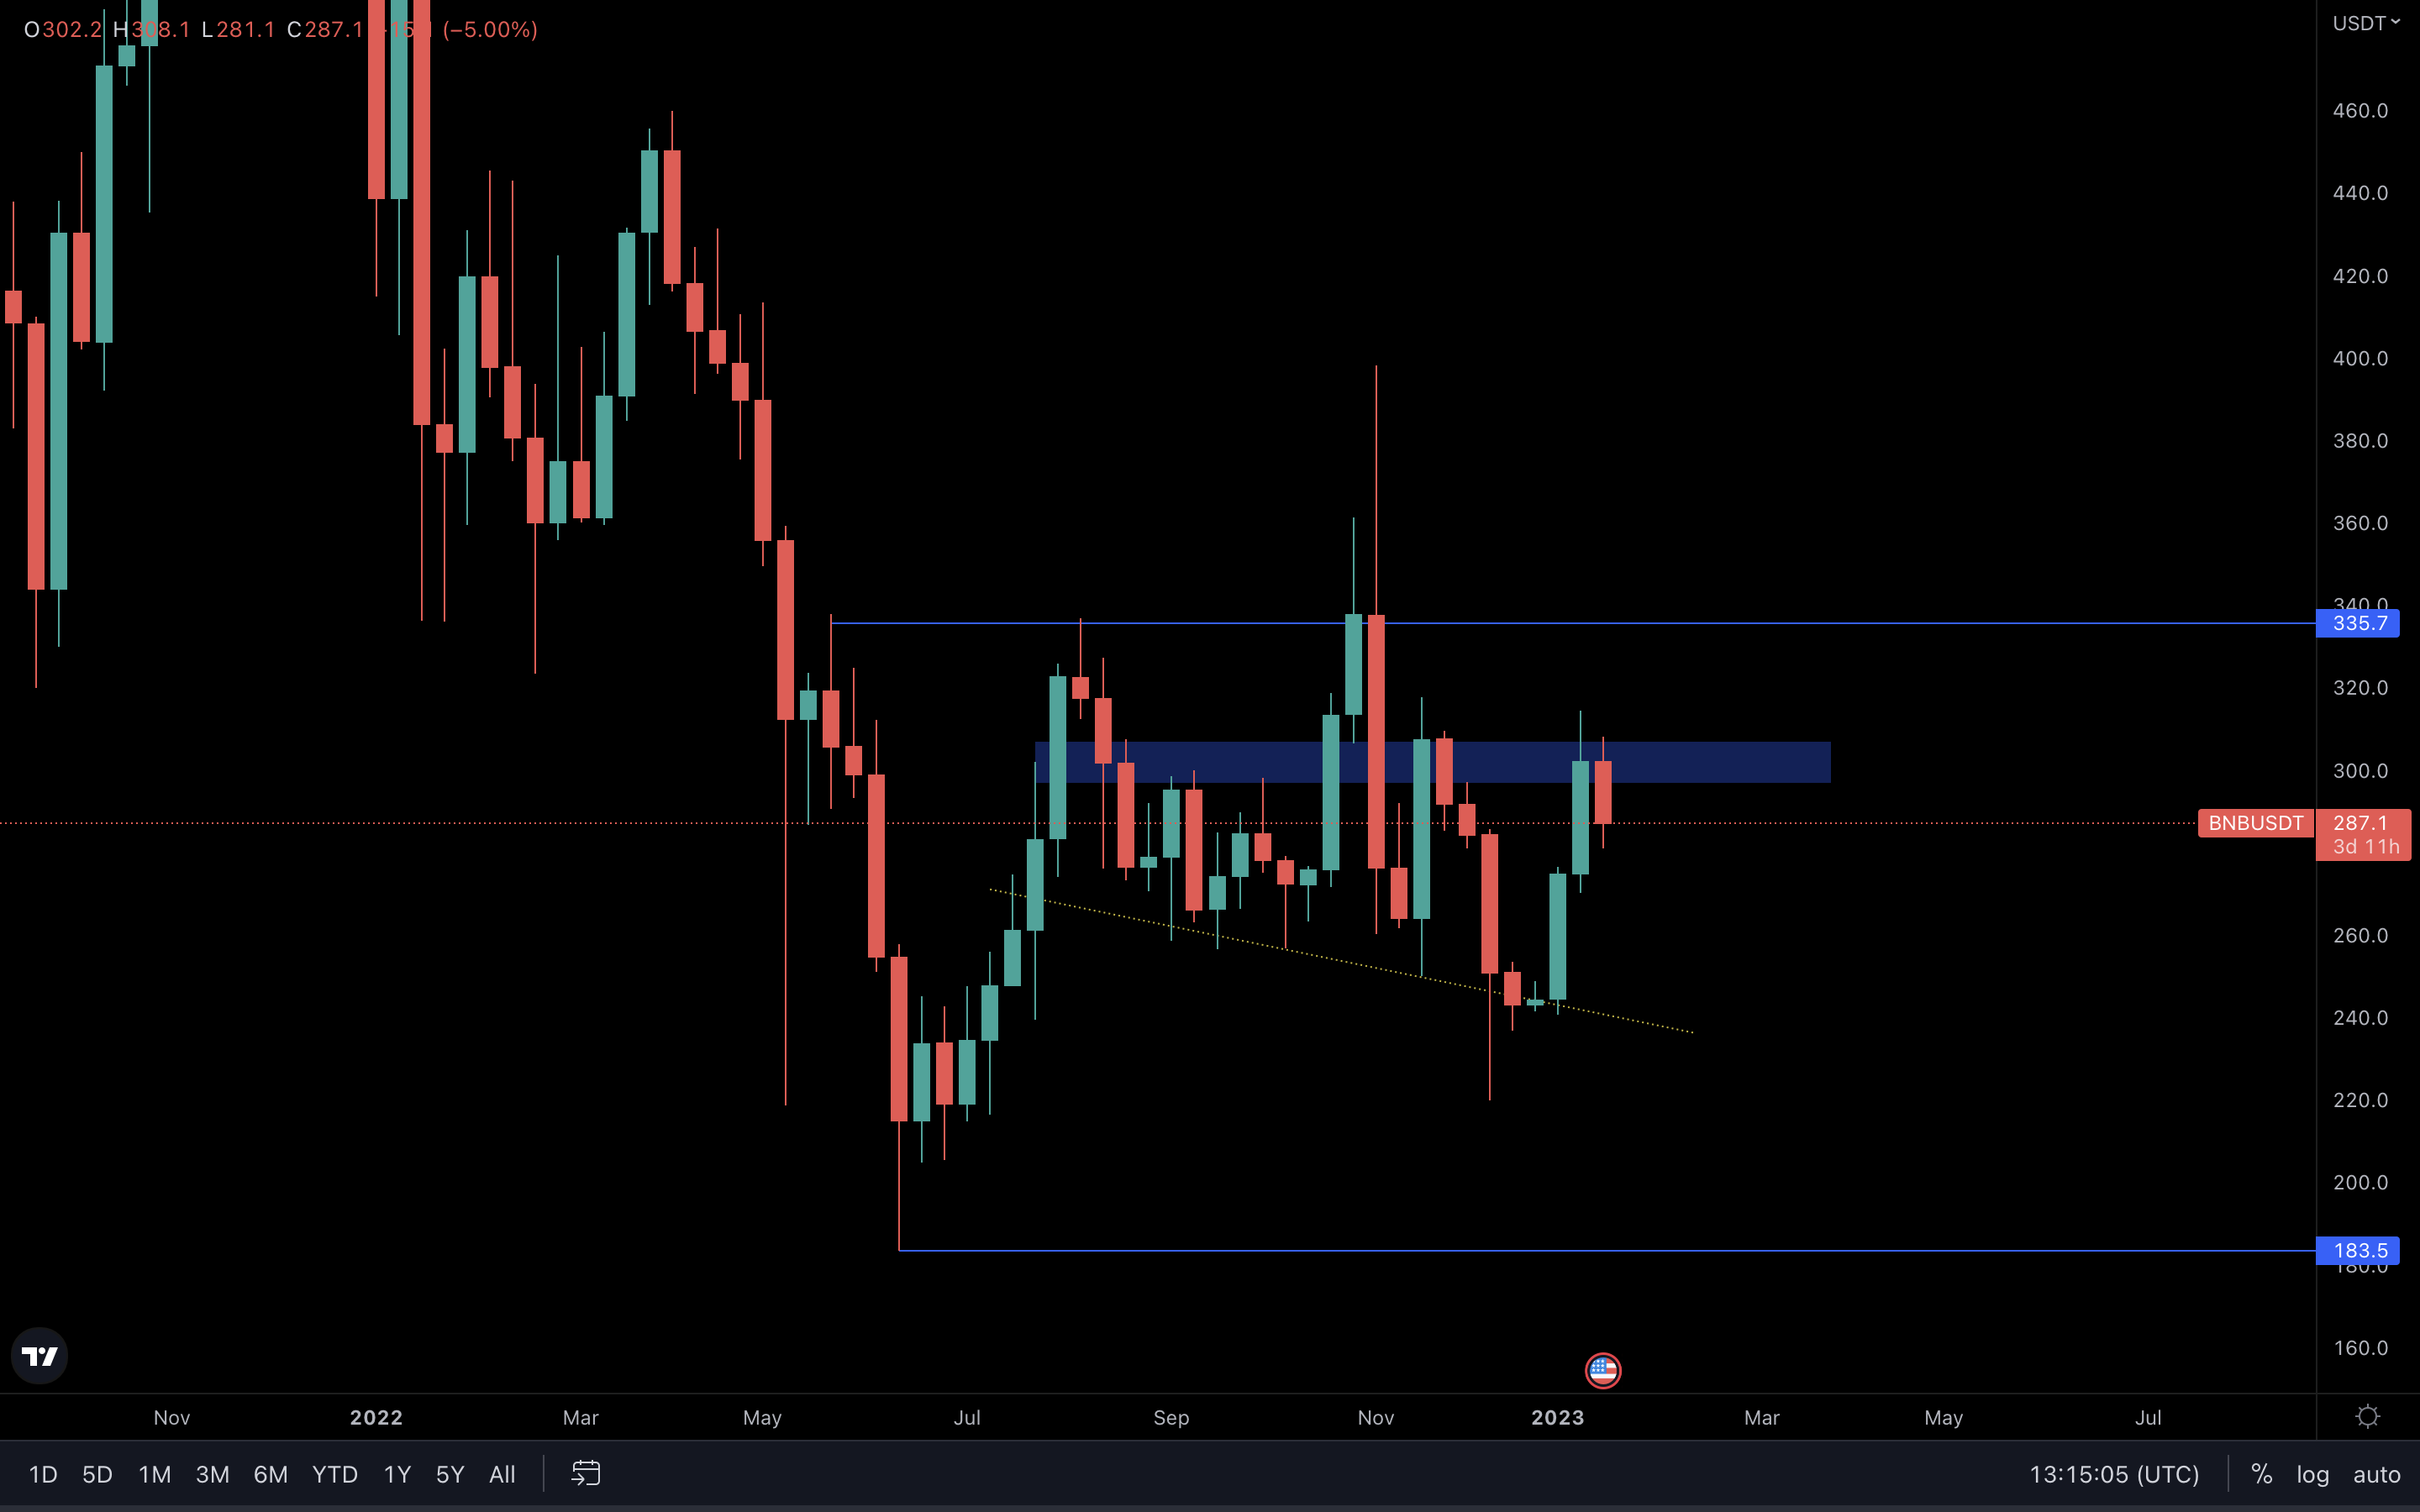
Reaching $300 was guaranteed - can’t go wrong with basic price action. However, because BNB hasn’t reclaimed the blue box on this chart yet, it is at risk of rejection. Once a reclaim of the blue box occurs, we could be looking at $335 and above. A rejection from the blue box will likely not lead to another retest of the yellow trend line below, purely because the rest of the market is looking ready for more upside. Instead, if a rejection occurs, BNB will find support somewhere between the yellow trend line and the blue box, depending on how low the rest of the market goes (if it does).
UNI | Uniswap
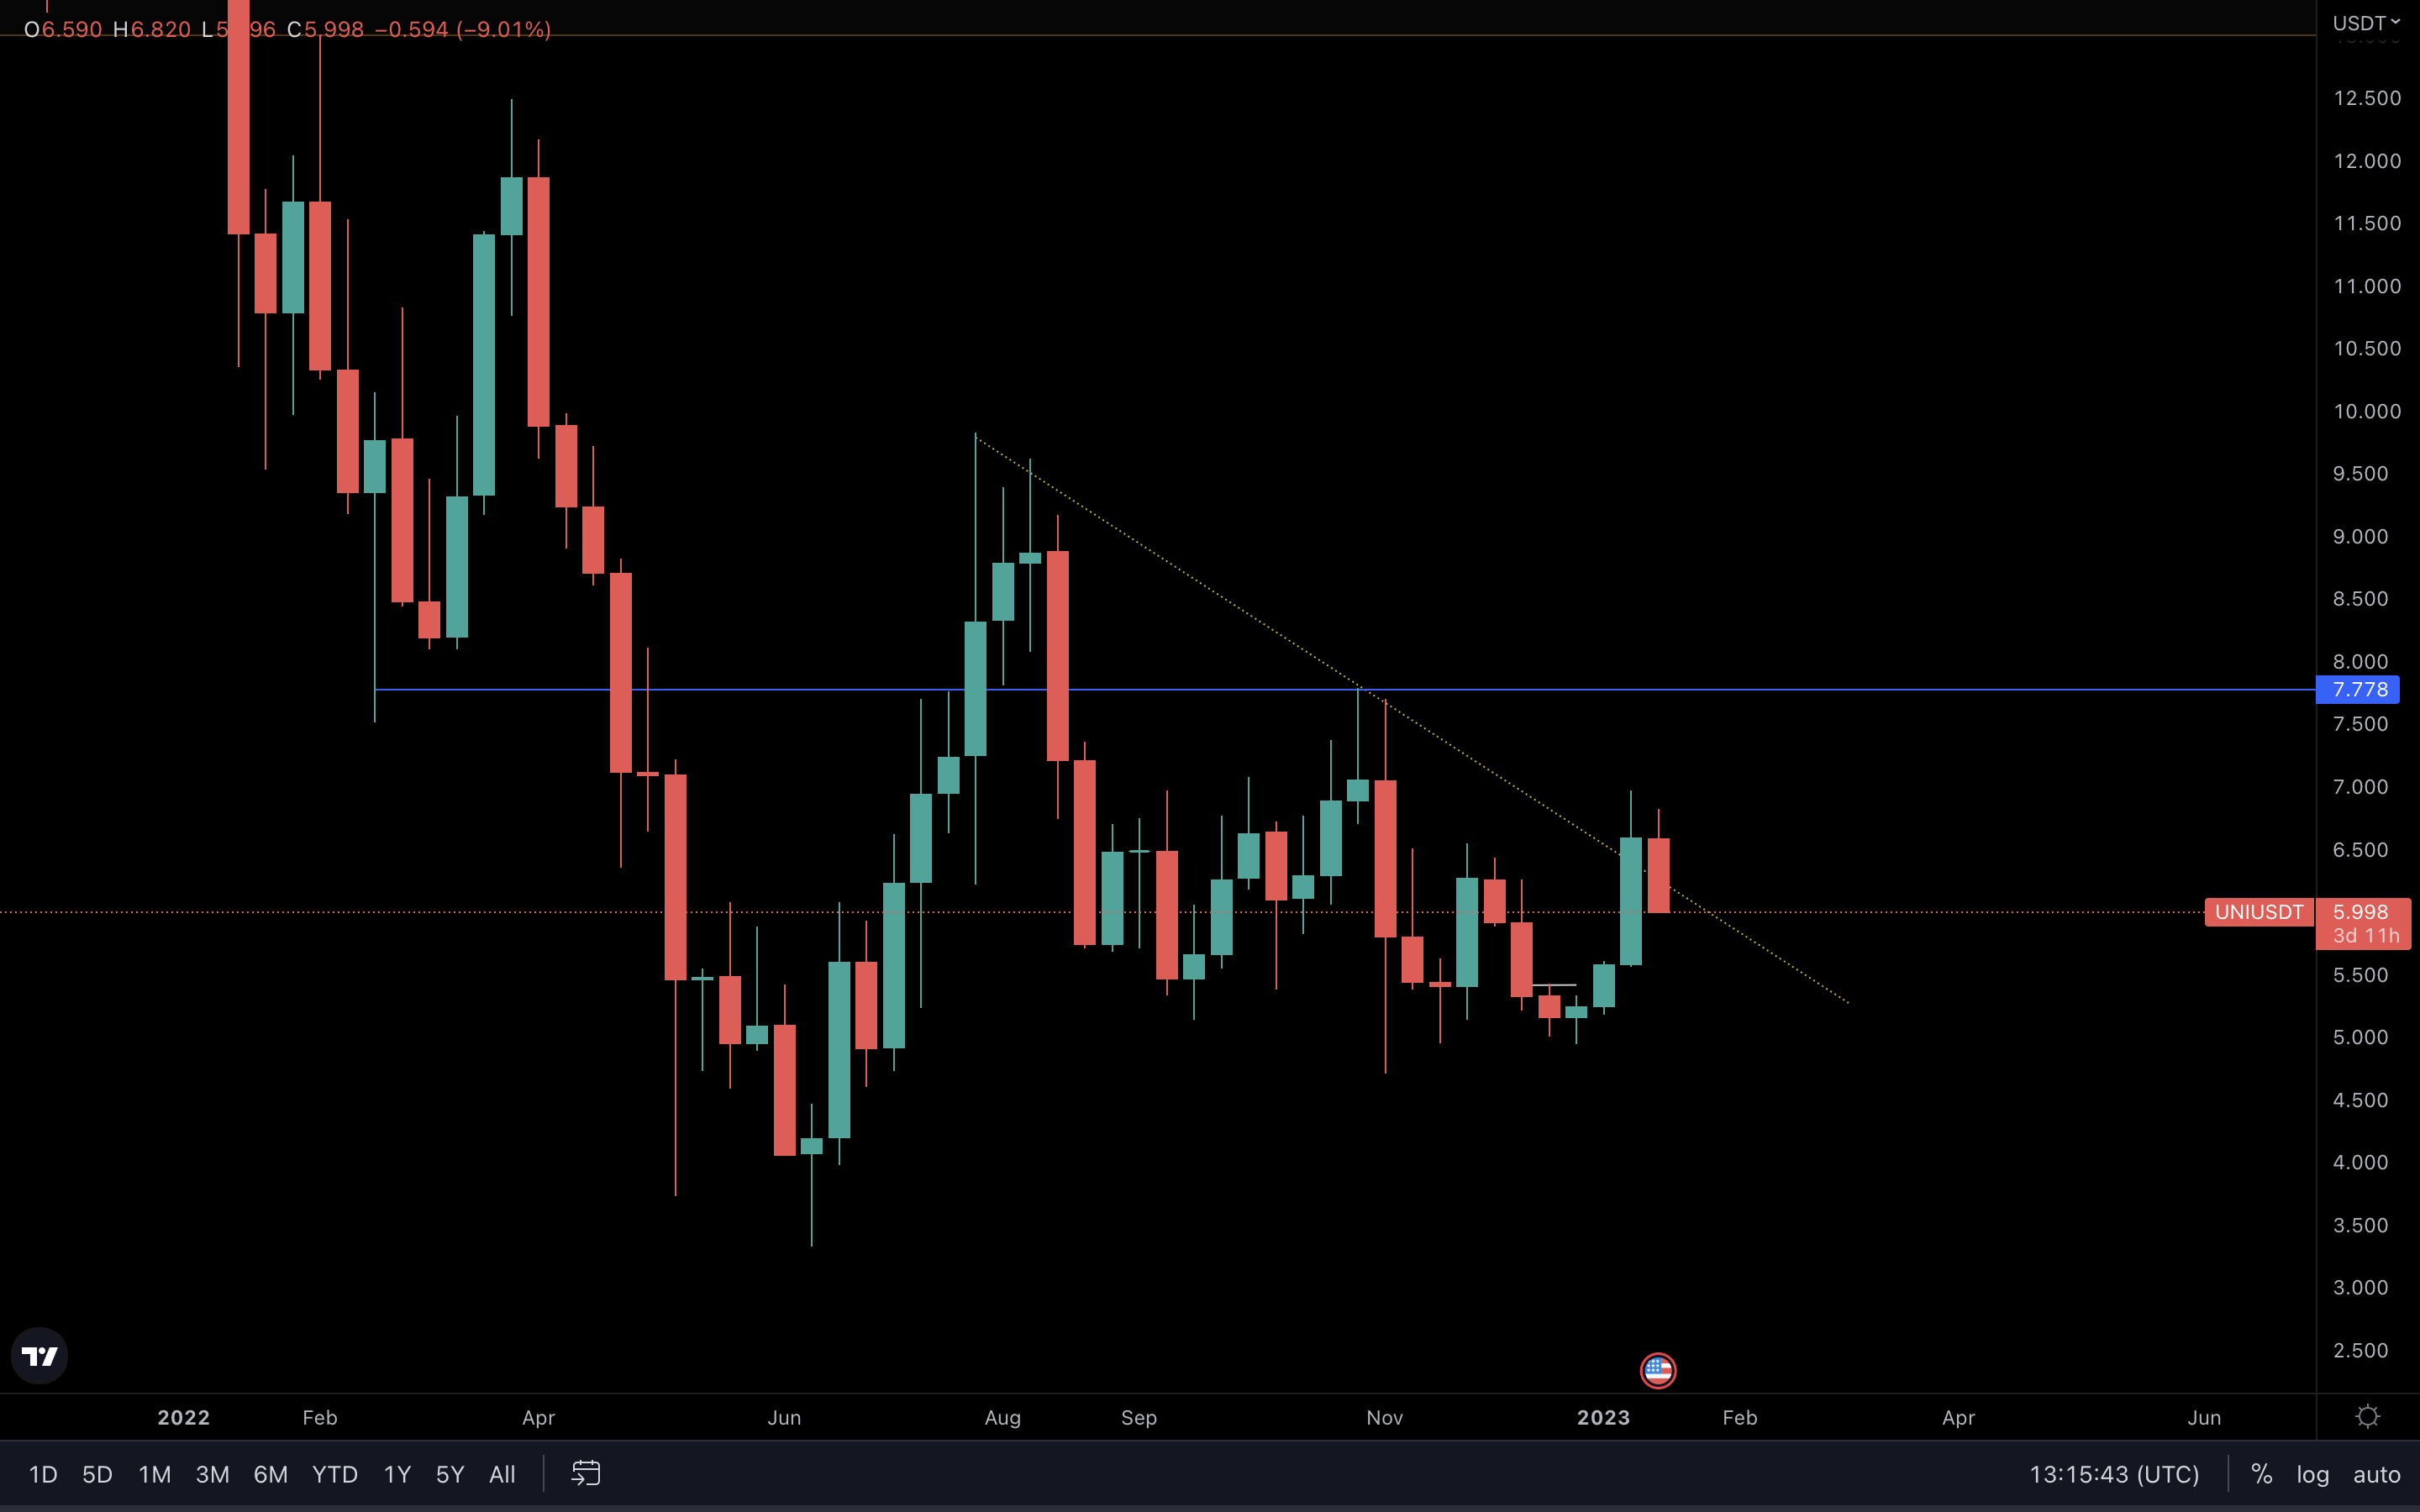
UNI broke above the resistance trend line, and from a technical standpoint, it was heading toward $7.77. However, we can see that it is now coming back down due to the market slowing down in the last few days. This could lead to an invalidation of the breakout. UNI needs to close this week above the resistance trend line. Otherwise, a move to $7.77 will be invalidated for now. This is definitely something worth tracking in the next few days.
Cryptonary's take
So, is there more to come? Will this rally continue? In our opinion, YES. The market will likely see the rally continue to prices much higher than these.
However, this doesn’t change the fact that we are still in a bear market. At some point, the market will come back down even after we test levels we haven’t seen in months.
Recommended from Cryptonary


