Save 23% ($351) & Get a Free 1-1 Call with our Team ⏰ : 0d 2h 59m 43s
Here's why Bitcoin is going to $XX,XXX... | February 20th
Your hand might be itching on the “Buy” button at this very moment, but you should step away for a second and ask yourself - is this the right thing to do right now? In crypto, you’ve either mastered patience, or you haven't at all. Once you understand how you function on an emotional and mental level, you understand how you should act in the market. Some self-reflection on this topic will give you the answer to our question above. Think about it for some time. You’ll thank us later. In the meantime, let’s see how the market’s looking and what we should expect next!
Disclaimer: Not financial or investment advice. You are responsible for any capital-related decisions you make, and only you are accountable for the results.
TLDR
- Bullish engulfing candles have formed on multiple assets and indexes. This signals potential upside in the coming weeks.
- The Total Market Cap closed a weekly candle above $1.03T. From a technical standpoint, the market should be heading to $1.35T.
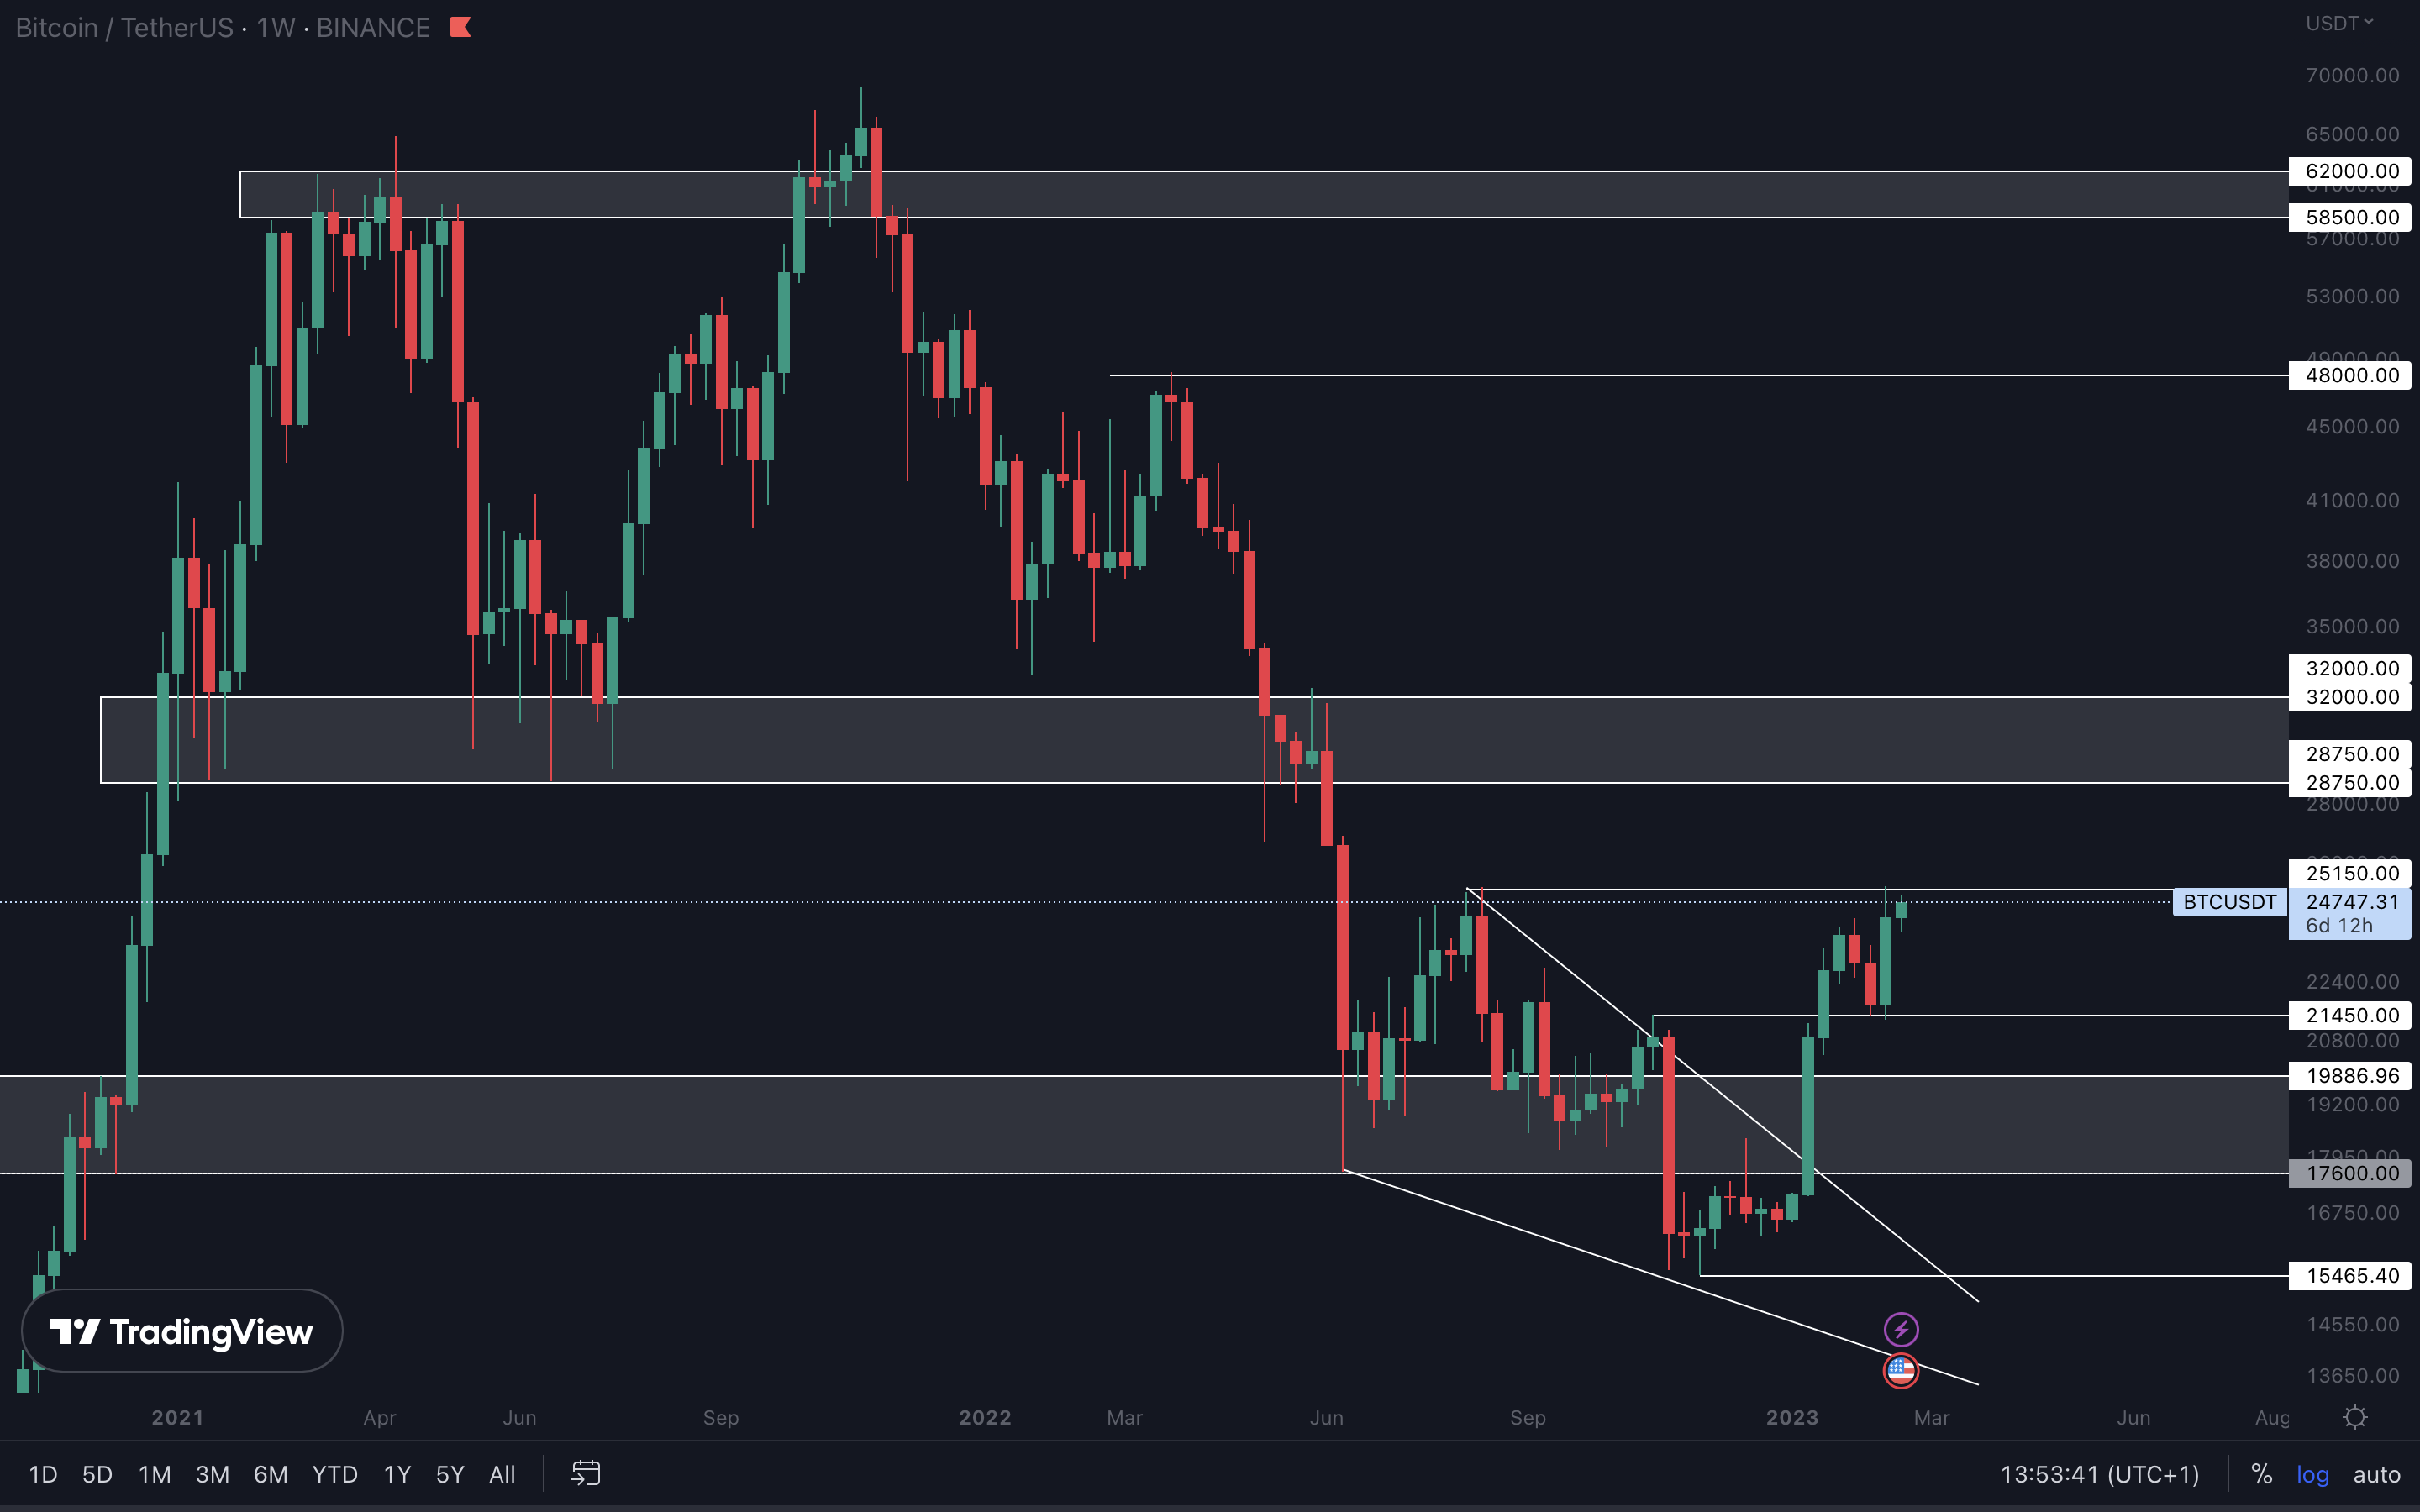
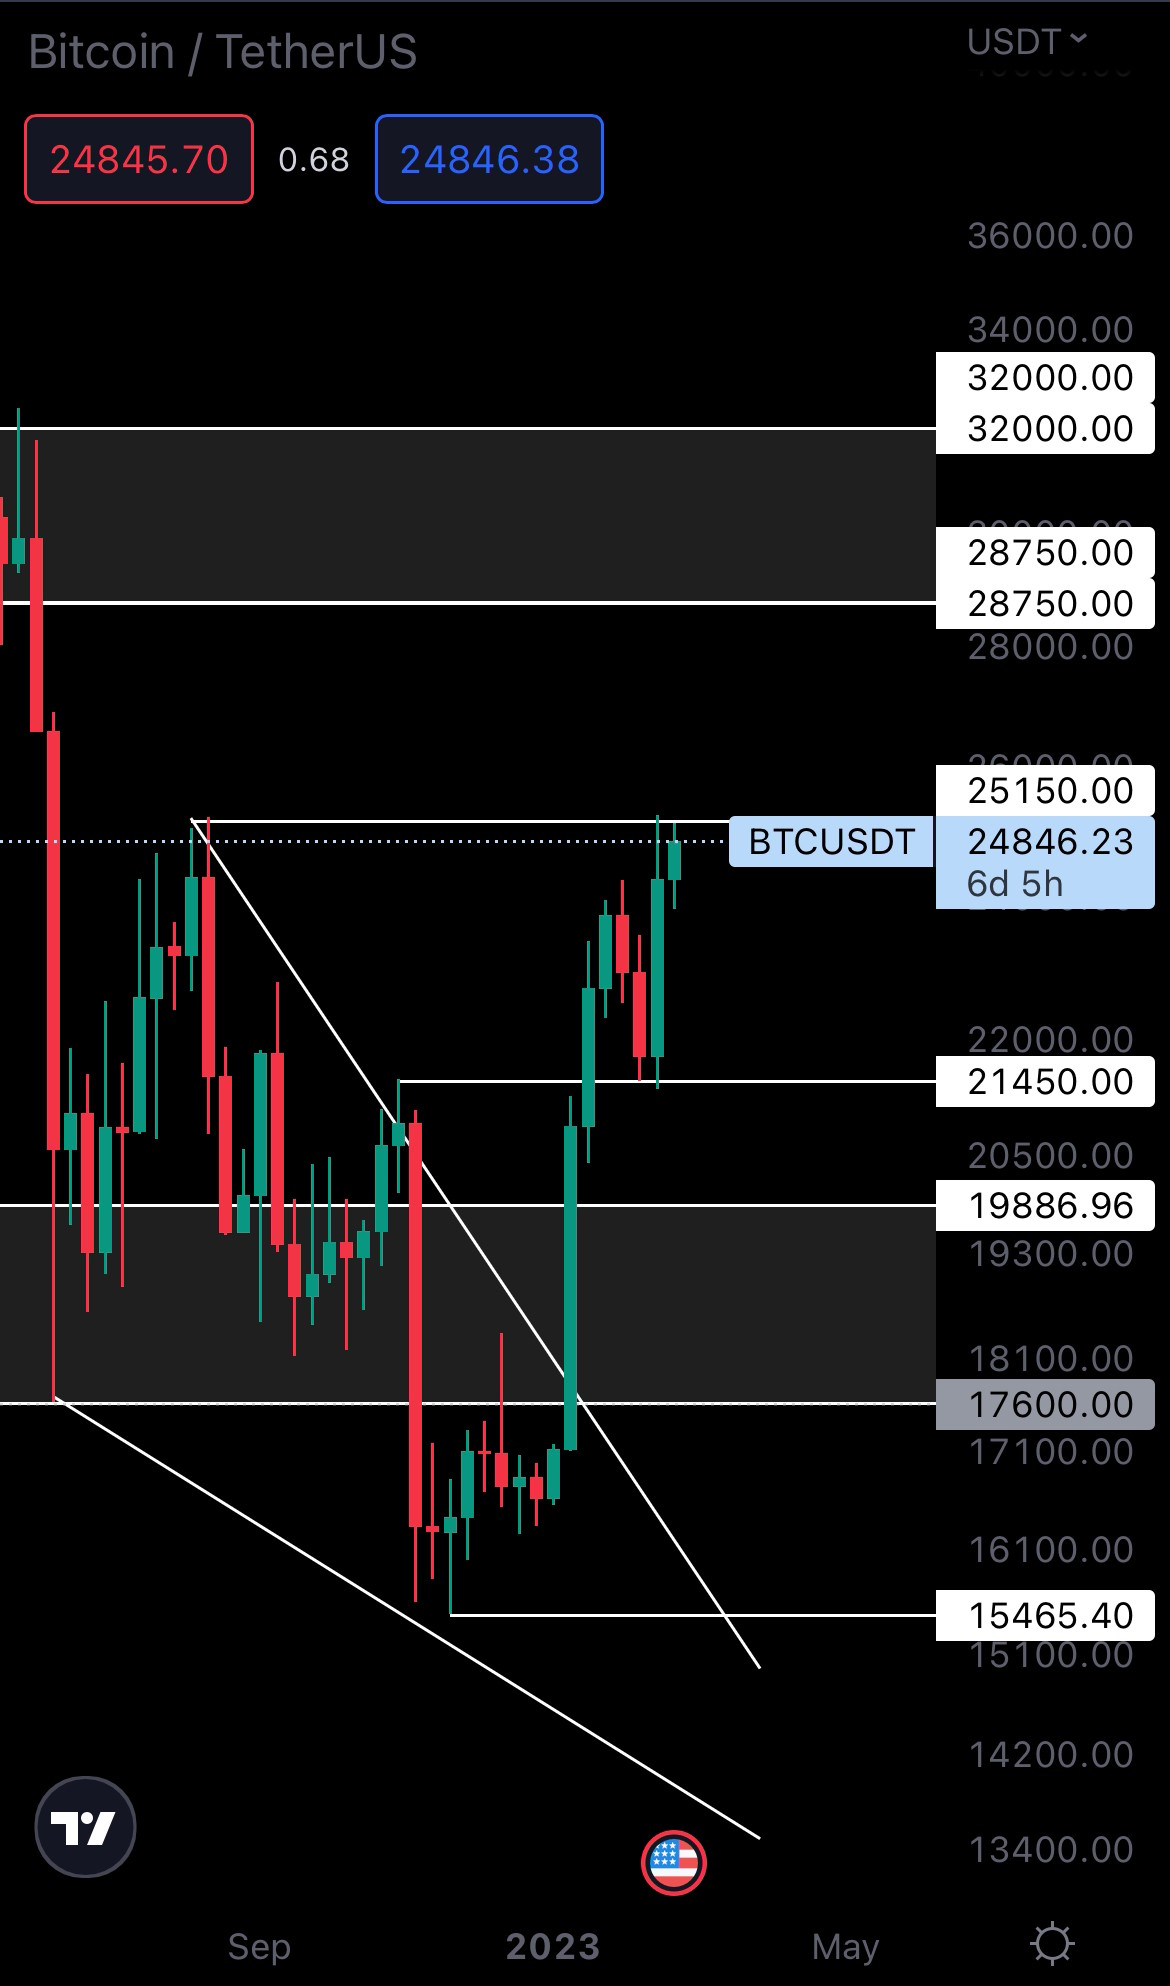
- Bitcoin is at resistance ($25,150). A weekly closure above this level is necessary Bitcoin to reach $30,000.
- If the market rallies, moving your attention to altcoins would be wise.
- SNX reclaimed a major level ($2.50). Upside toward $3.50 and $4.45 can follow.
- If DYDX holds $2.50 as support, upside toward $4 - $4.40 can follow in the coming weeks.
- DOT, SYN, LDO, MINA and STG are at resistance. For upside to continue, these assets must break above their respective resistance levels.
Total Market Cap
The Total Market Cap index represents the entire cryptocurrency market valuation. We track this index to understand where the market is now and to predict where it will likely go next.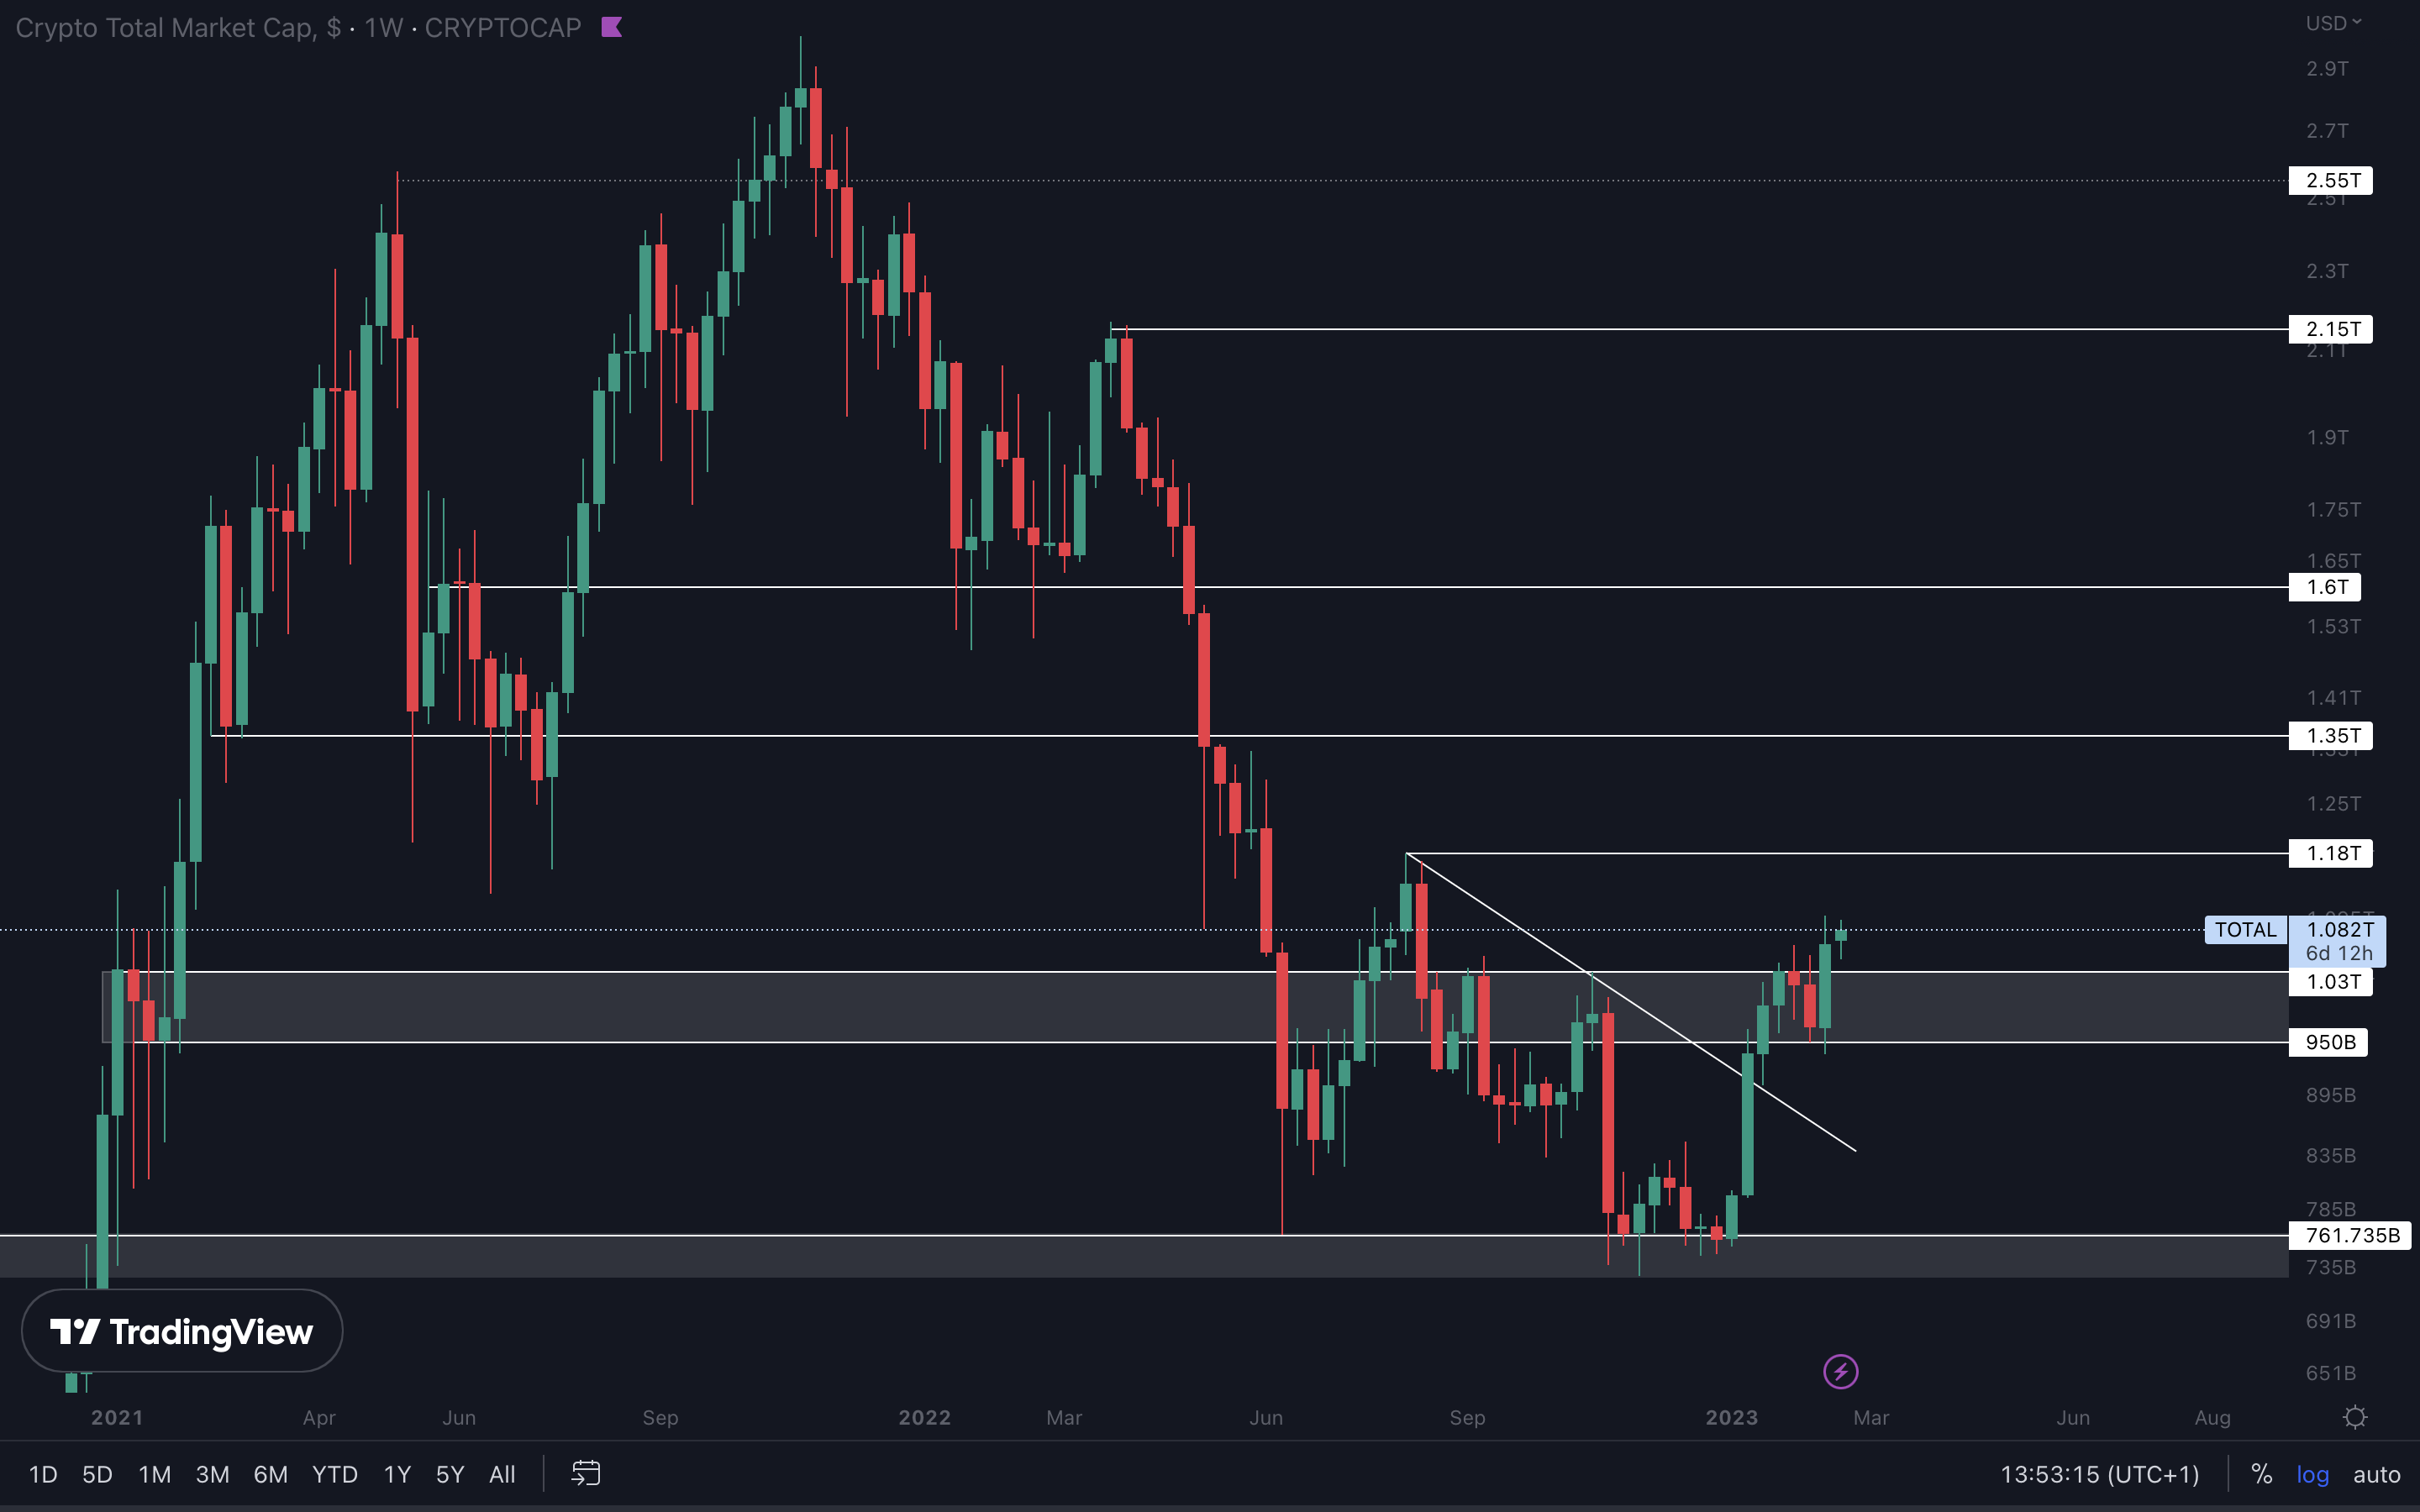
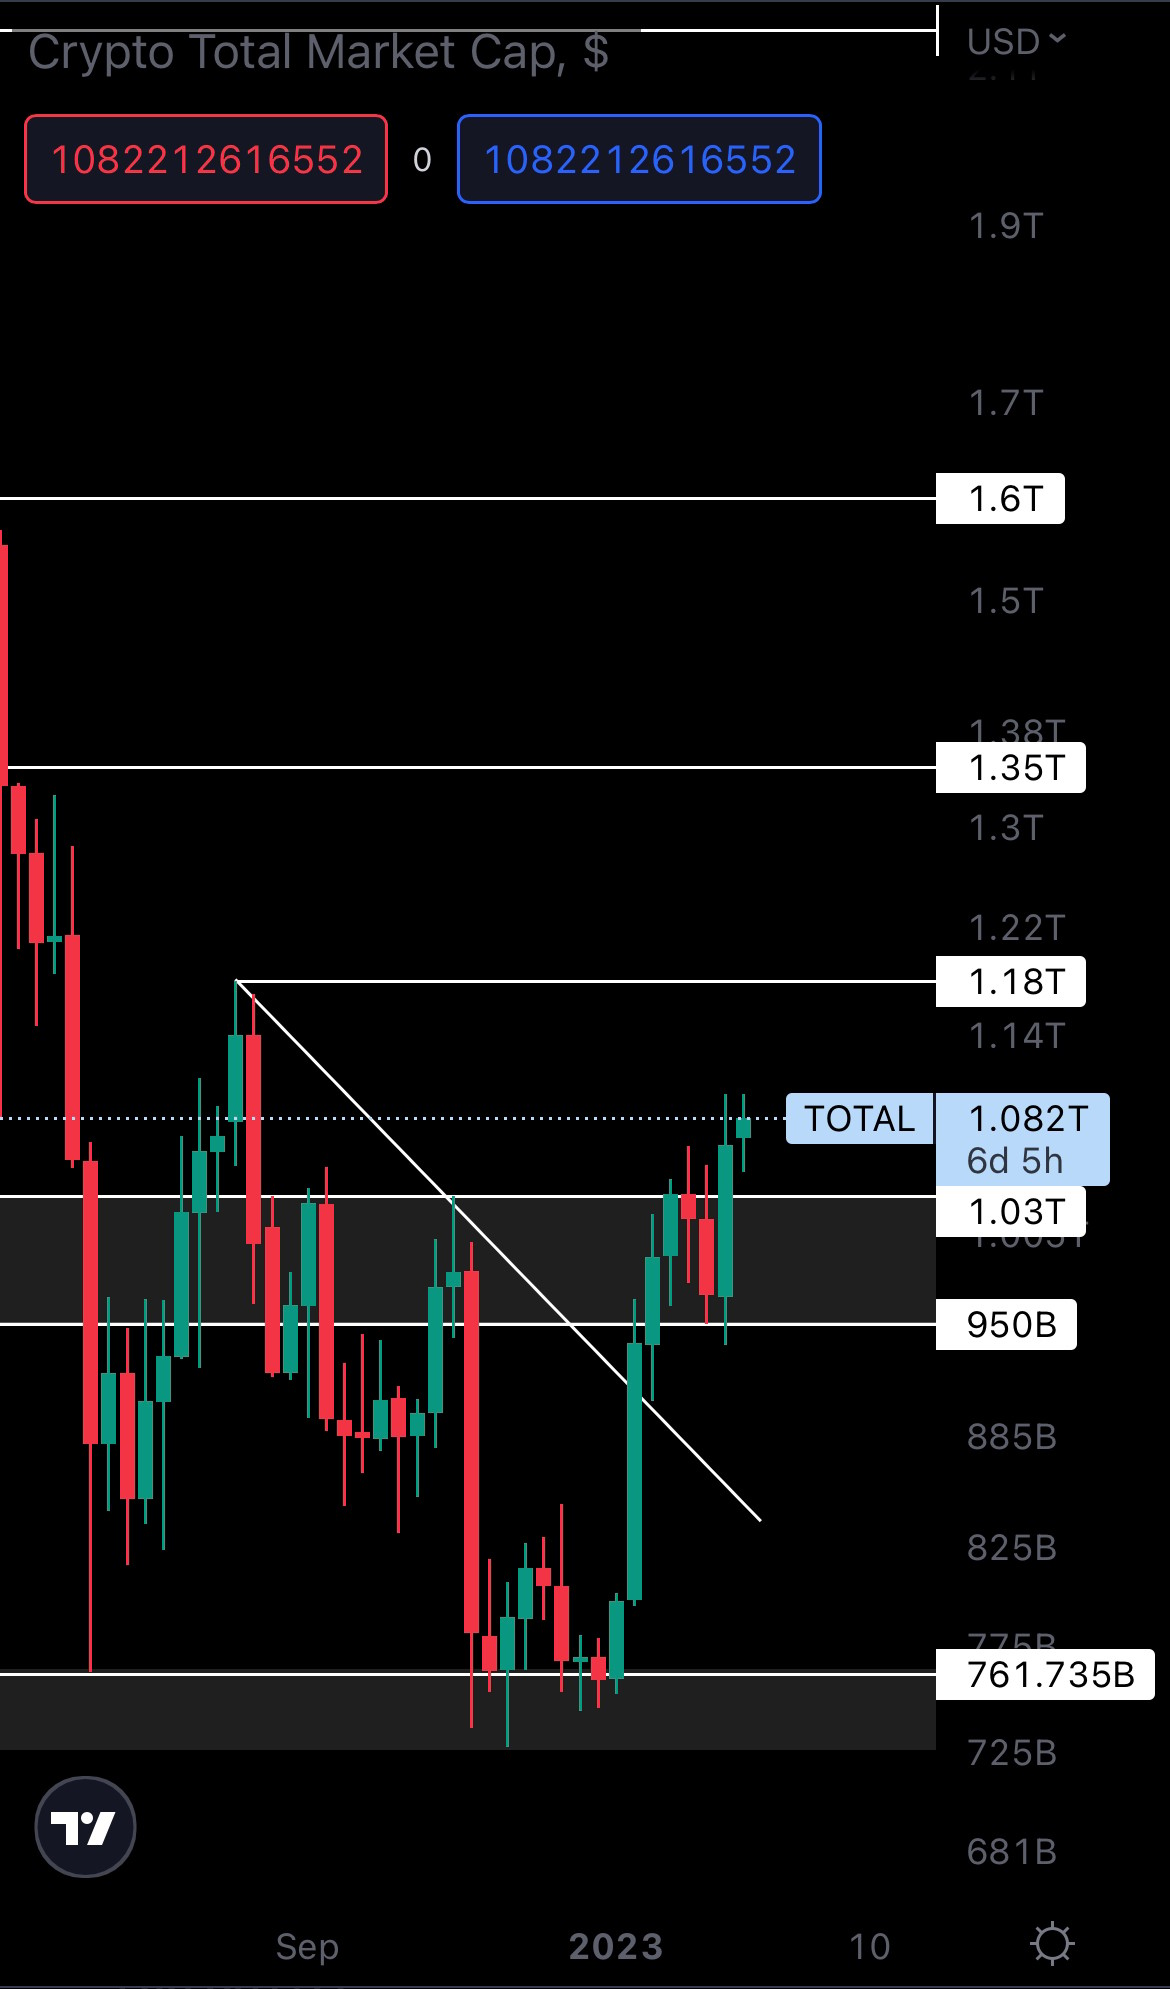
Last week, the Total Market Cap closed a bullish engulfing candle above its $1.03T resistance level. From a technical standpoint, this opens up the road for $1.35T. However, we might encounter resistance at $1.18T since this is a previous high and the final breakout target (diagonal trend line). Another thing to point out is that the weekly market structure has changed. The index marked a weekly higher low after holding $950B as support and a higher high last week after breaking above the previous high. This is yet another signal that upside may follow from here.
Altcoins Market Cap
The Altcoins Market Cap index represents the entire evaluation of the altcoins market (all coins other than BTC).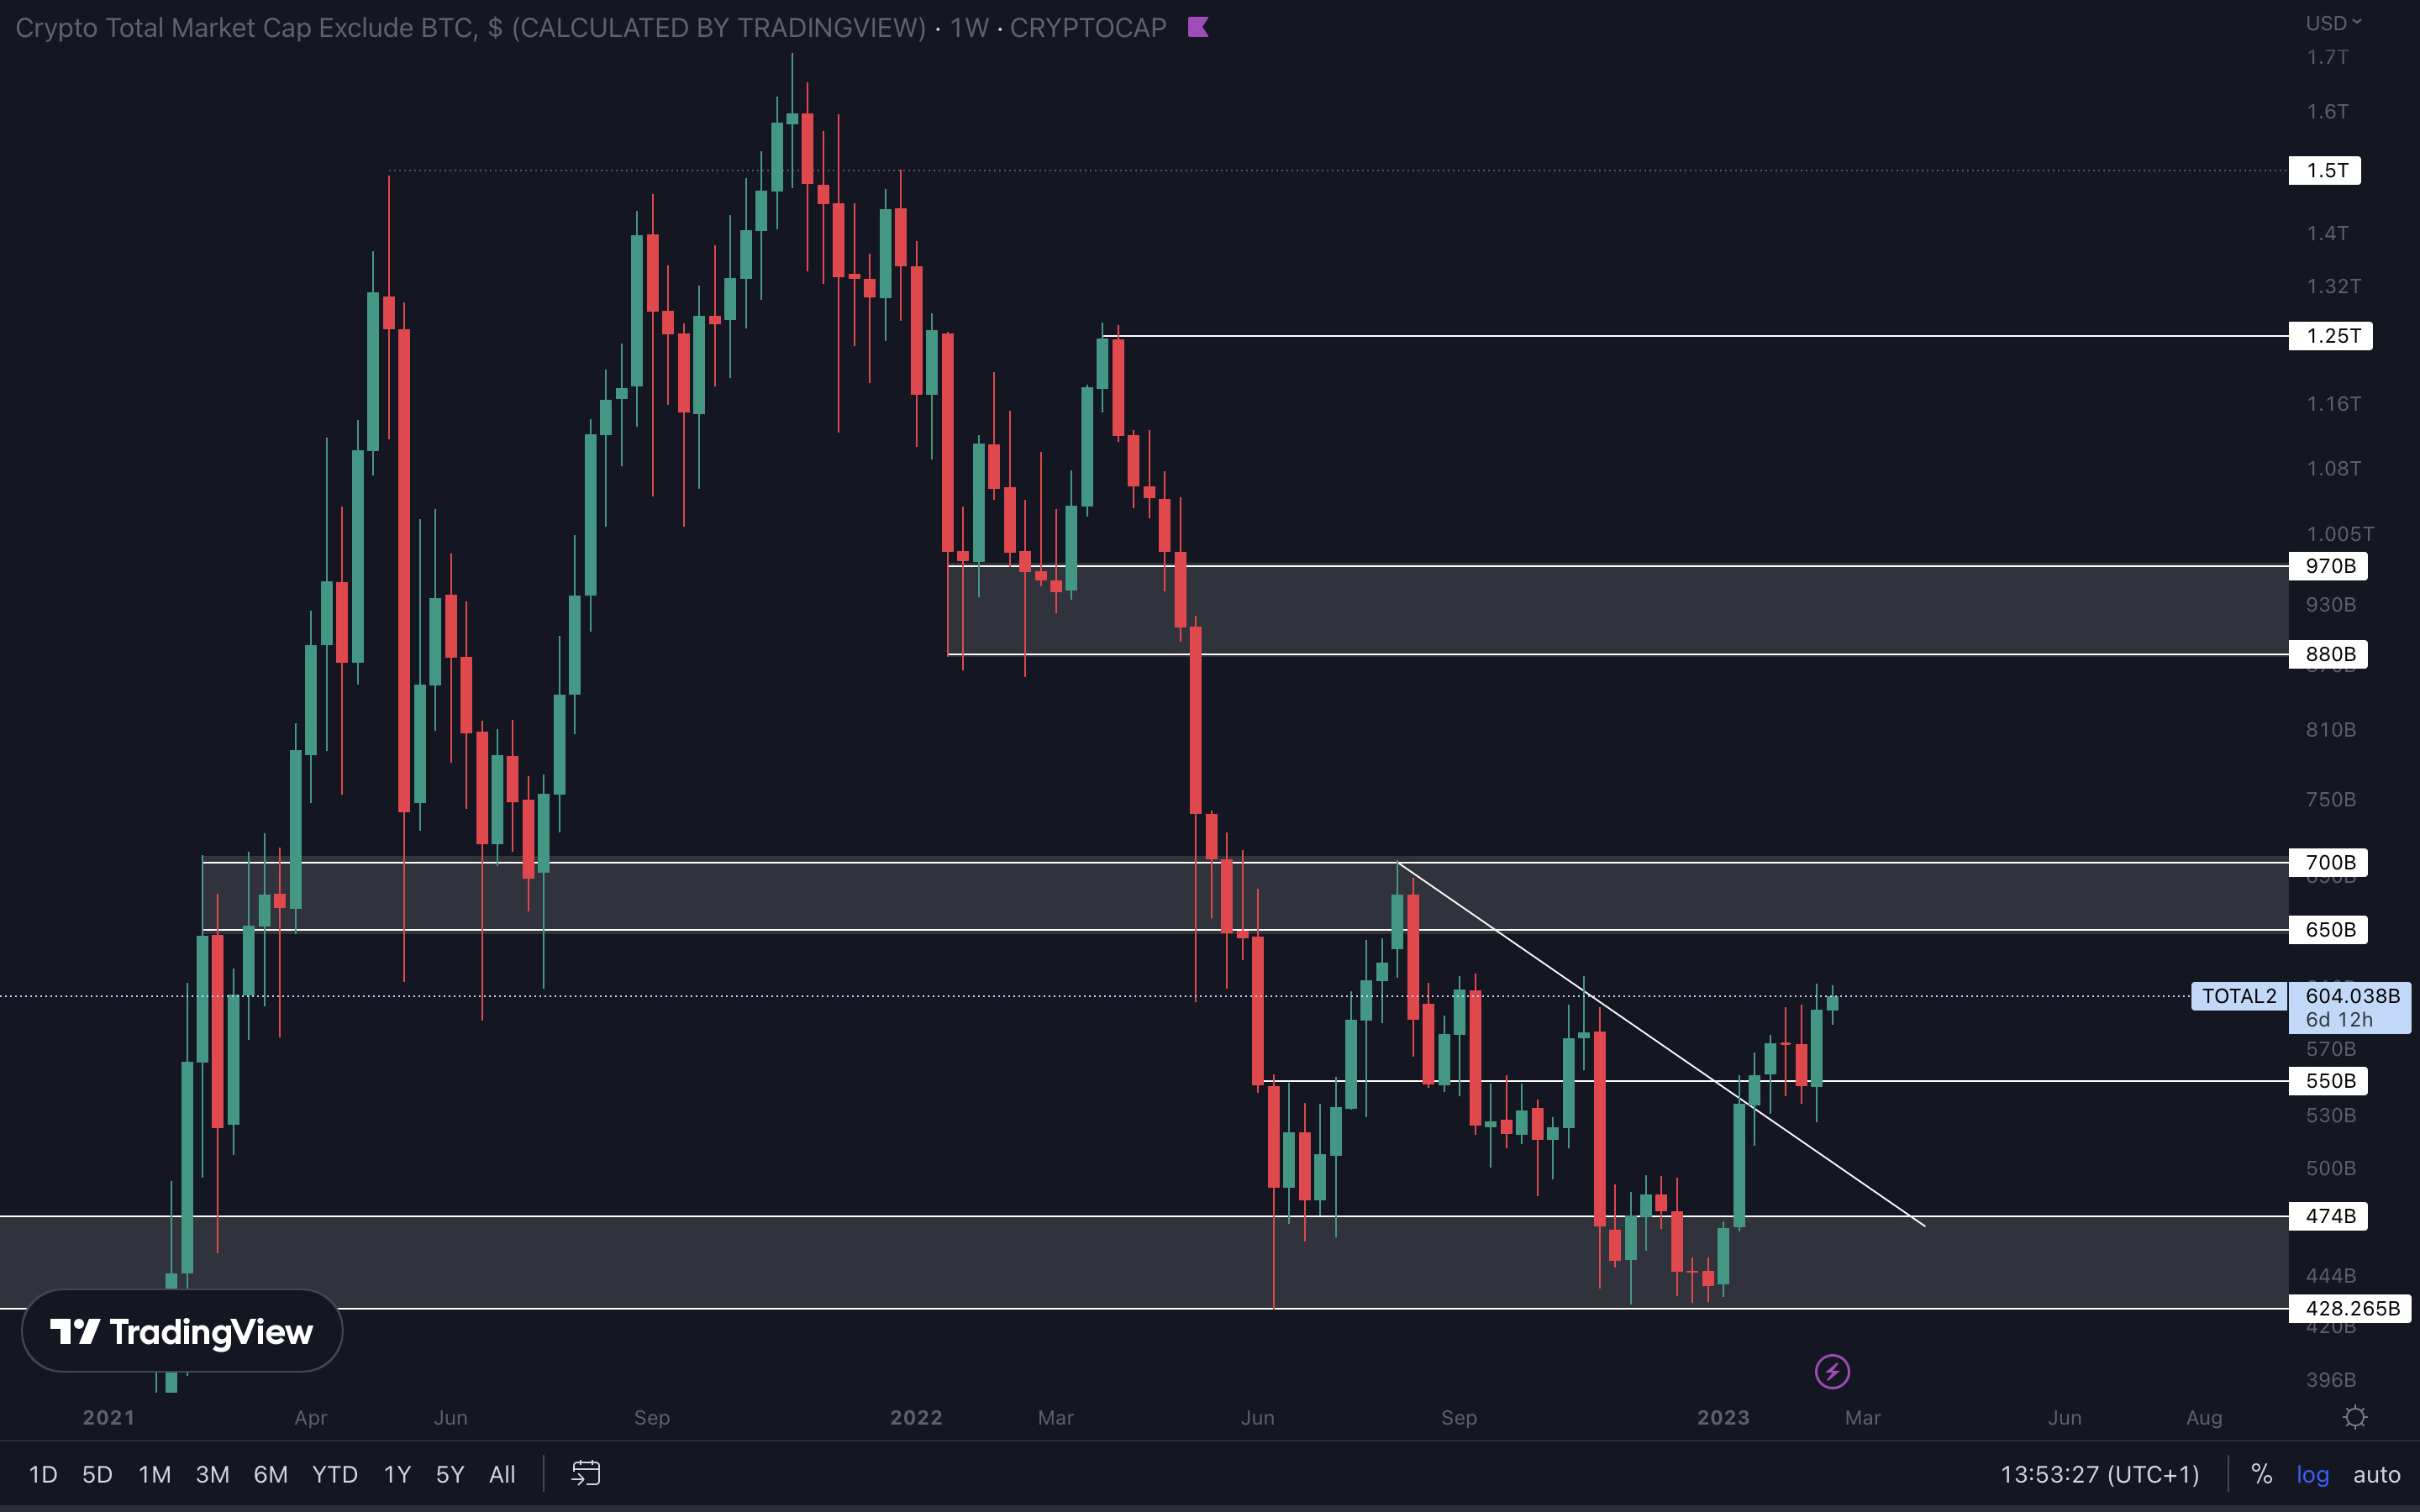

Like the TMC (Total Market Cap), this index also formed a bullish engulfing last week. This now opens the road to the $650B - $700B resistance area. If the market-wide rally continues, your attention should be moved to altcoins.
BTC | Bitcoin
ETH | Ethereum
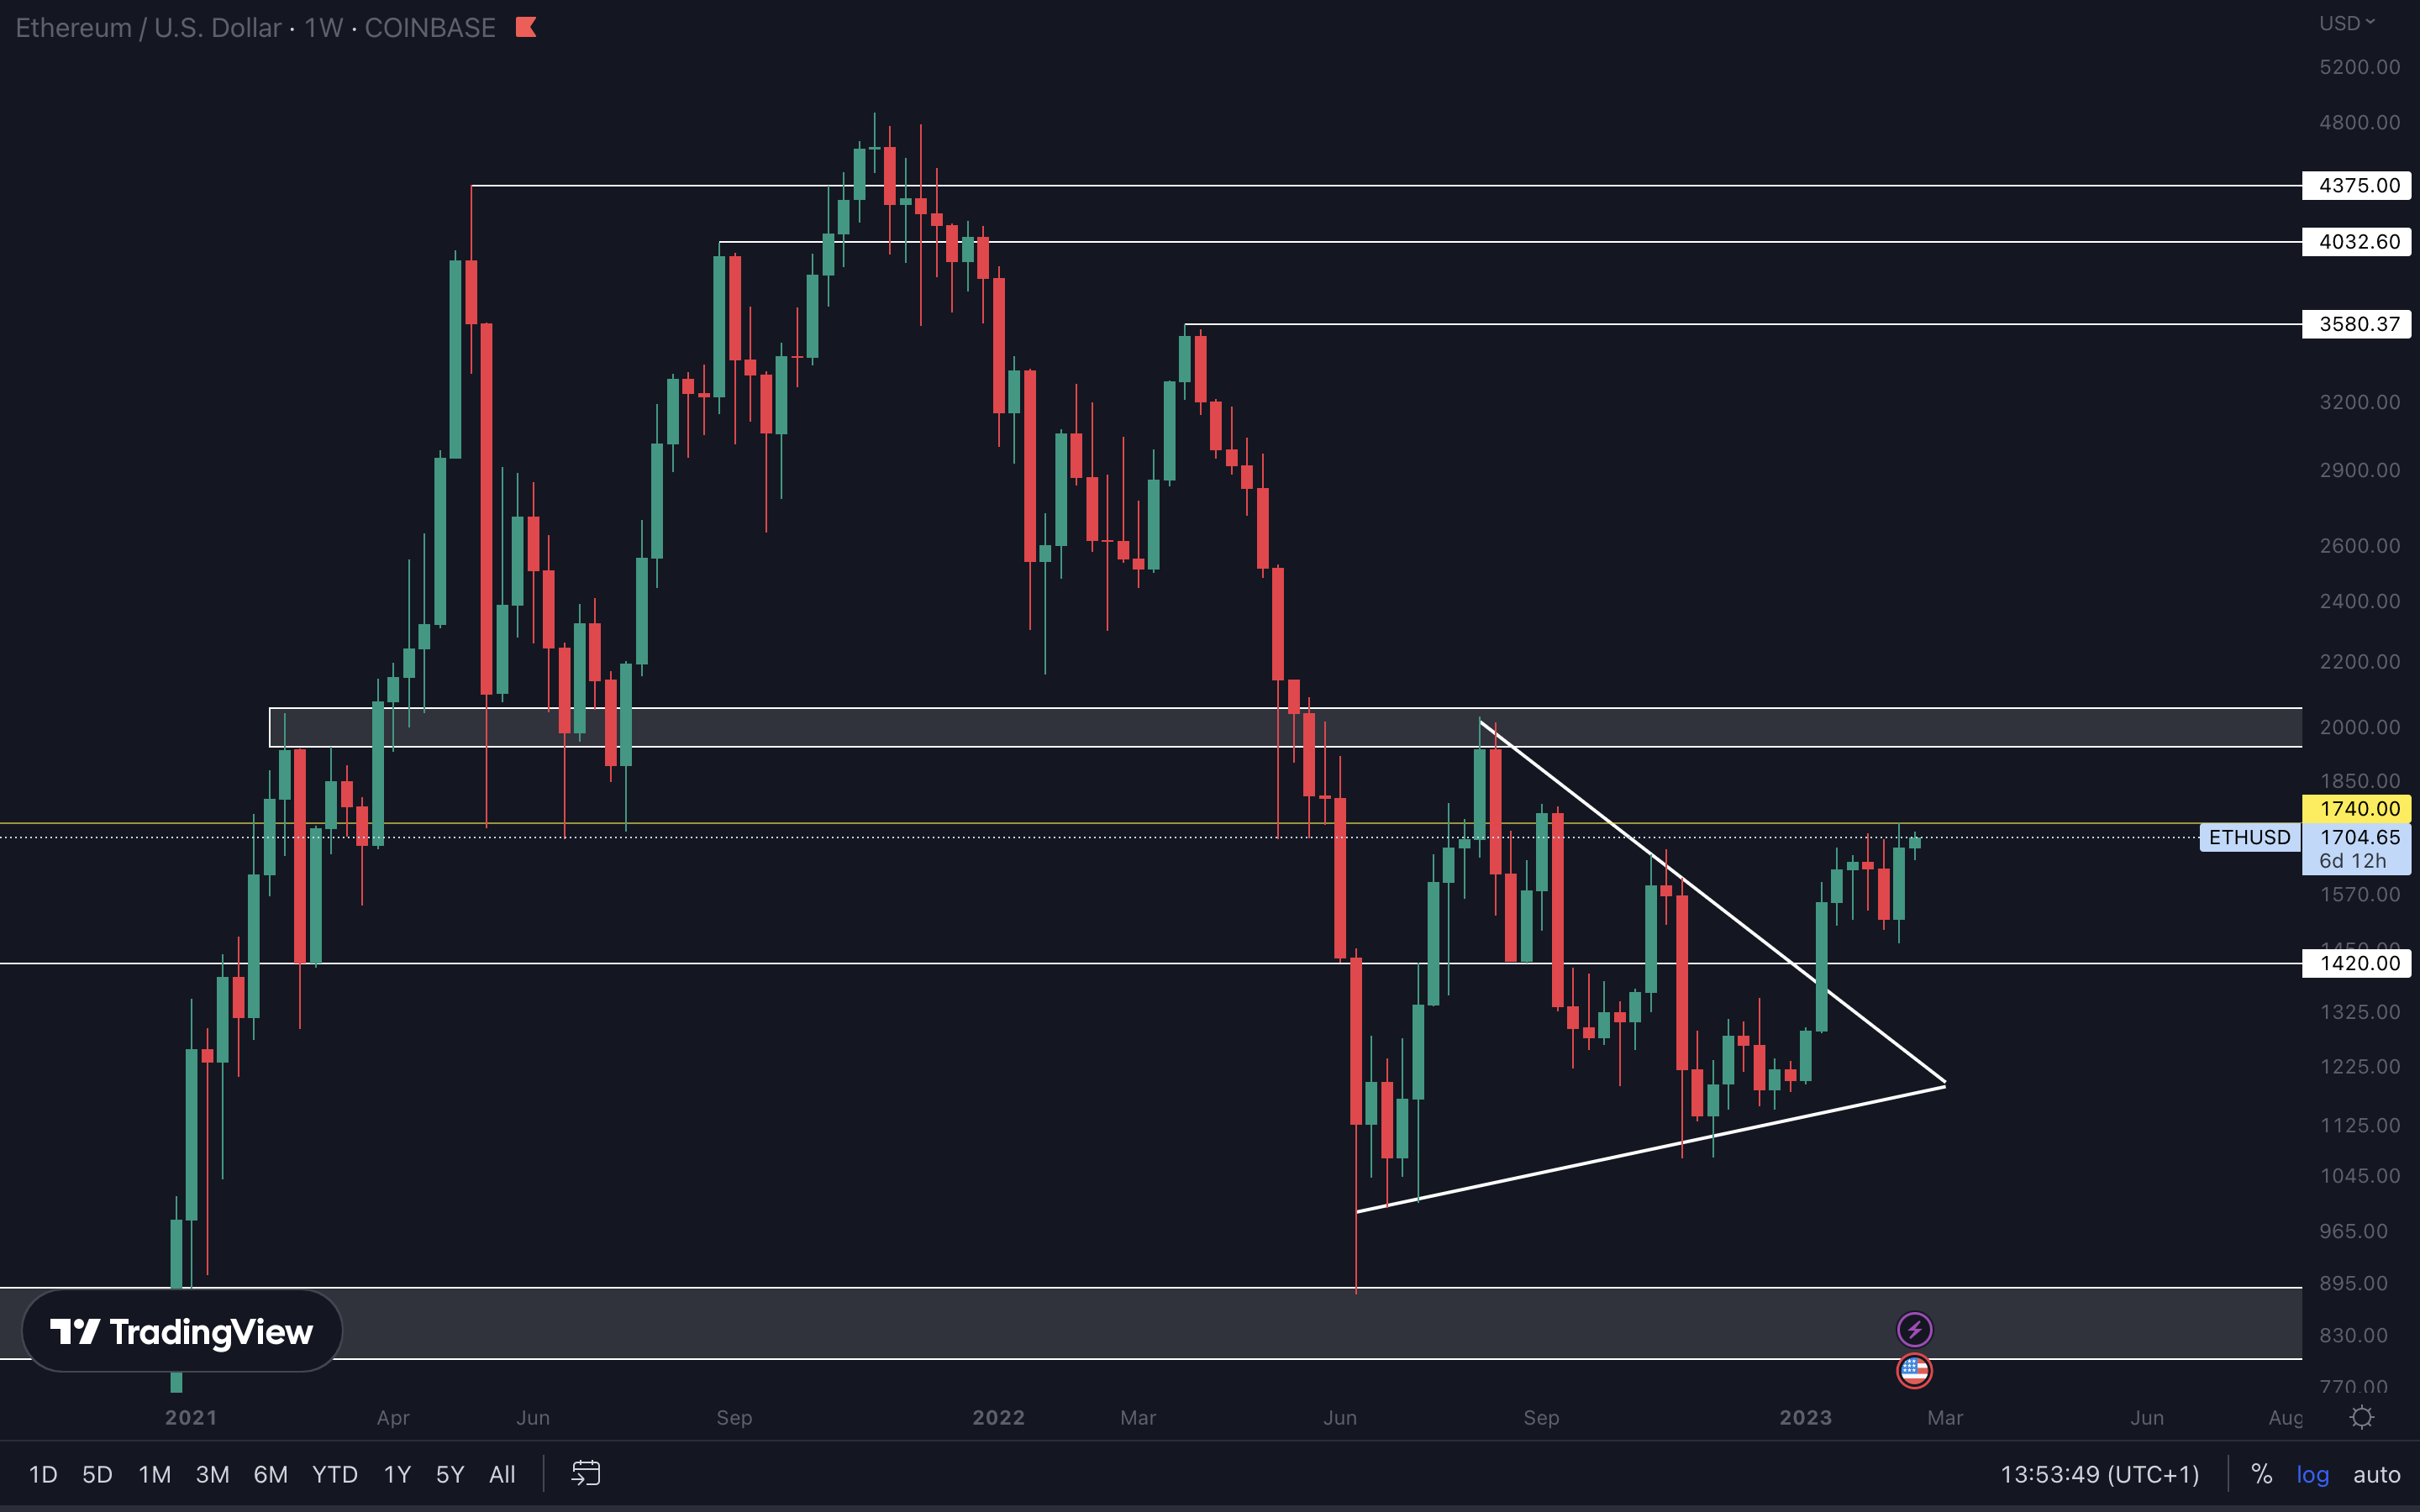
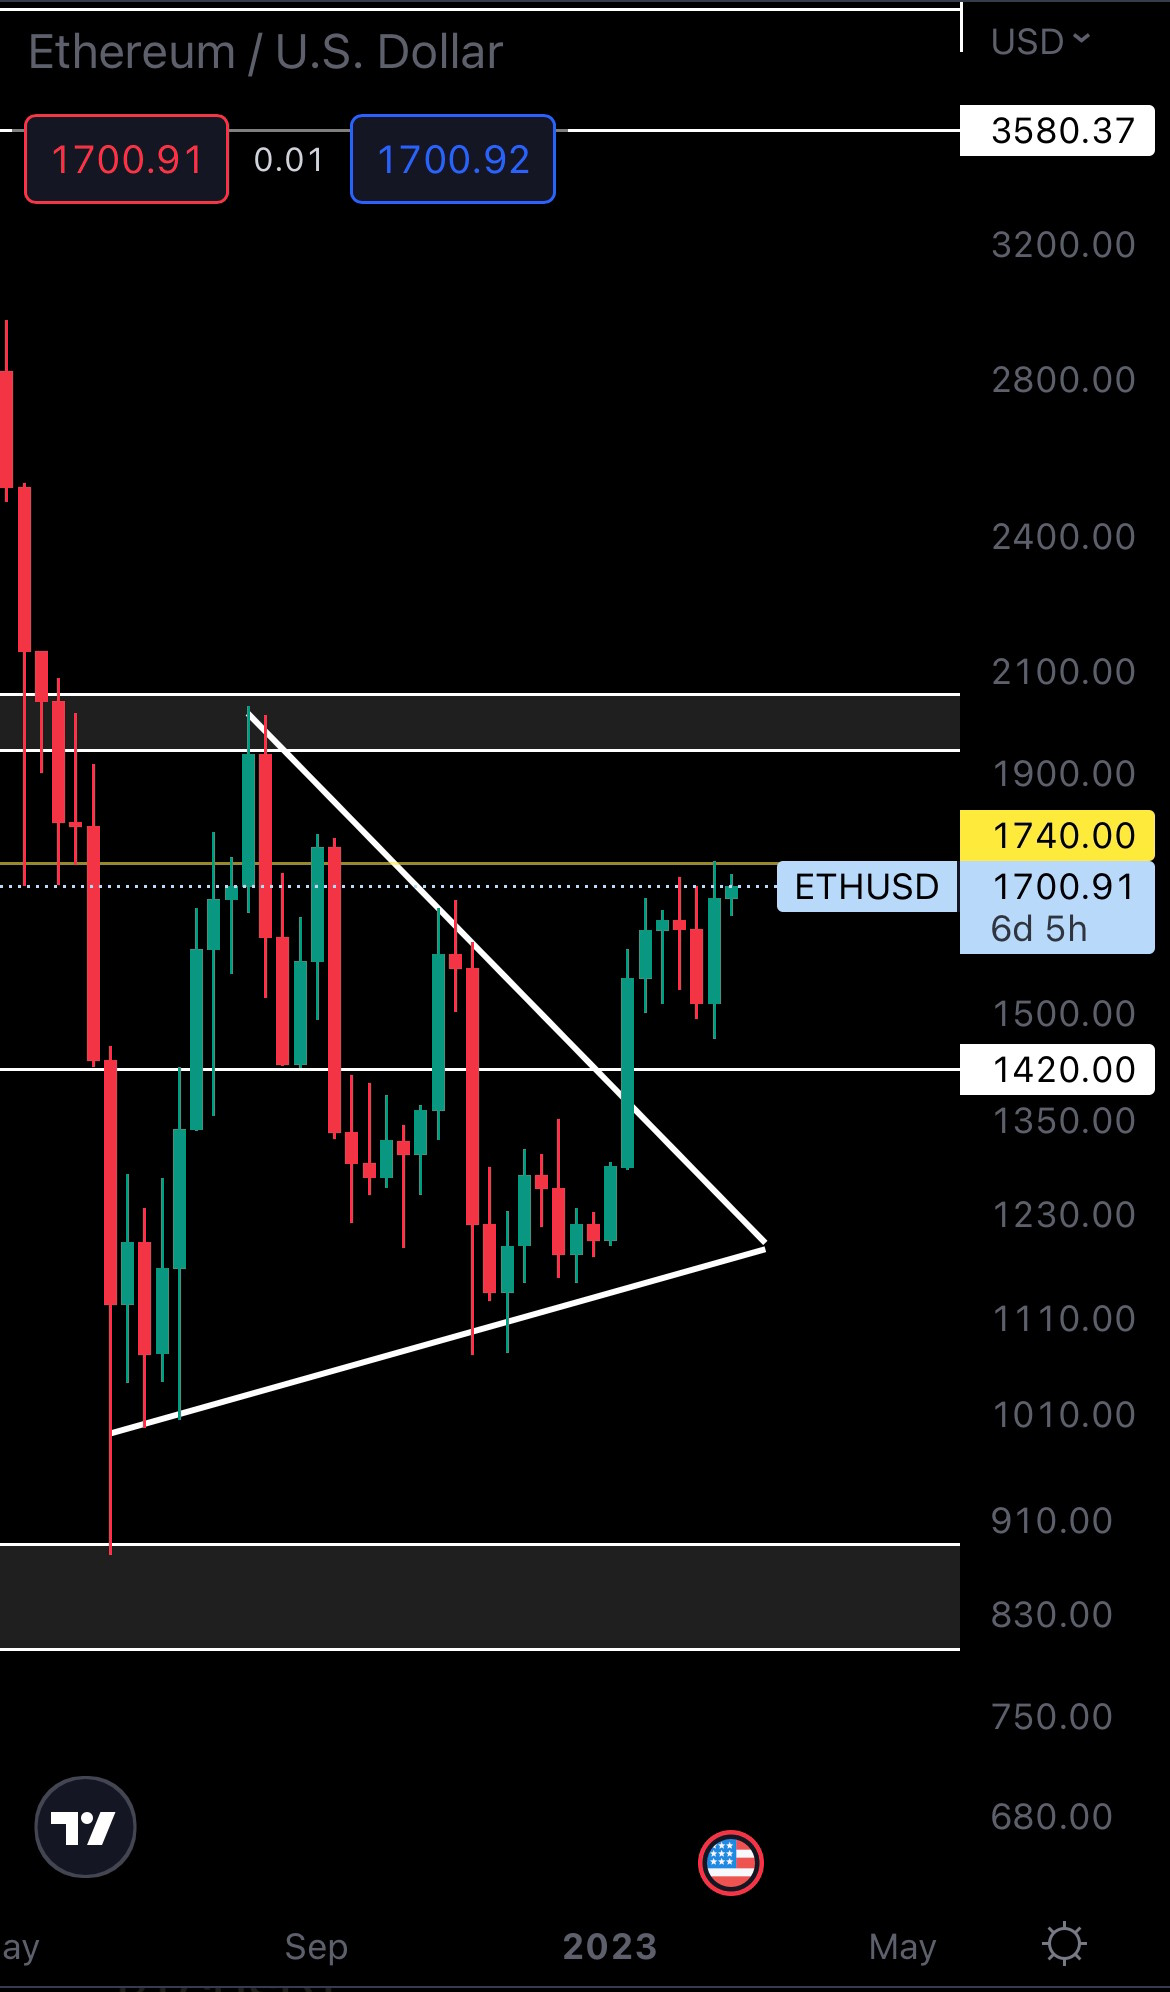
Bullish engulfing candle formed into resistance, so Ether is in the same boat as Bitcoin. For upside to properly be confirmed, Ether needs to close above $1740. The higher the timeframe, the more strength there is to the reclaim. A reclaim of $1740 will put $2000 as our next target for Ether.
SOL | Solana
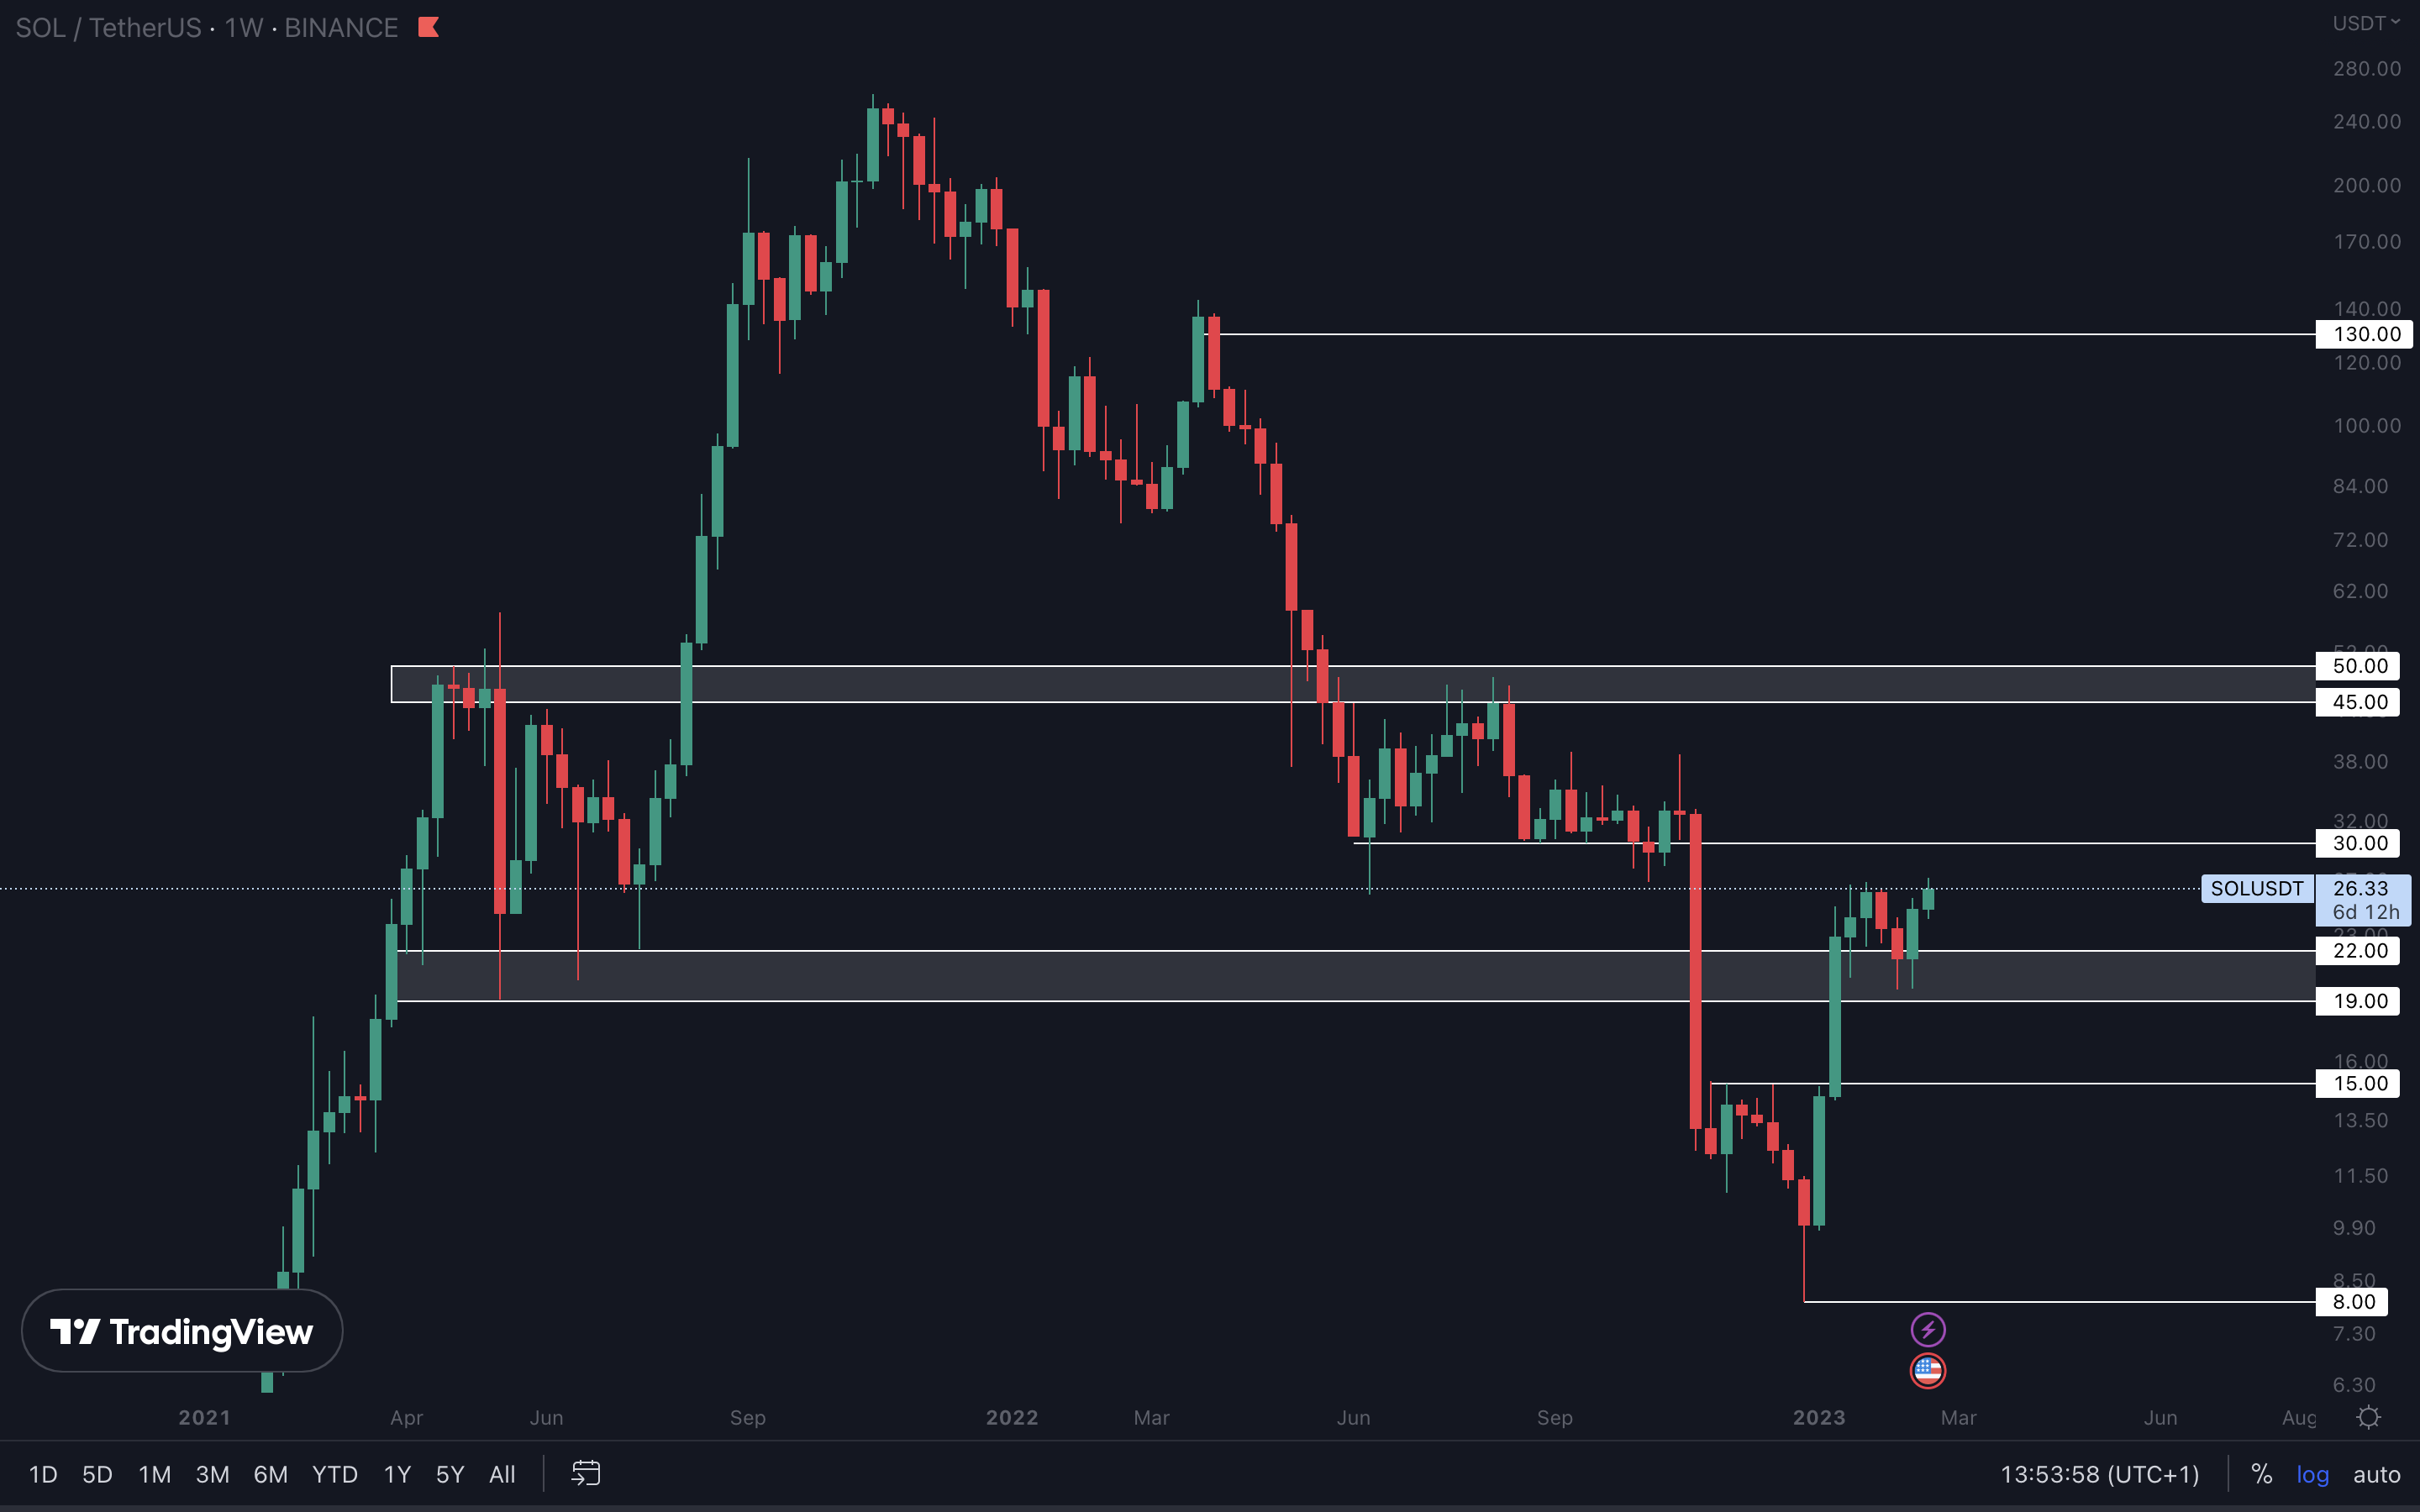
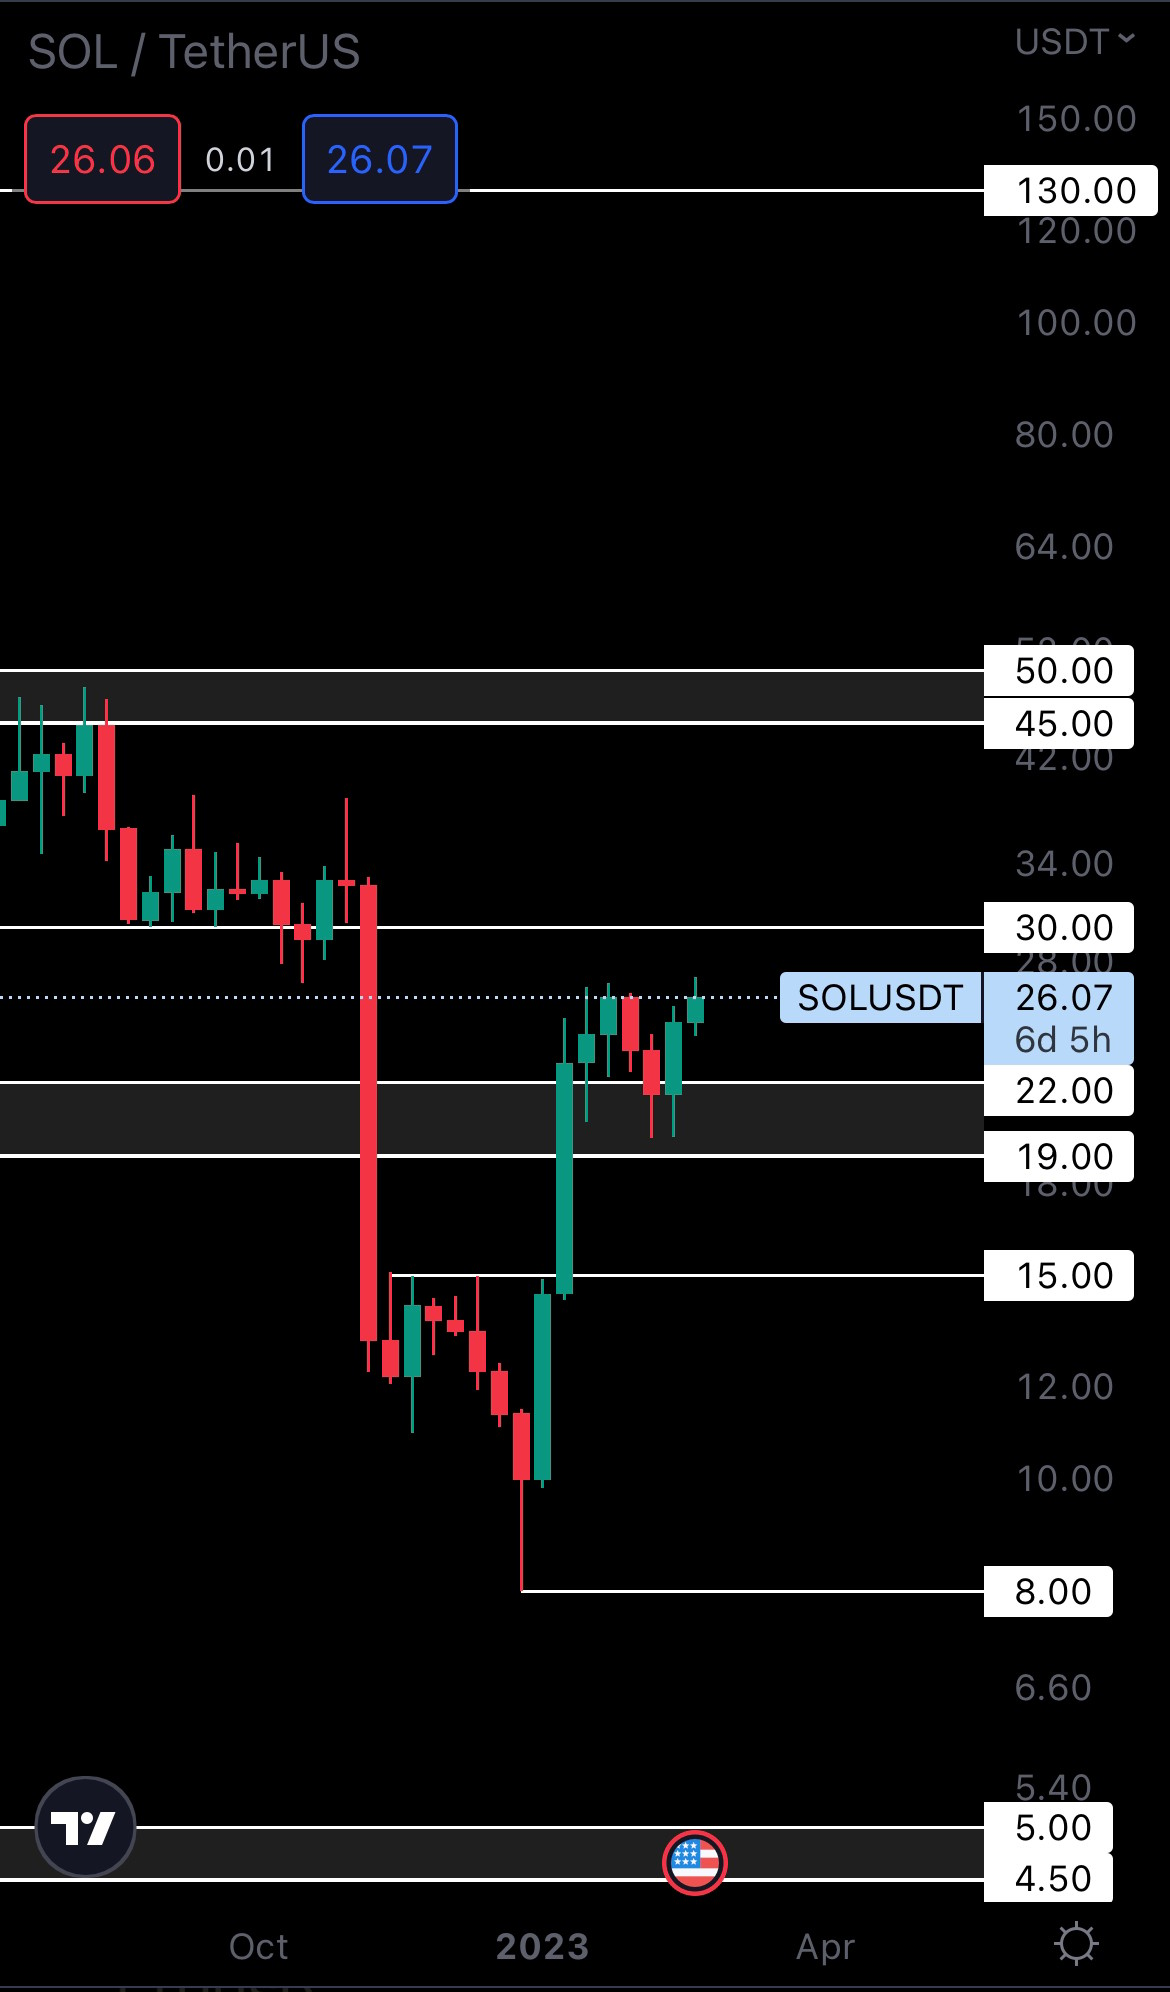
We’re just getting into the report, and this is already the 5th bullish engulfing candle we’ve seen. Are we really that bullish? We believe so. SOL took $19 - $22 as support and closed as a bullish engulfing candle last week. Not only that, but SOL’s weekly market structure has been shifted from bearish to bullish just today, because it formed a new high. These are all pointing to SOL testing $30 in the coming weeks.
RUNE | THORChain
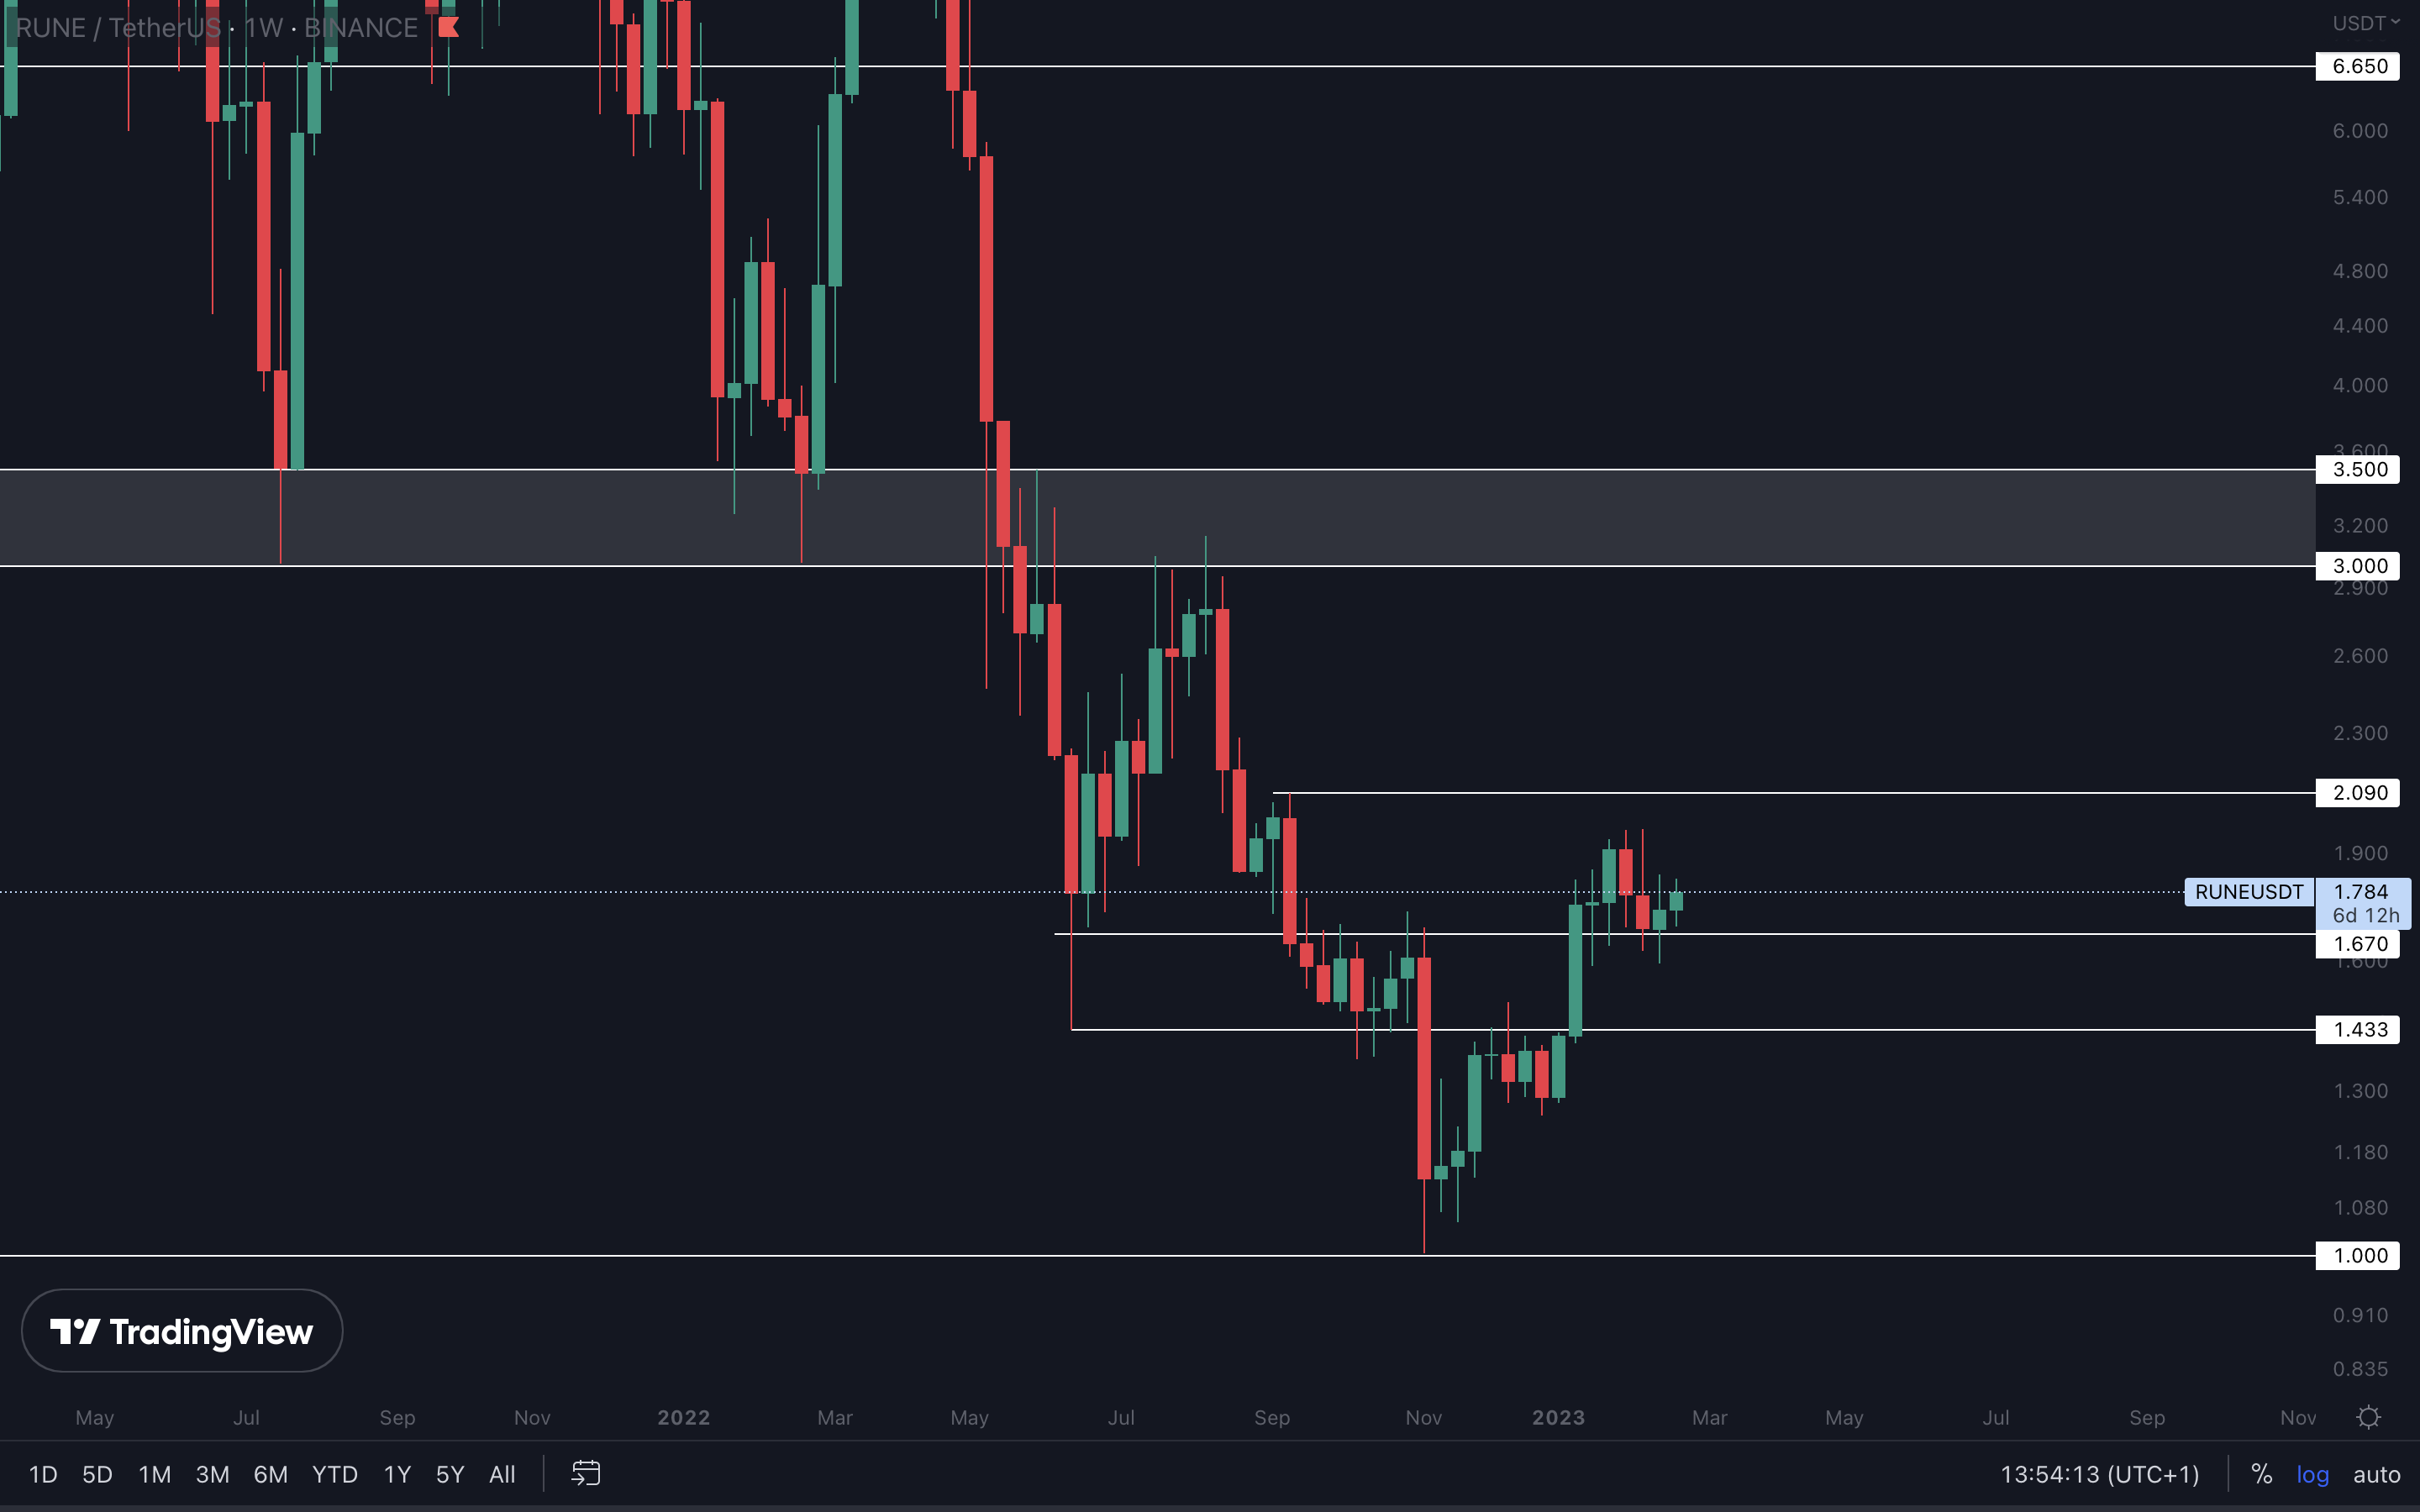
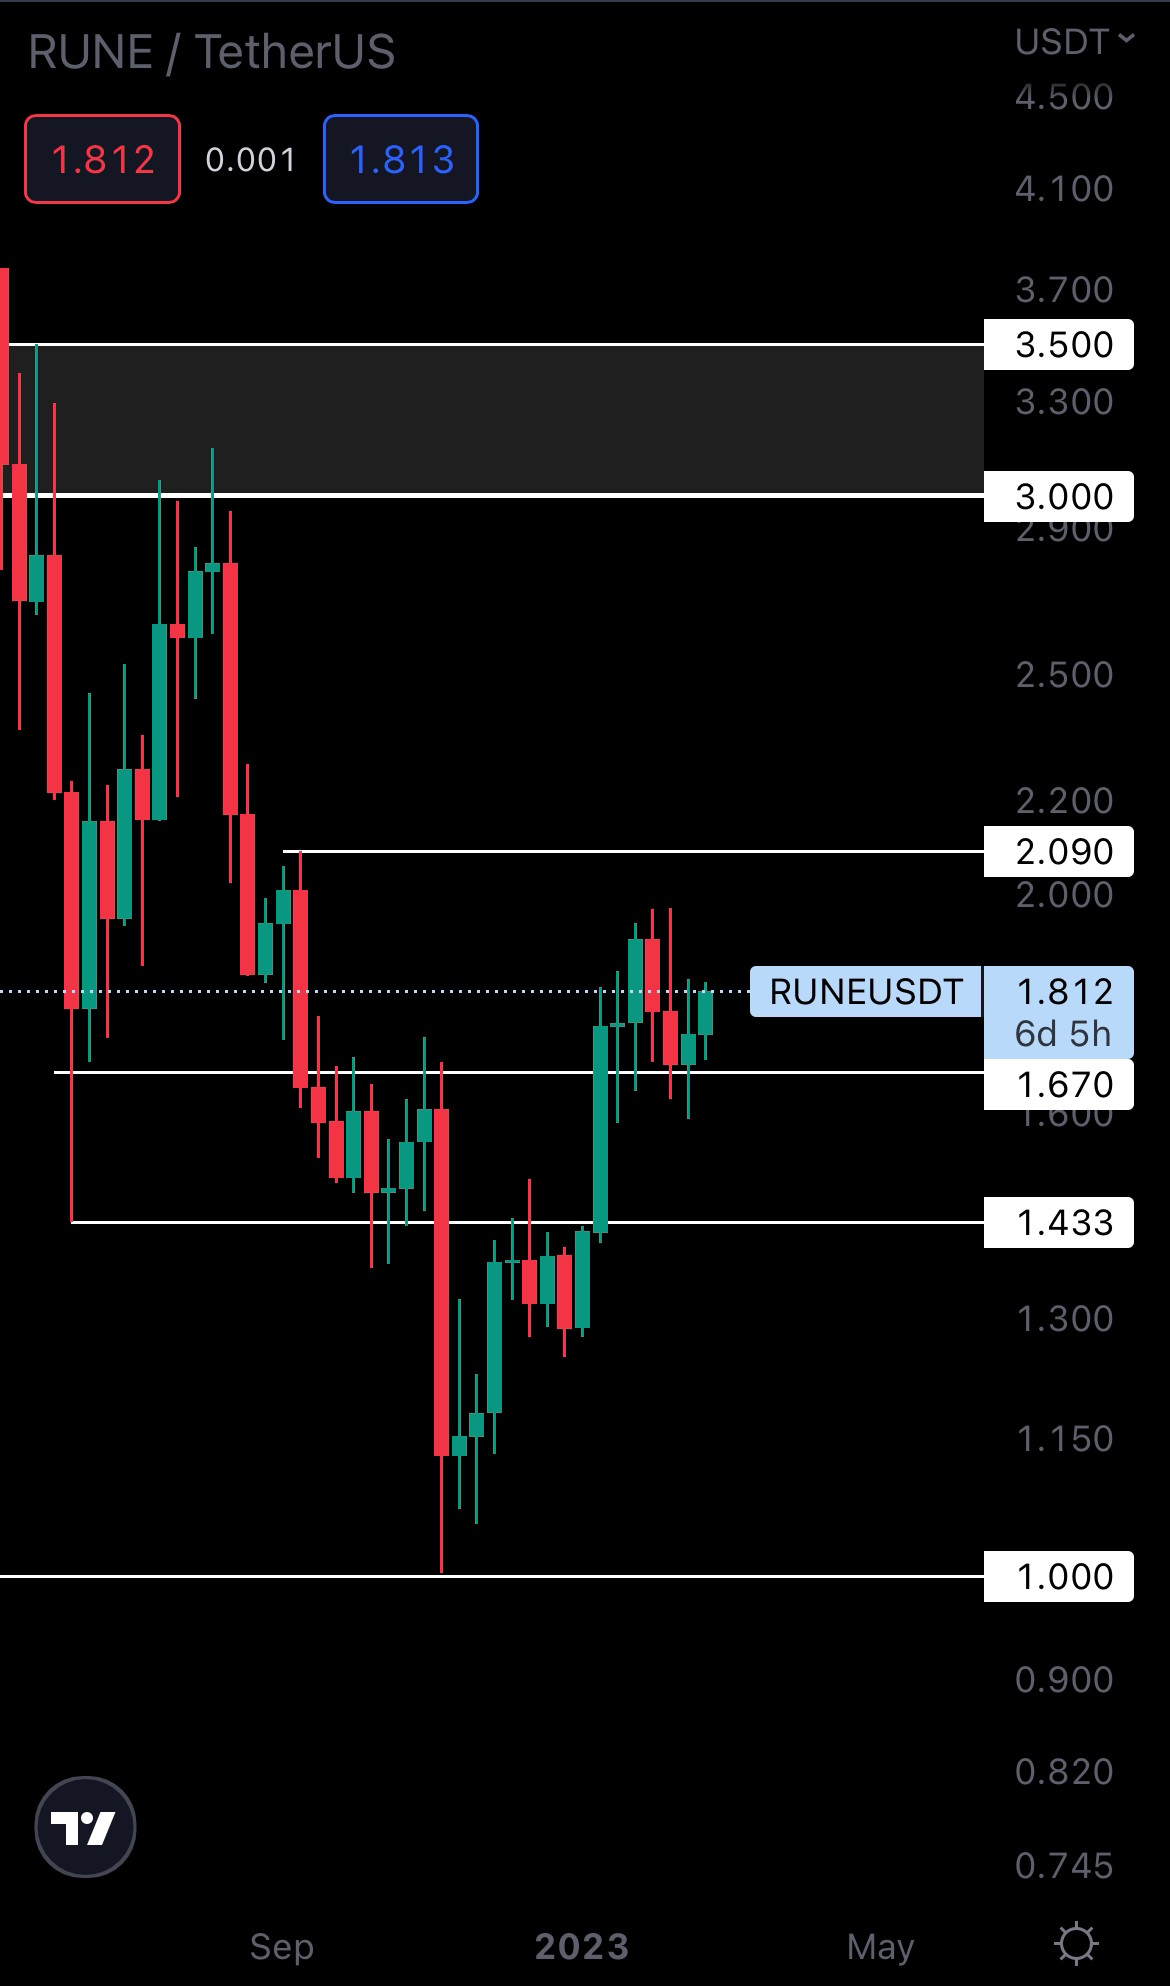
As long as $1.67 holds as support, RUNE could take a swing at $2.09 in the coming weeks. Given how the rest of the market looks bullish, it’s safe to assume this level will be reached.
SNX | Synthetix
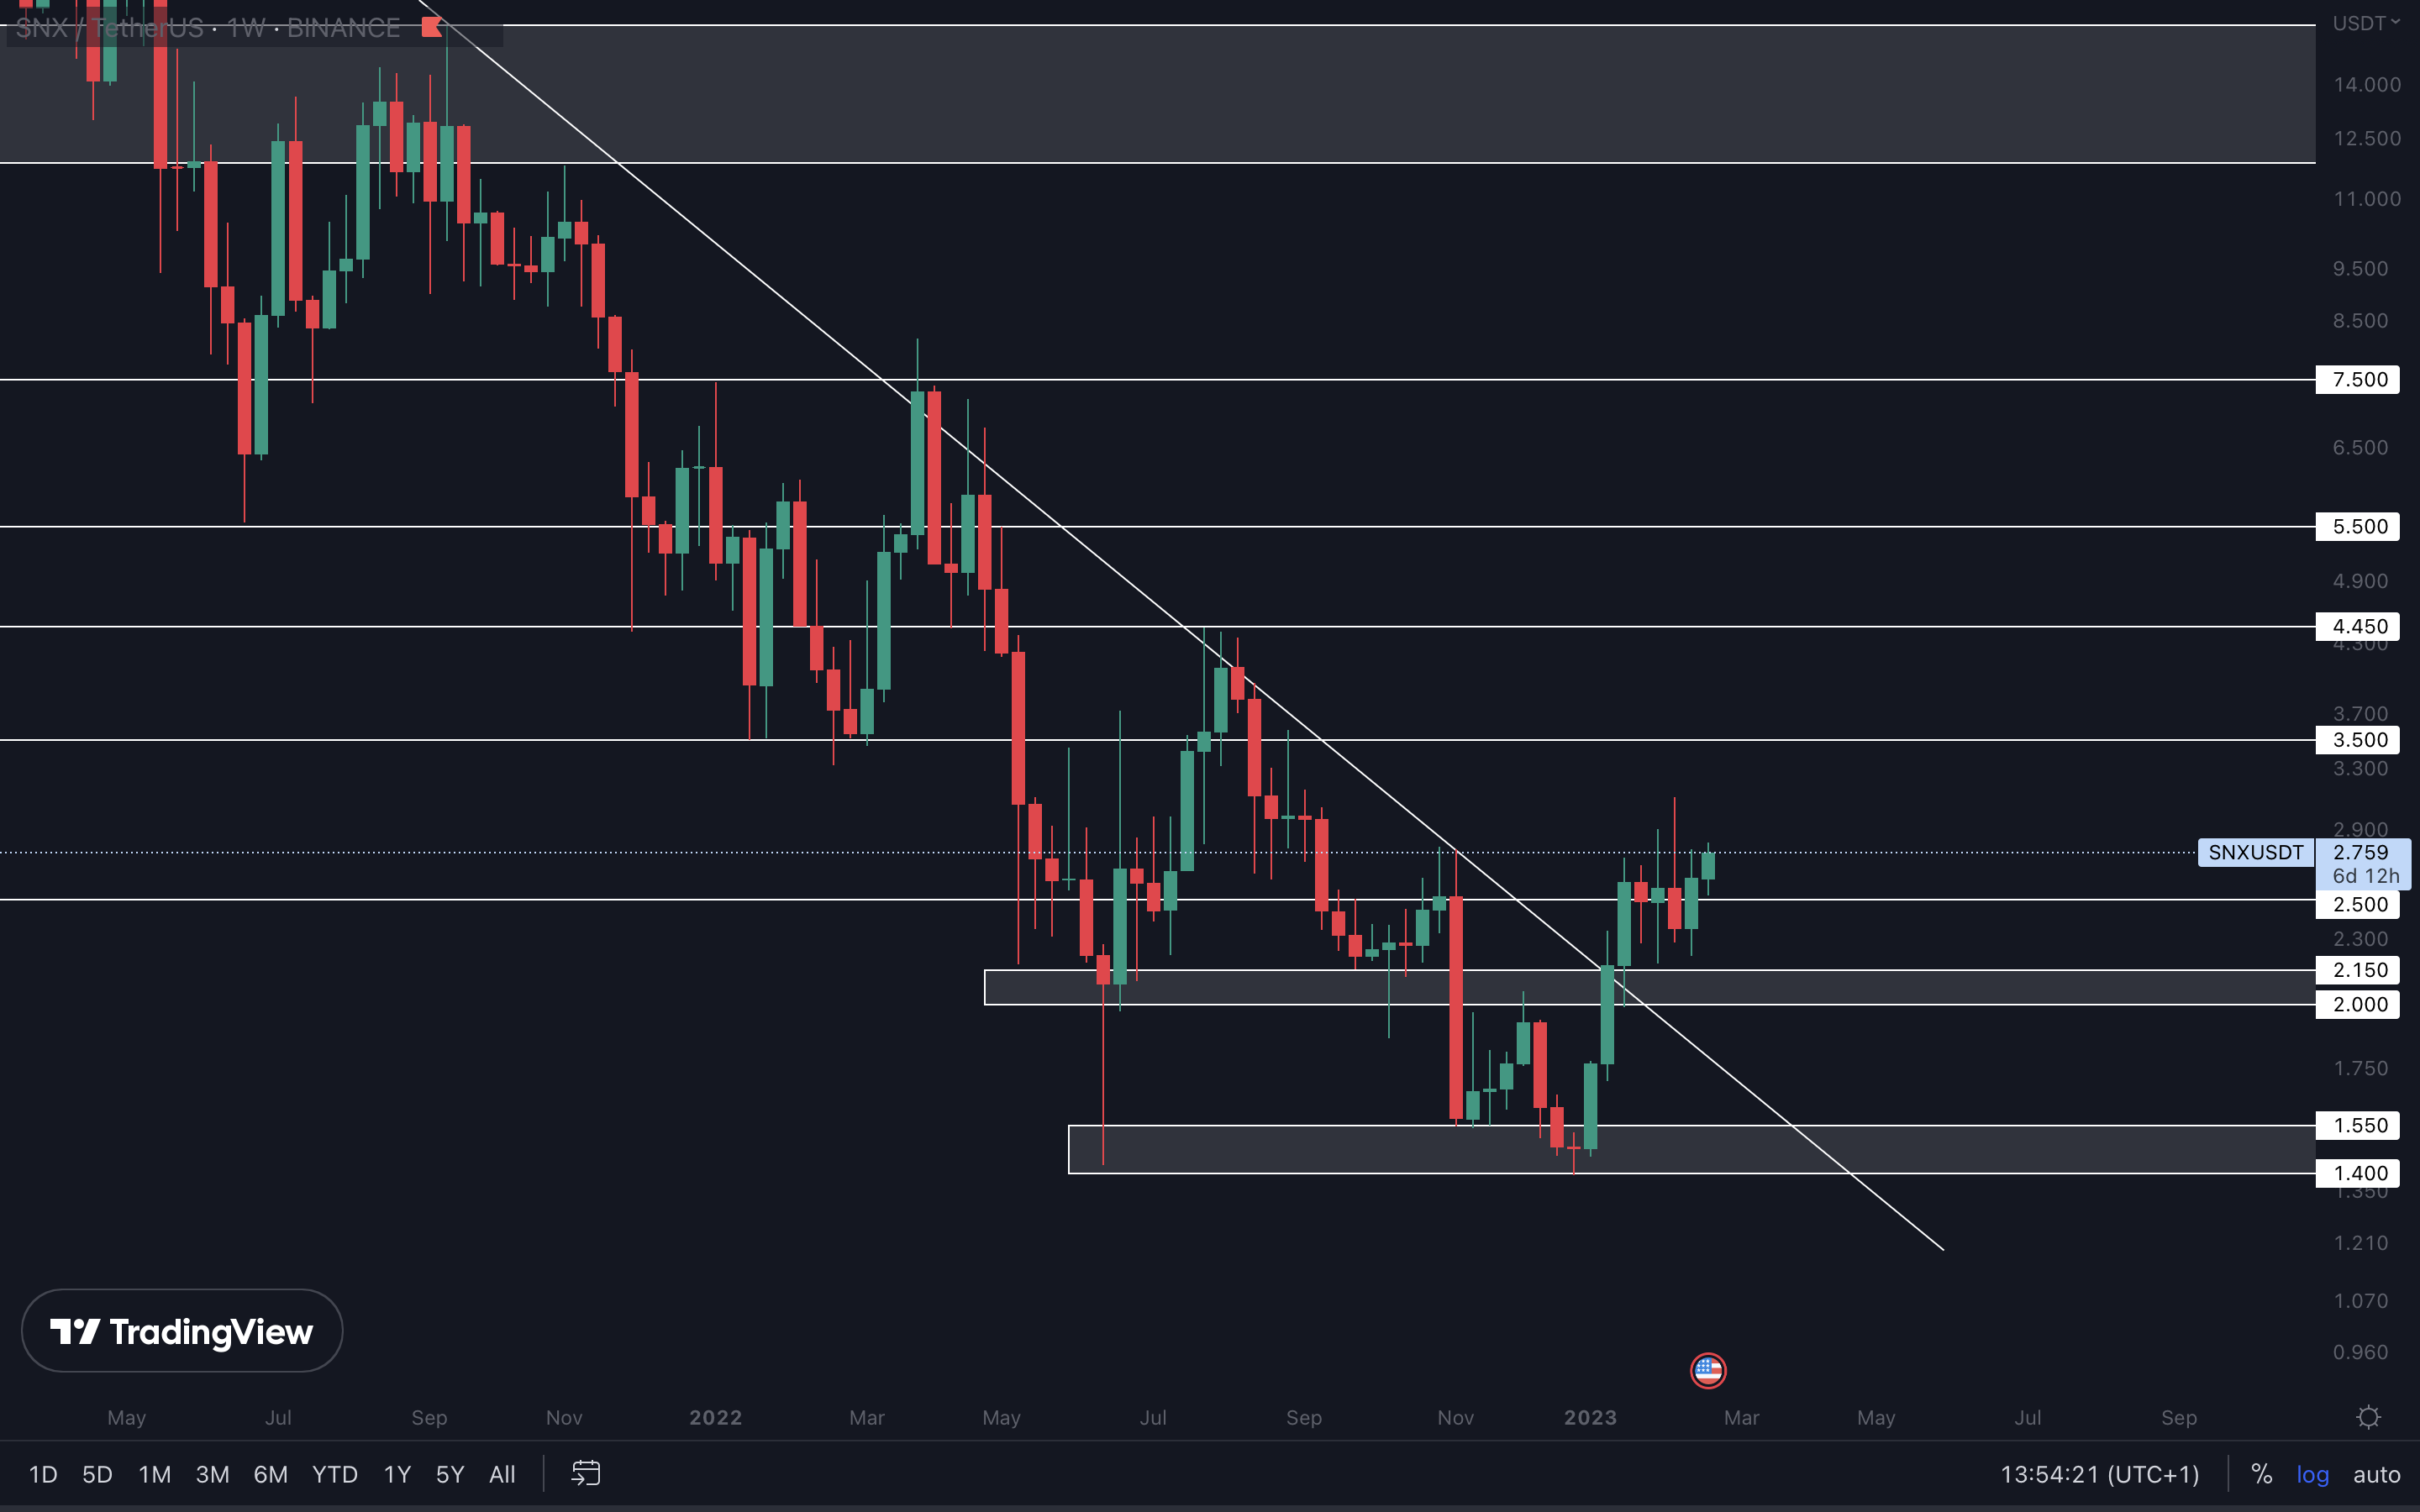
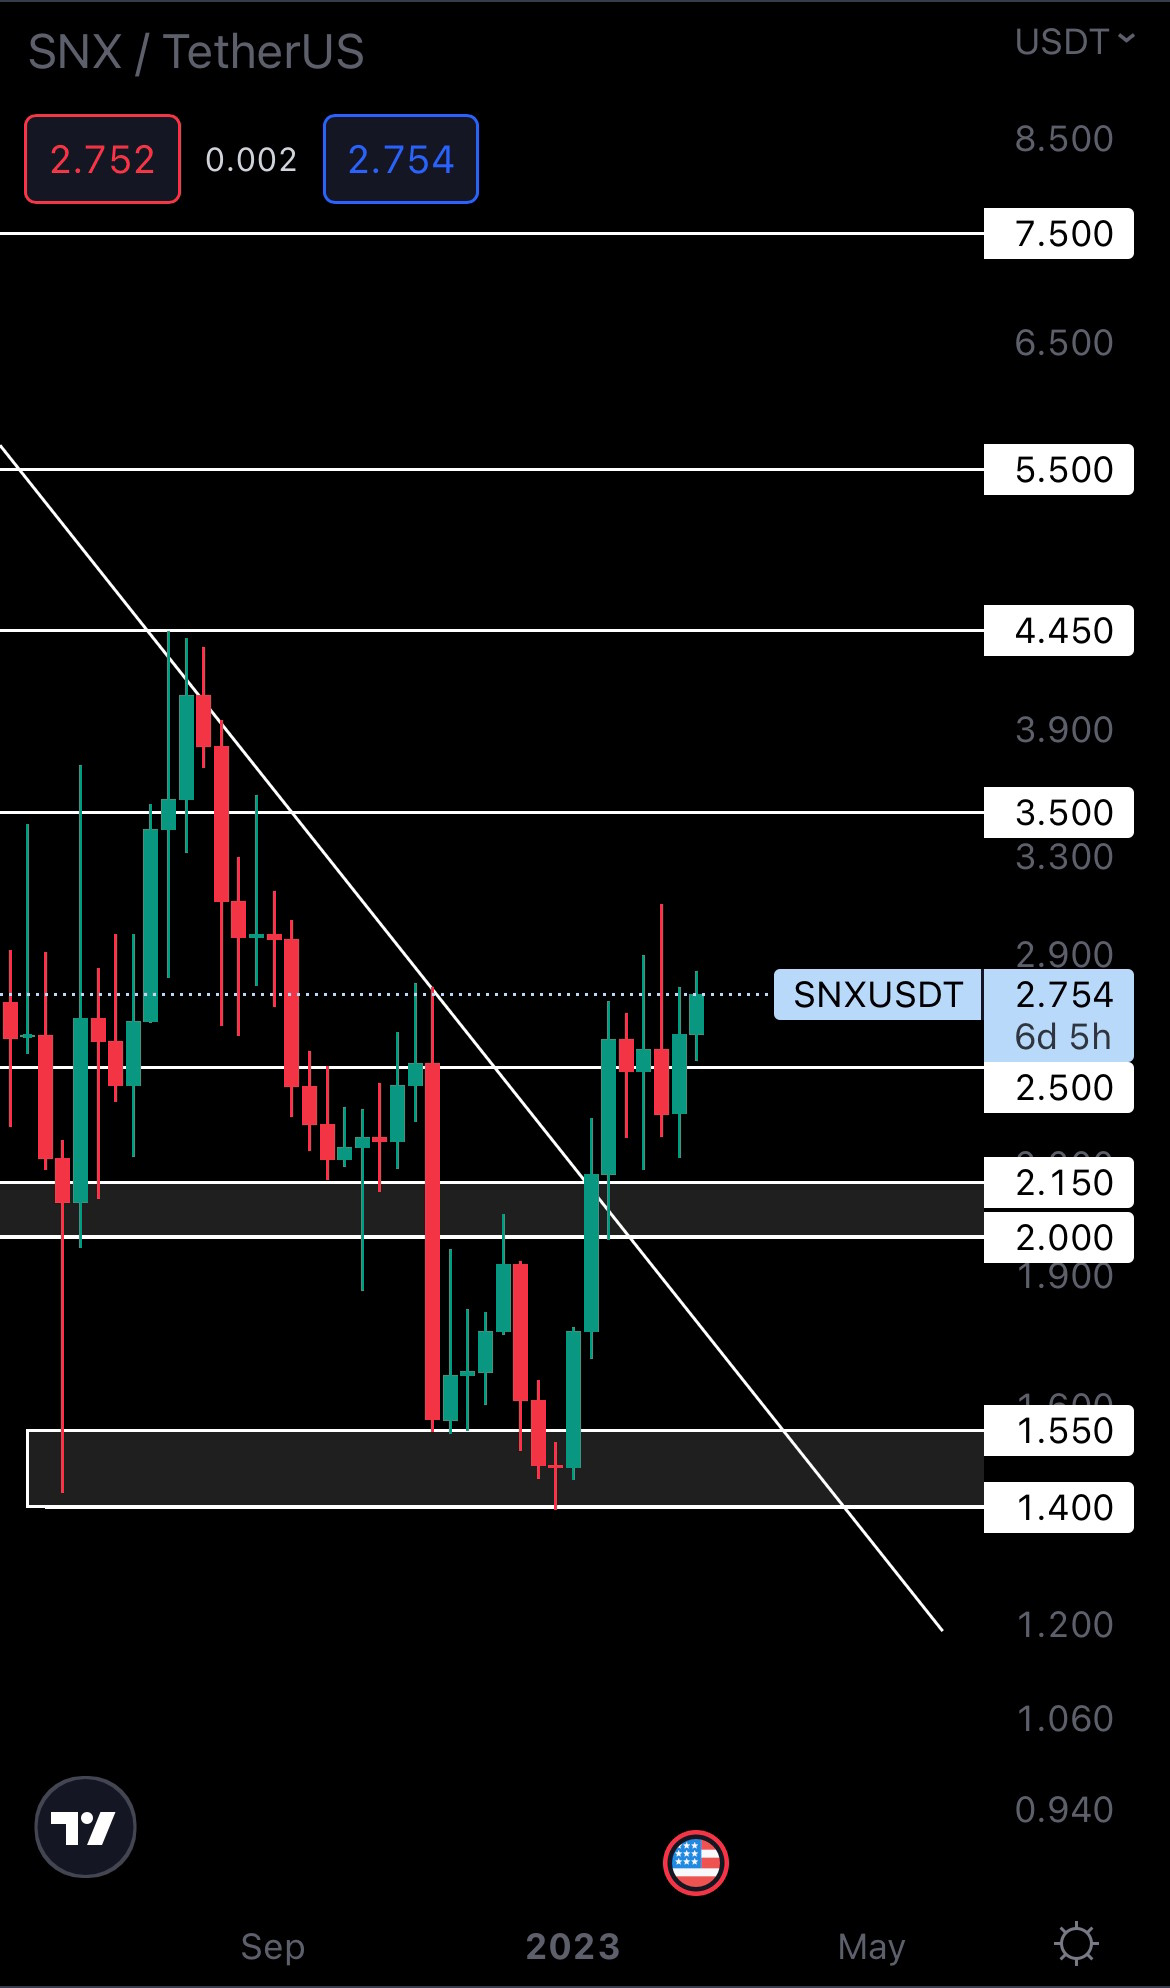
SNX managed to close back above $2.50. In confluence with the rest of the market, we might be looking at upside here to the $3.50 resistance level, potentially even $4.45. An invalidation of this scenario occurs when $2.50 is lost.
dYdX | DYDX
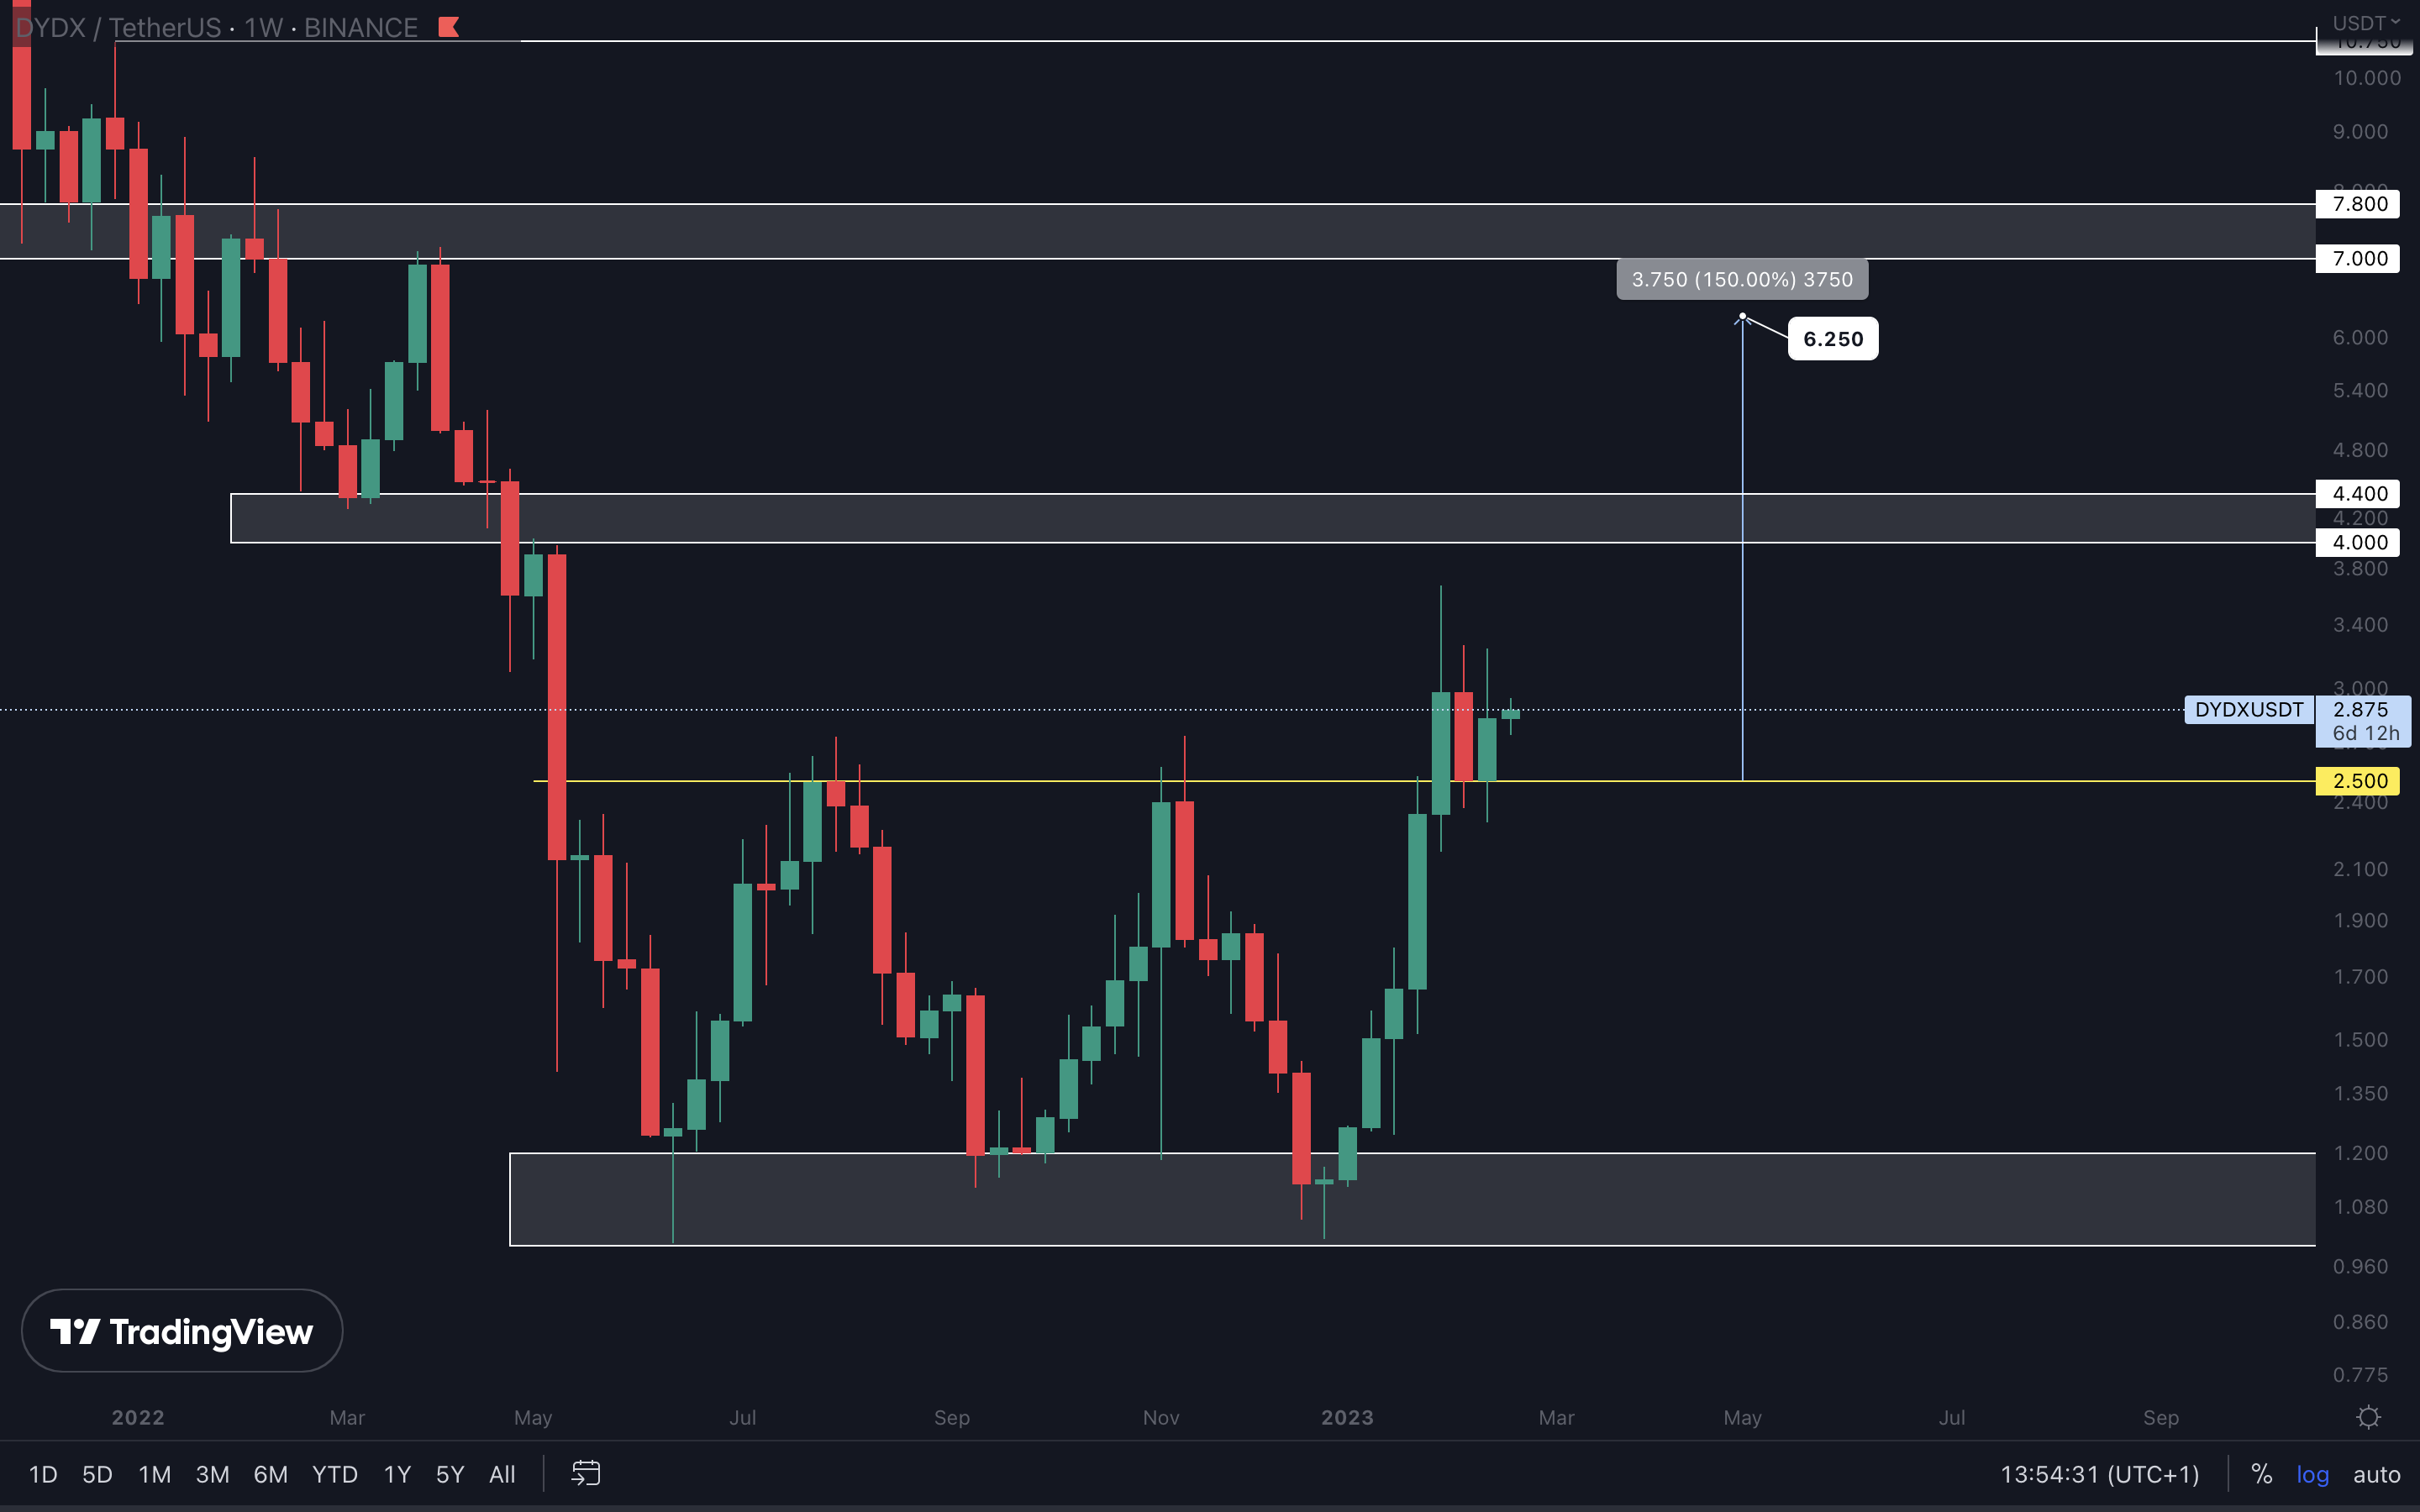
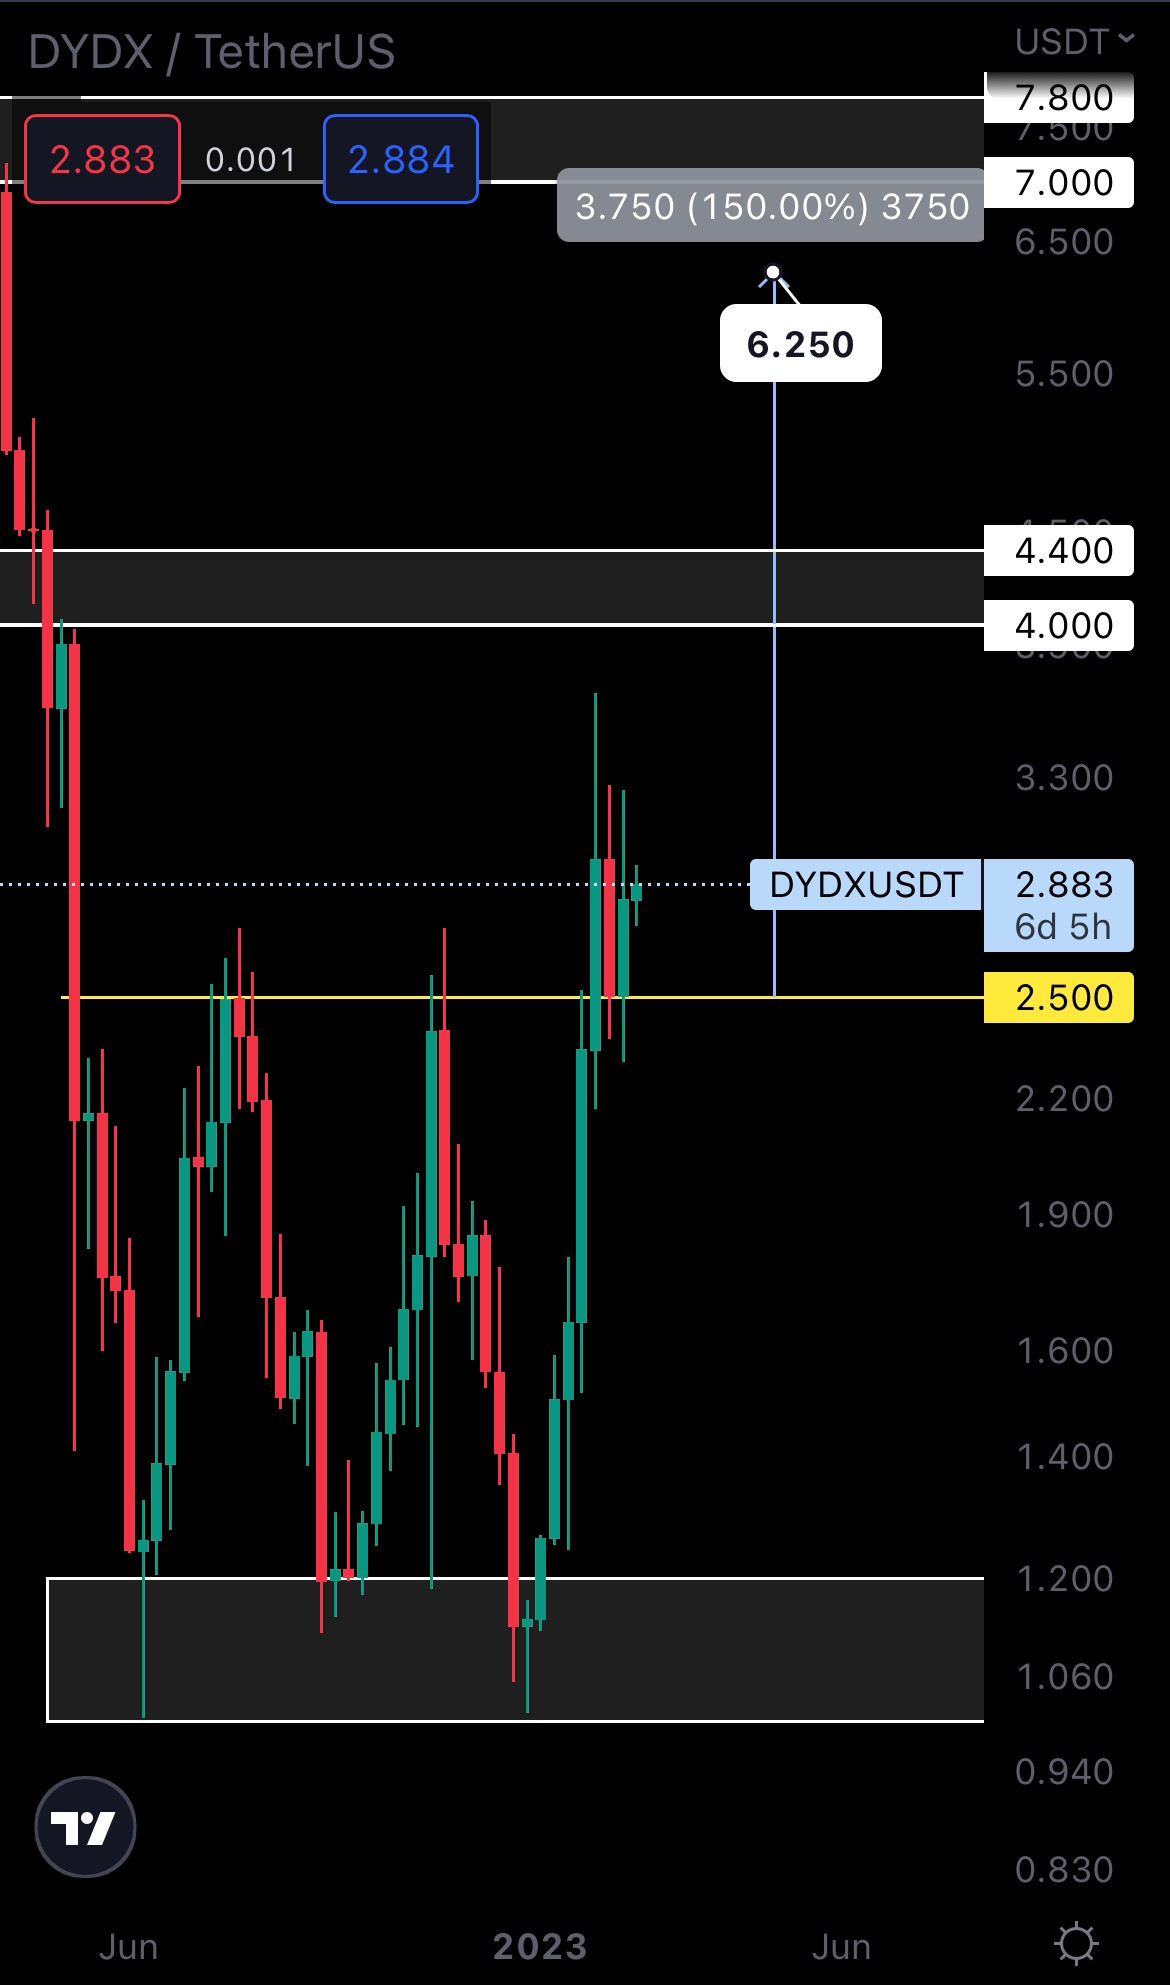
As long as DYDX stays above $2.50, the road to the $4 - $4.40 resistance area remains intact, as well as the target from the triple bottom ($6.25). Whether $6.25 is achieved or not remains in the hands of Bitcoin, but we believe $4 will be tested in the coming weeks if Bitcoin manages to break above $25,150.
Cryptonary's Watchlist
DOT | Polkadot
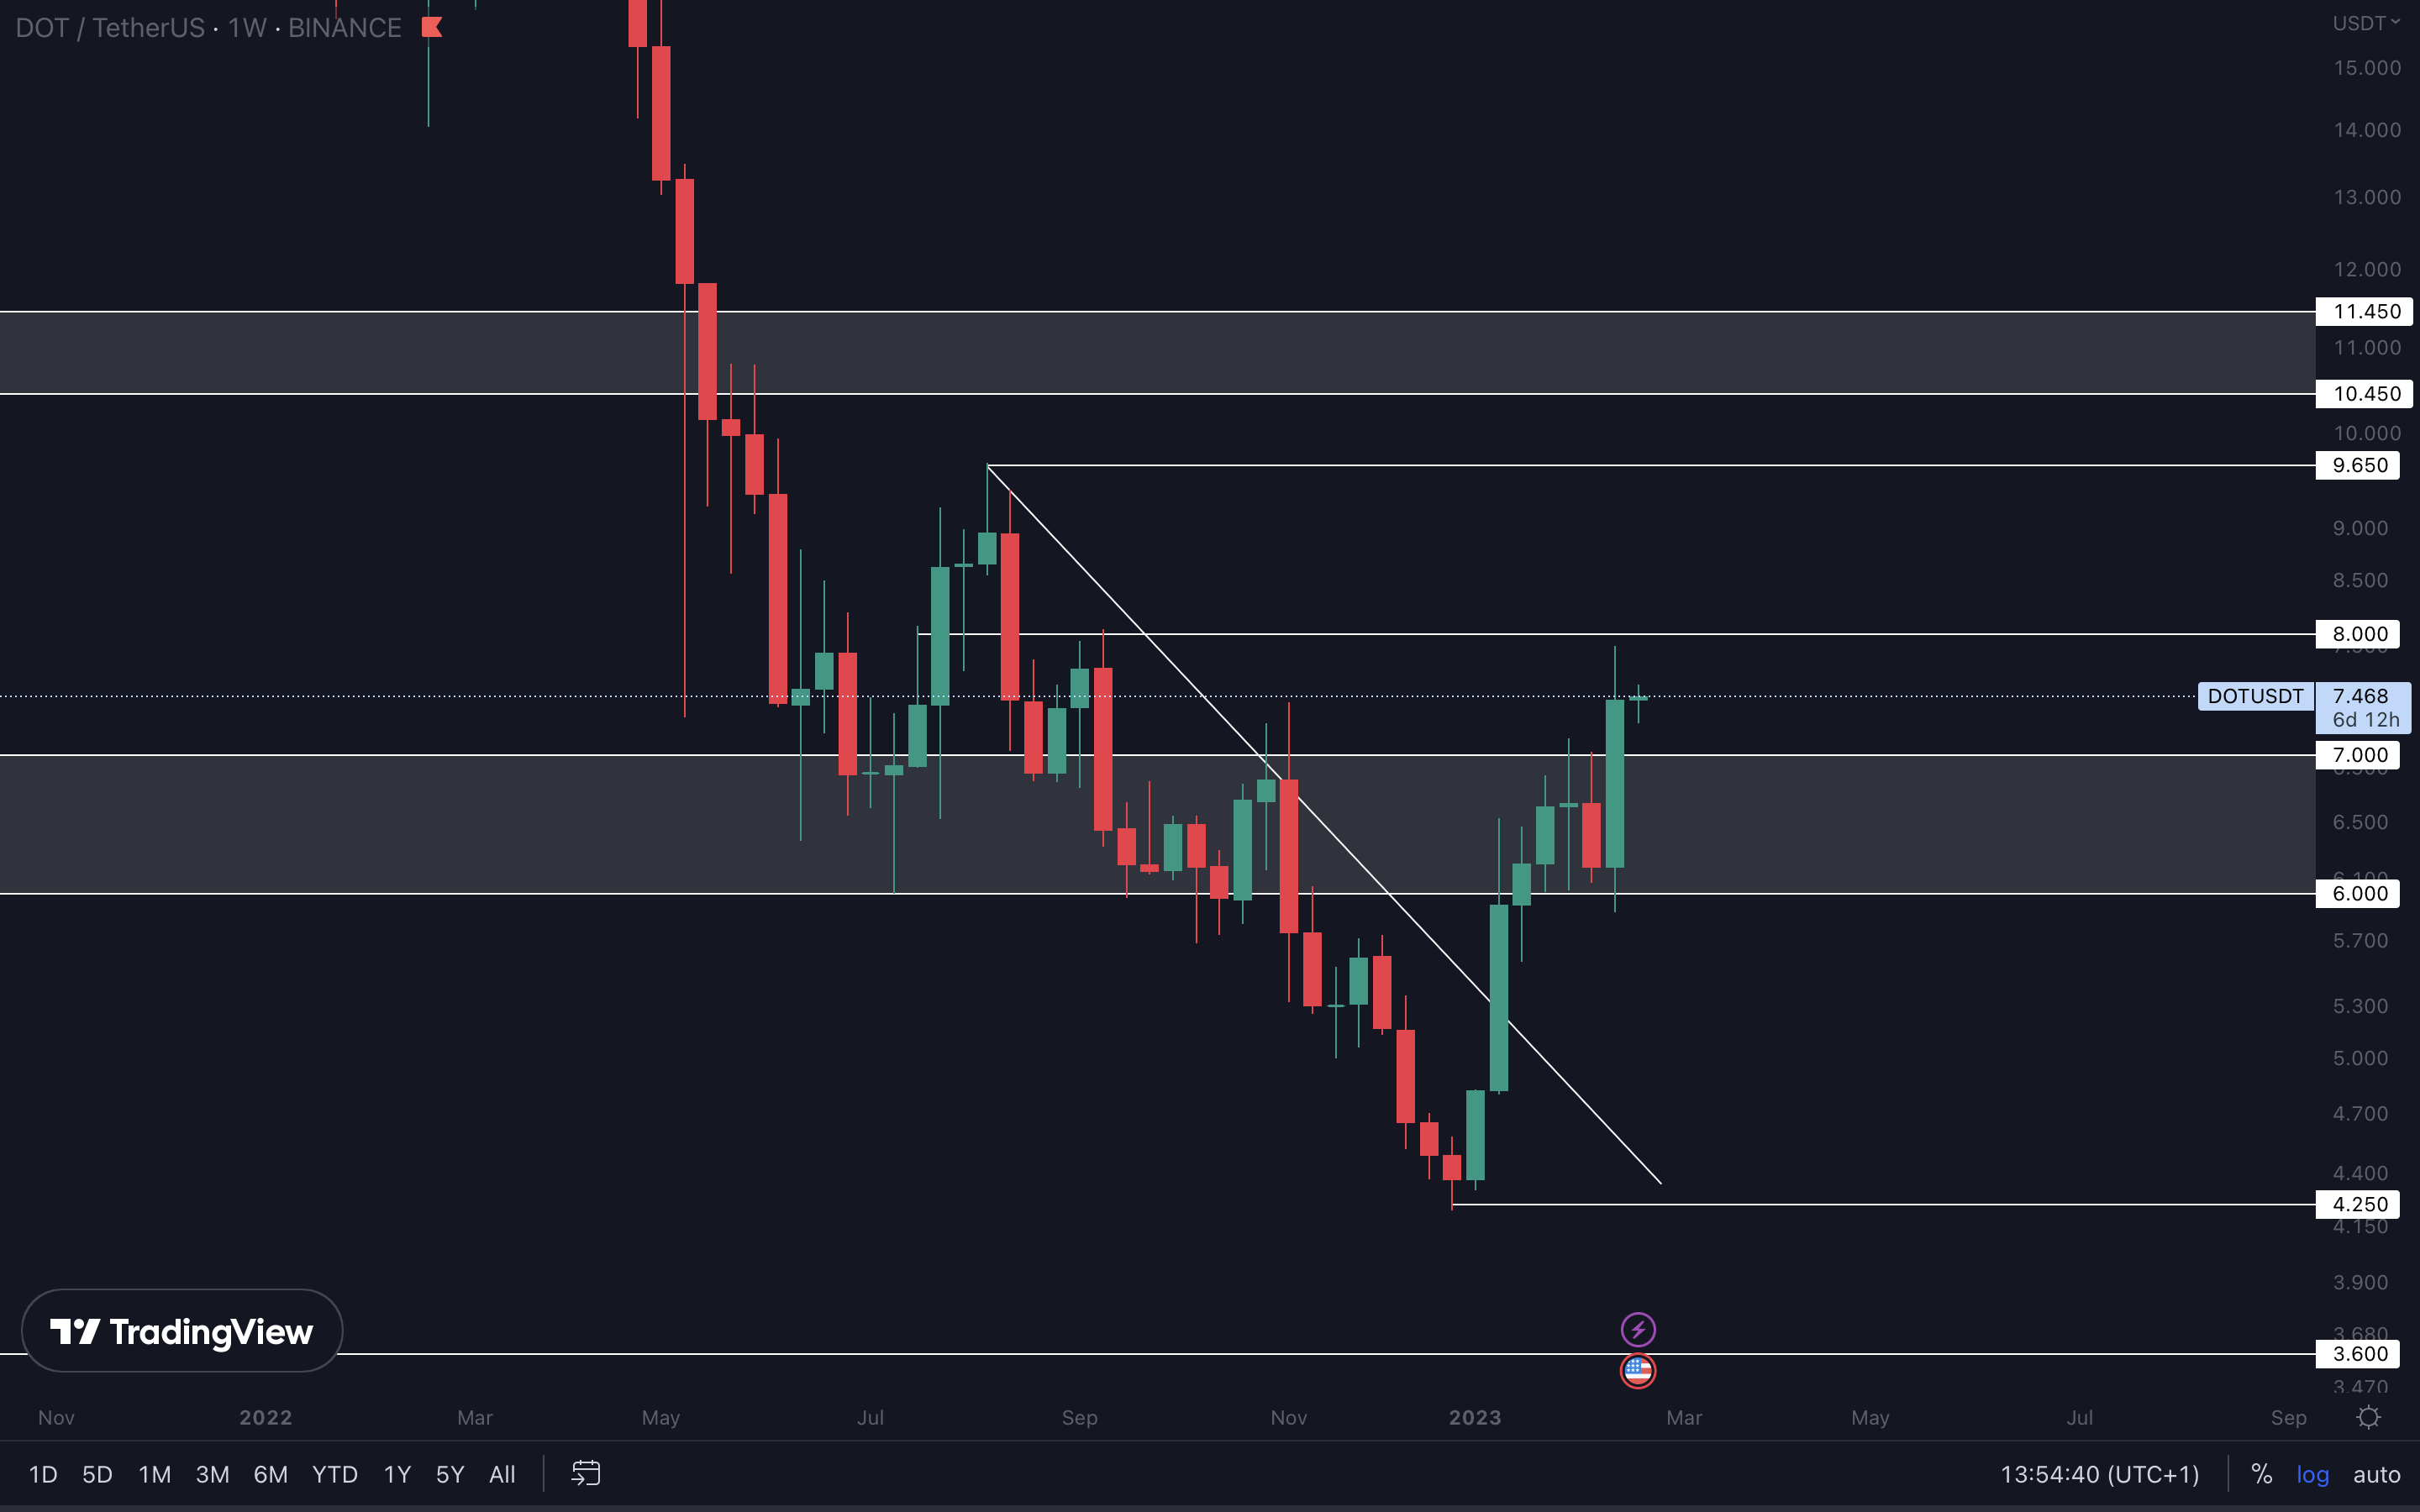
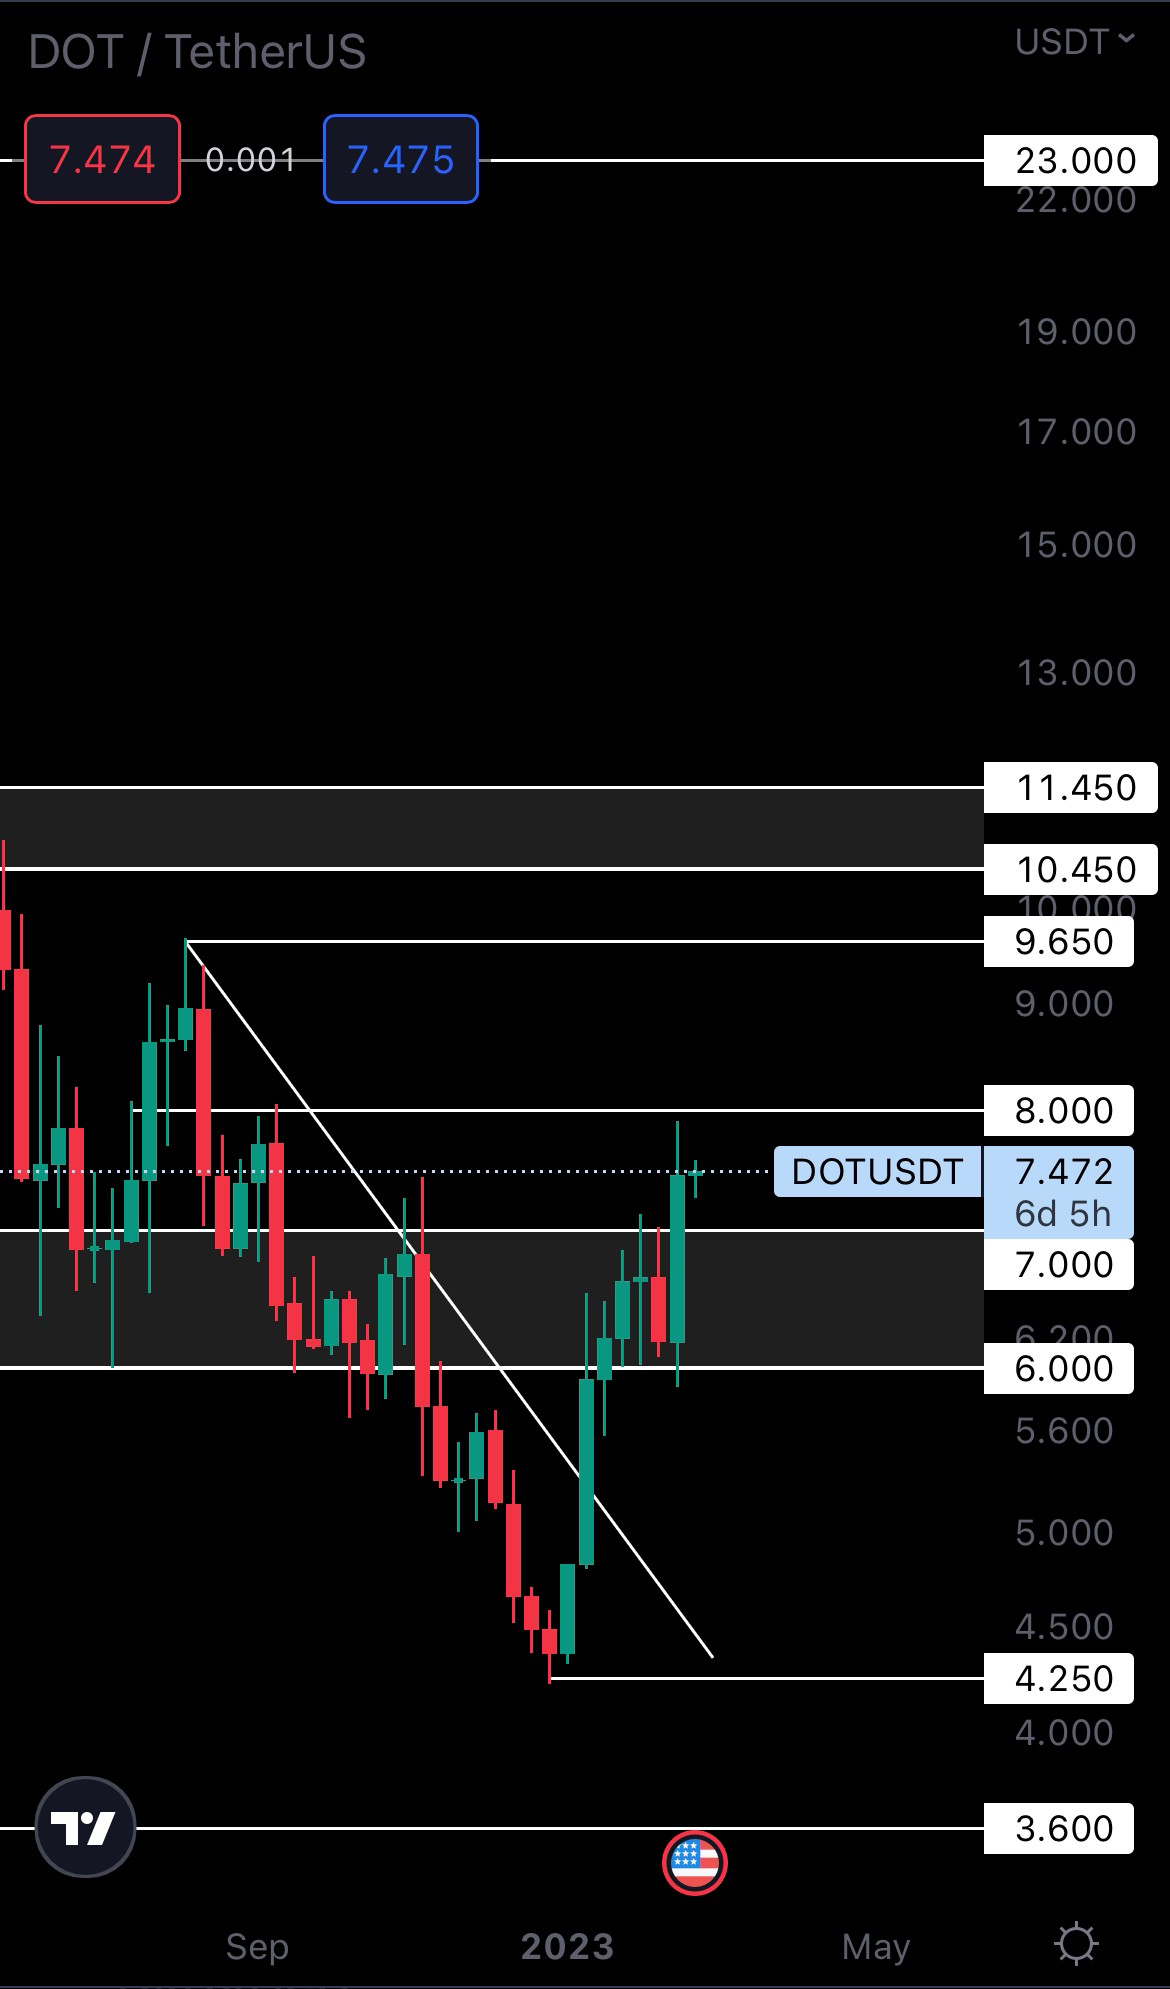
After weeks of ranging inside the $6 - $7 area, DOT finally broke out and had almost tested $8 as resistance. For further upside to continue, $8 needs to be reclaimed on either the daily or weekly timeframes, which will open the door for $9.65. Given how the rest of the market is looking, this scenario is likely.
SYN | Synapse
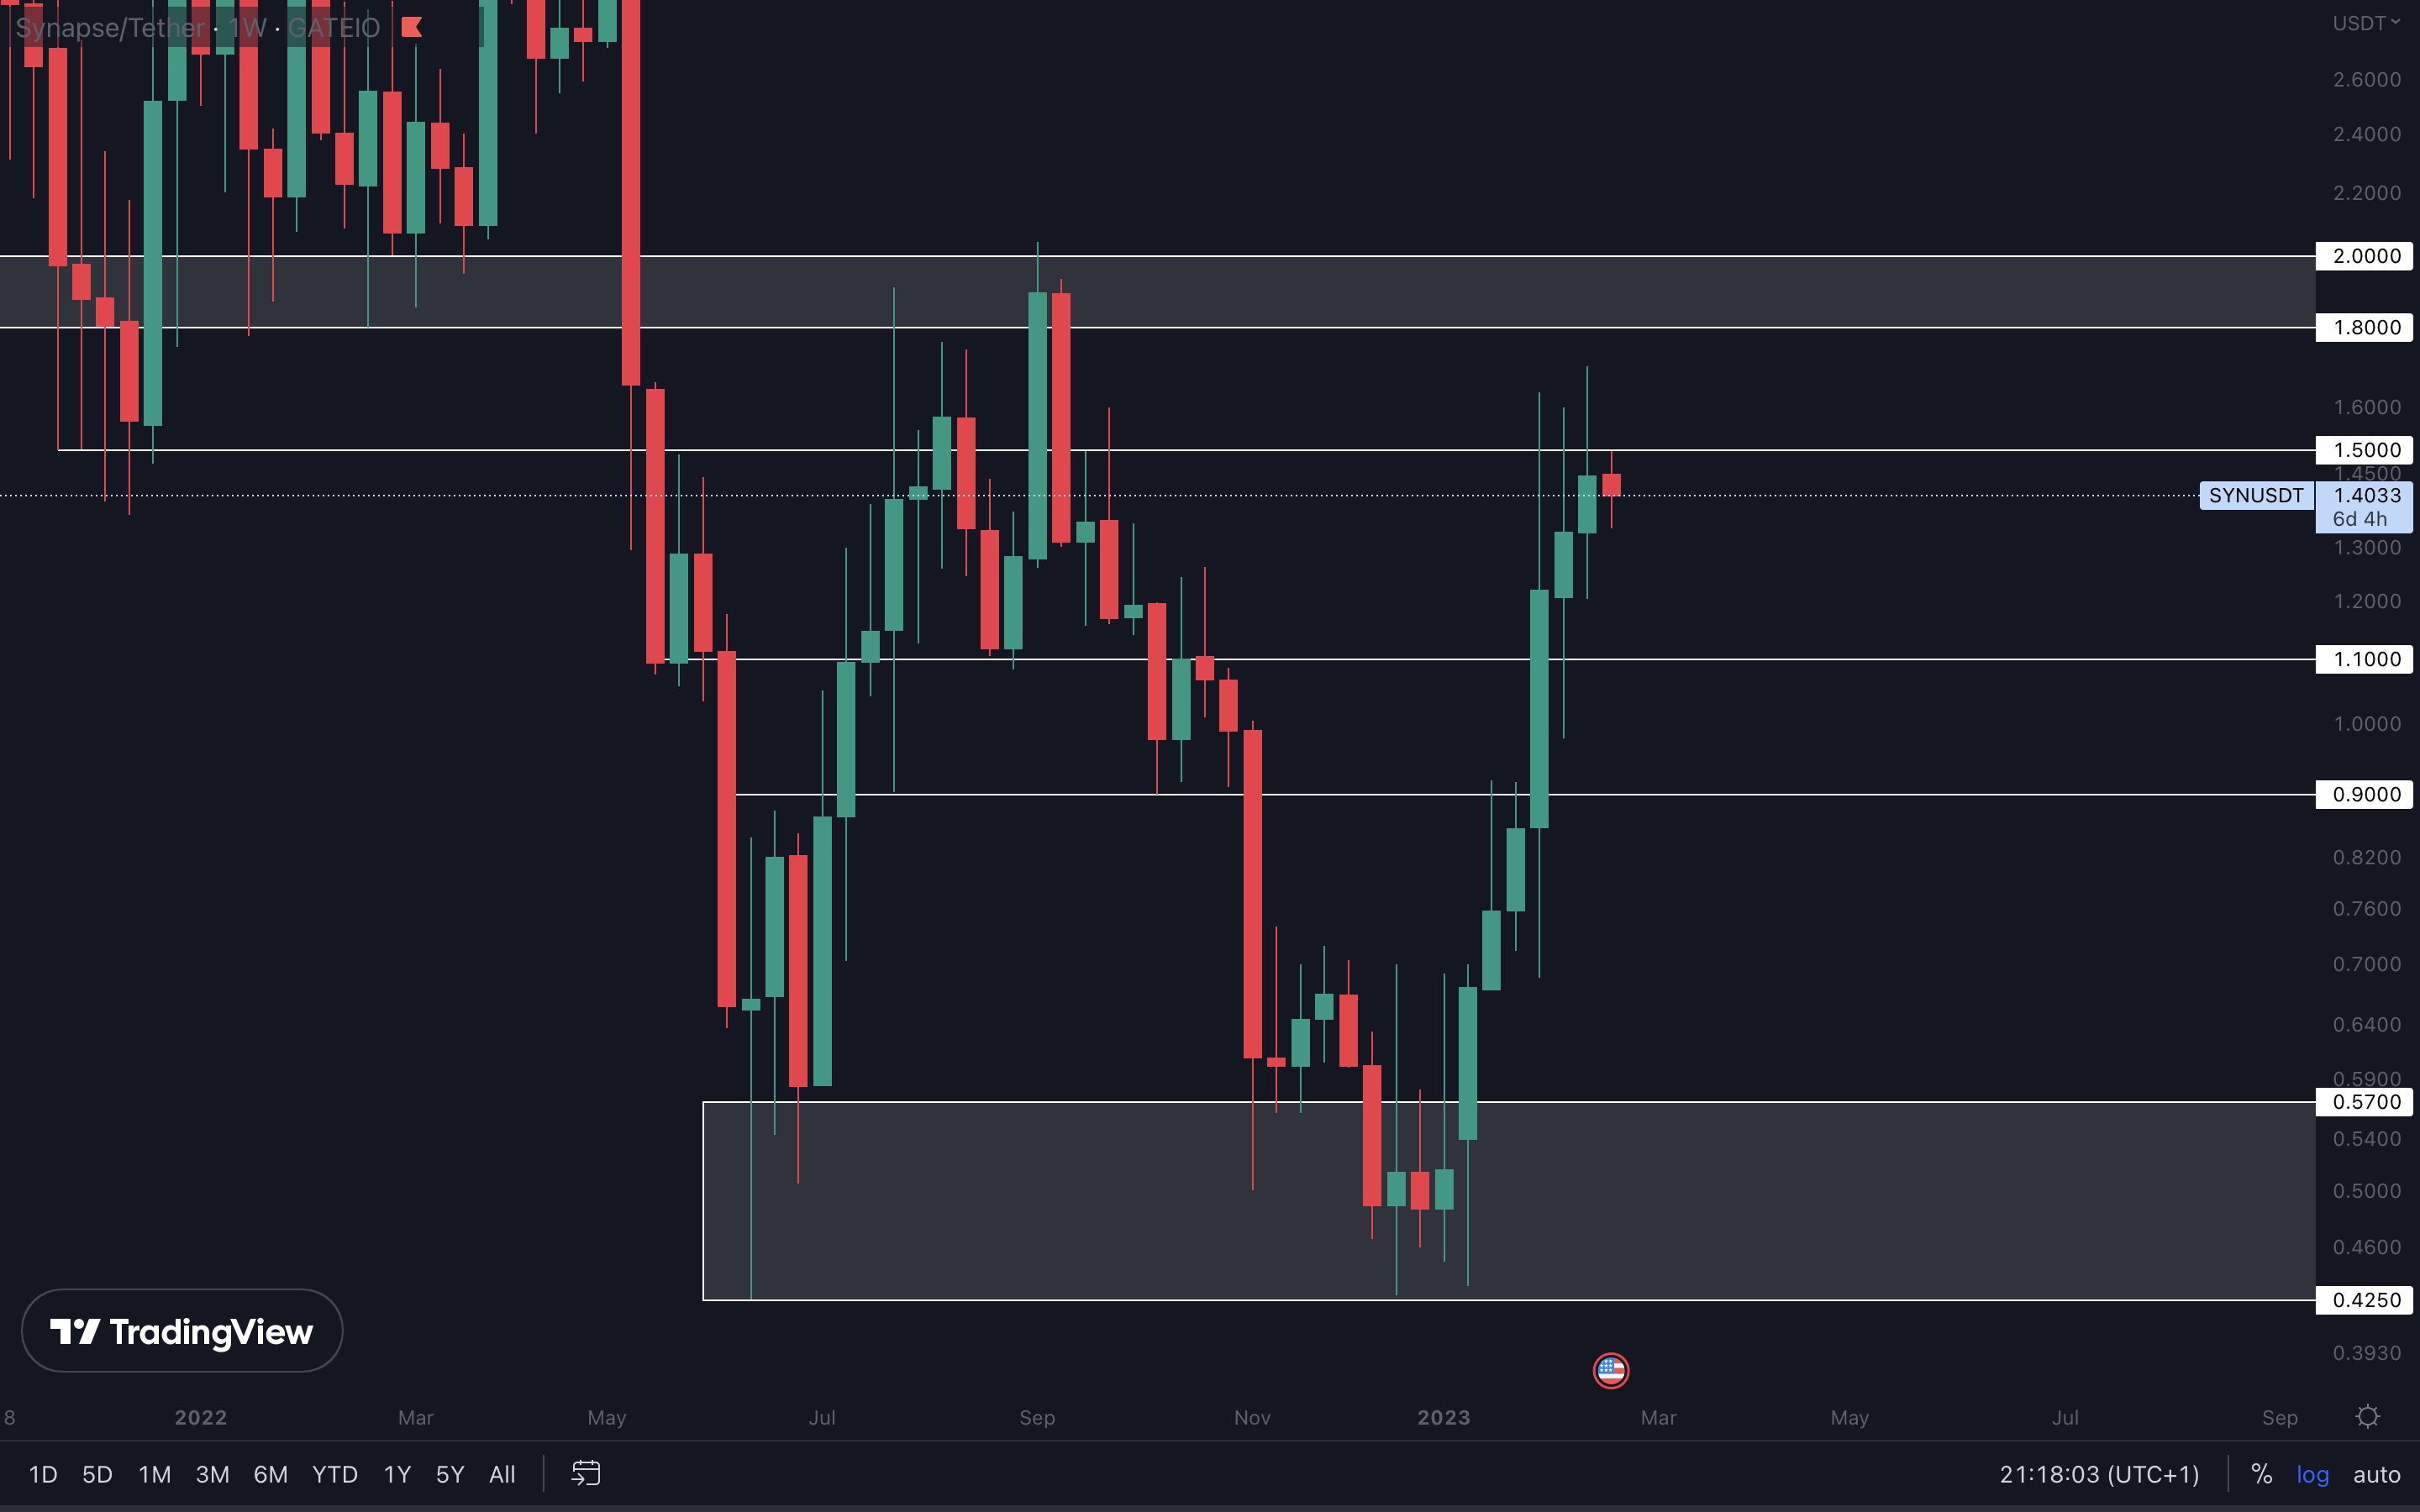
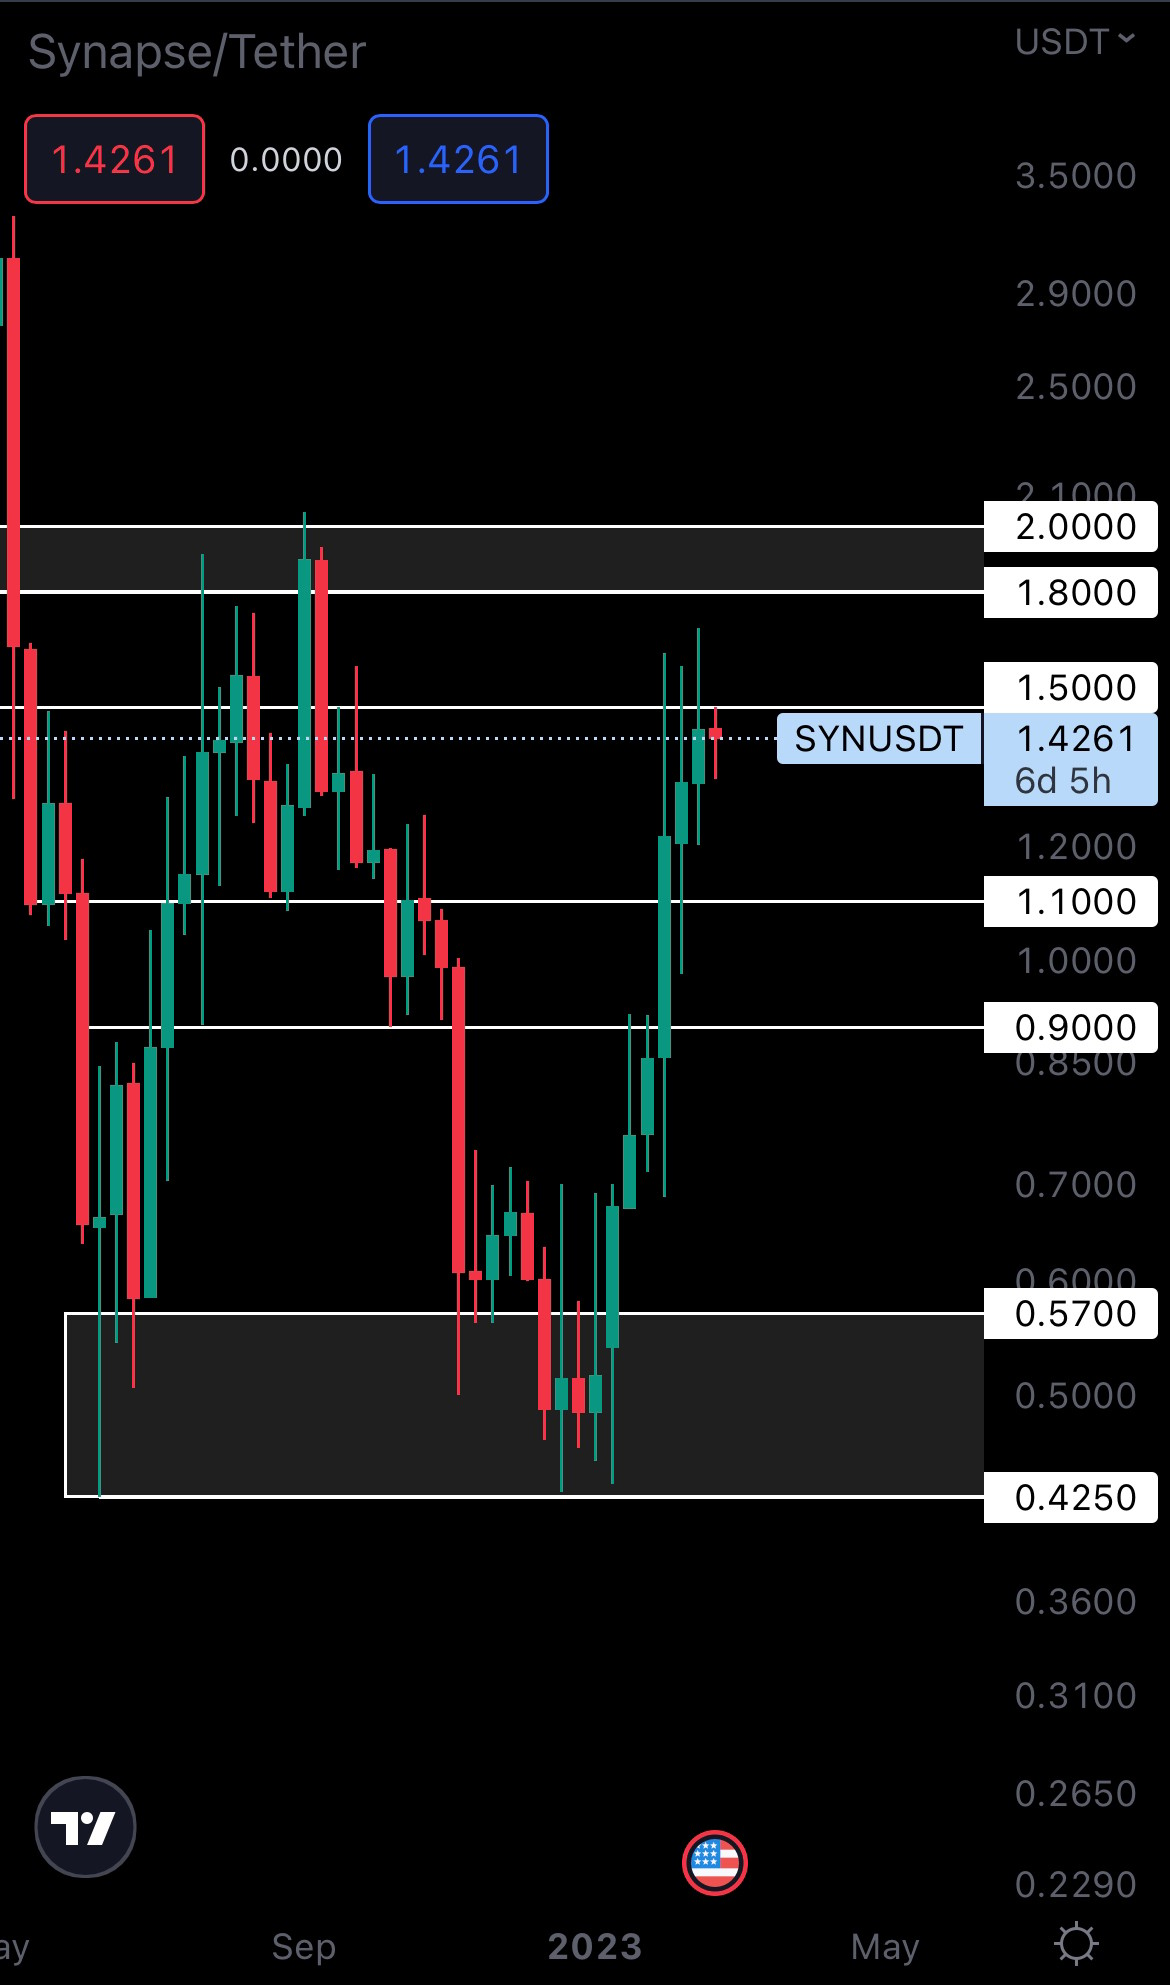
Although SYN has had a great run, and even more upside is likely, the asset encountered trouble at the $1.50 resistance level. We can see that in the past three weeks, there have been multiple failed attempts at breaking this level (check the wicks). If/Once $1.50 is reclaimed, we should focus on the $1.80 - $2 resistance area. Remember that as long as SYN stays under $1.50 there is a risk of rejection, so we wouldn’t recommend jumping on this just yet.
OP | Optimism
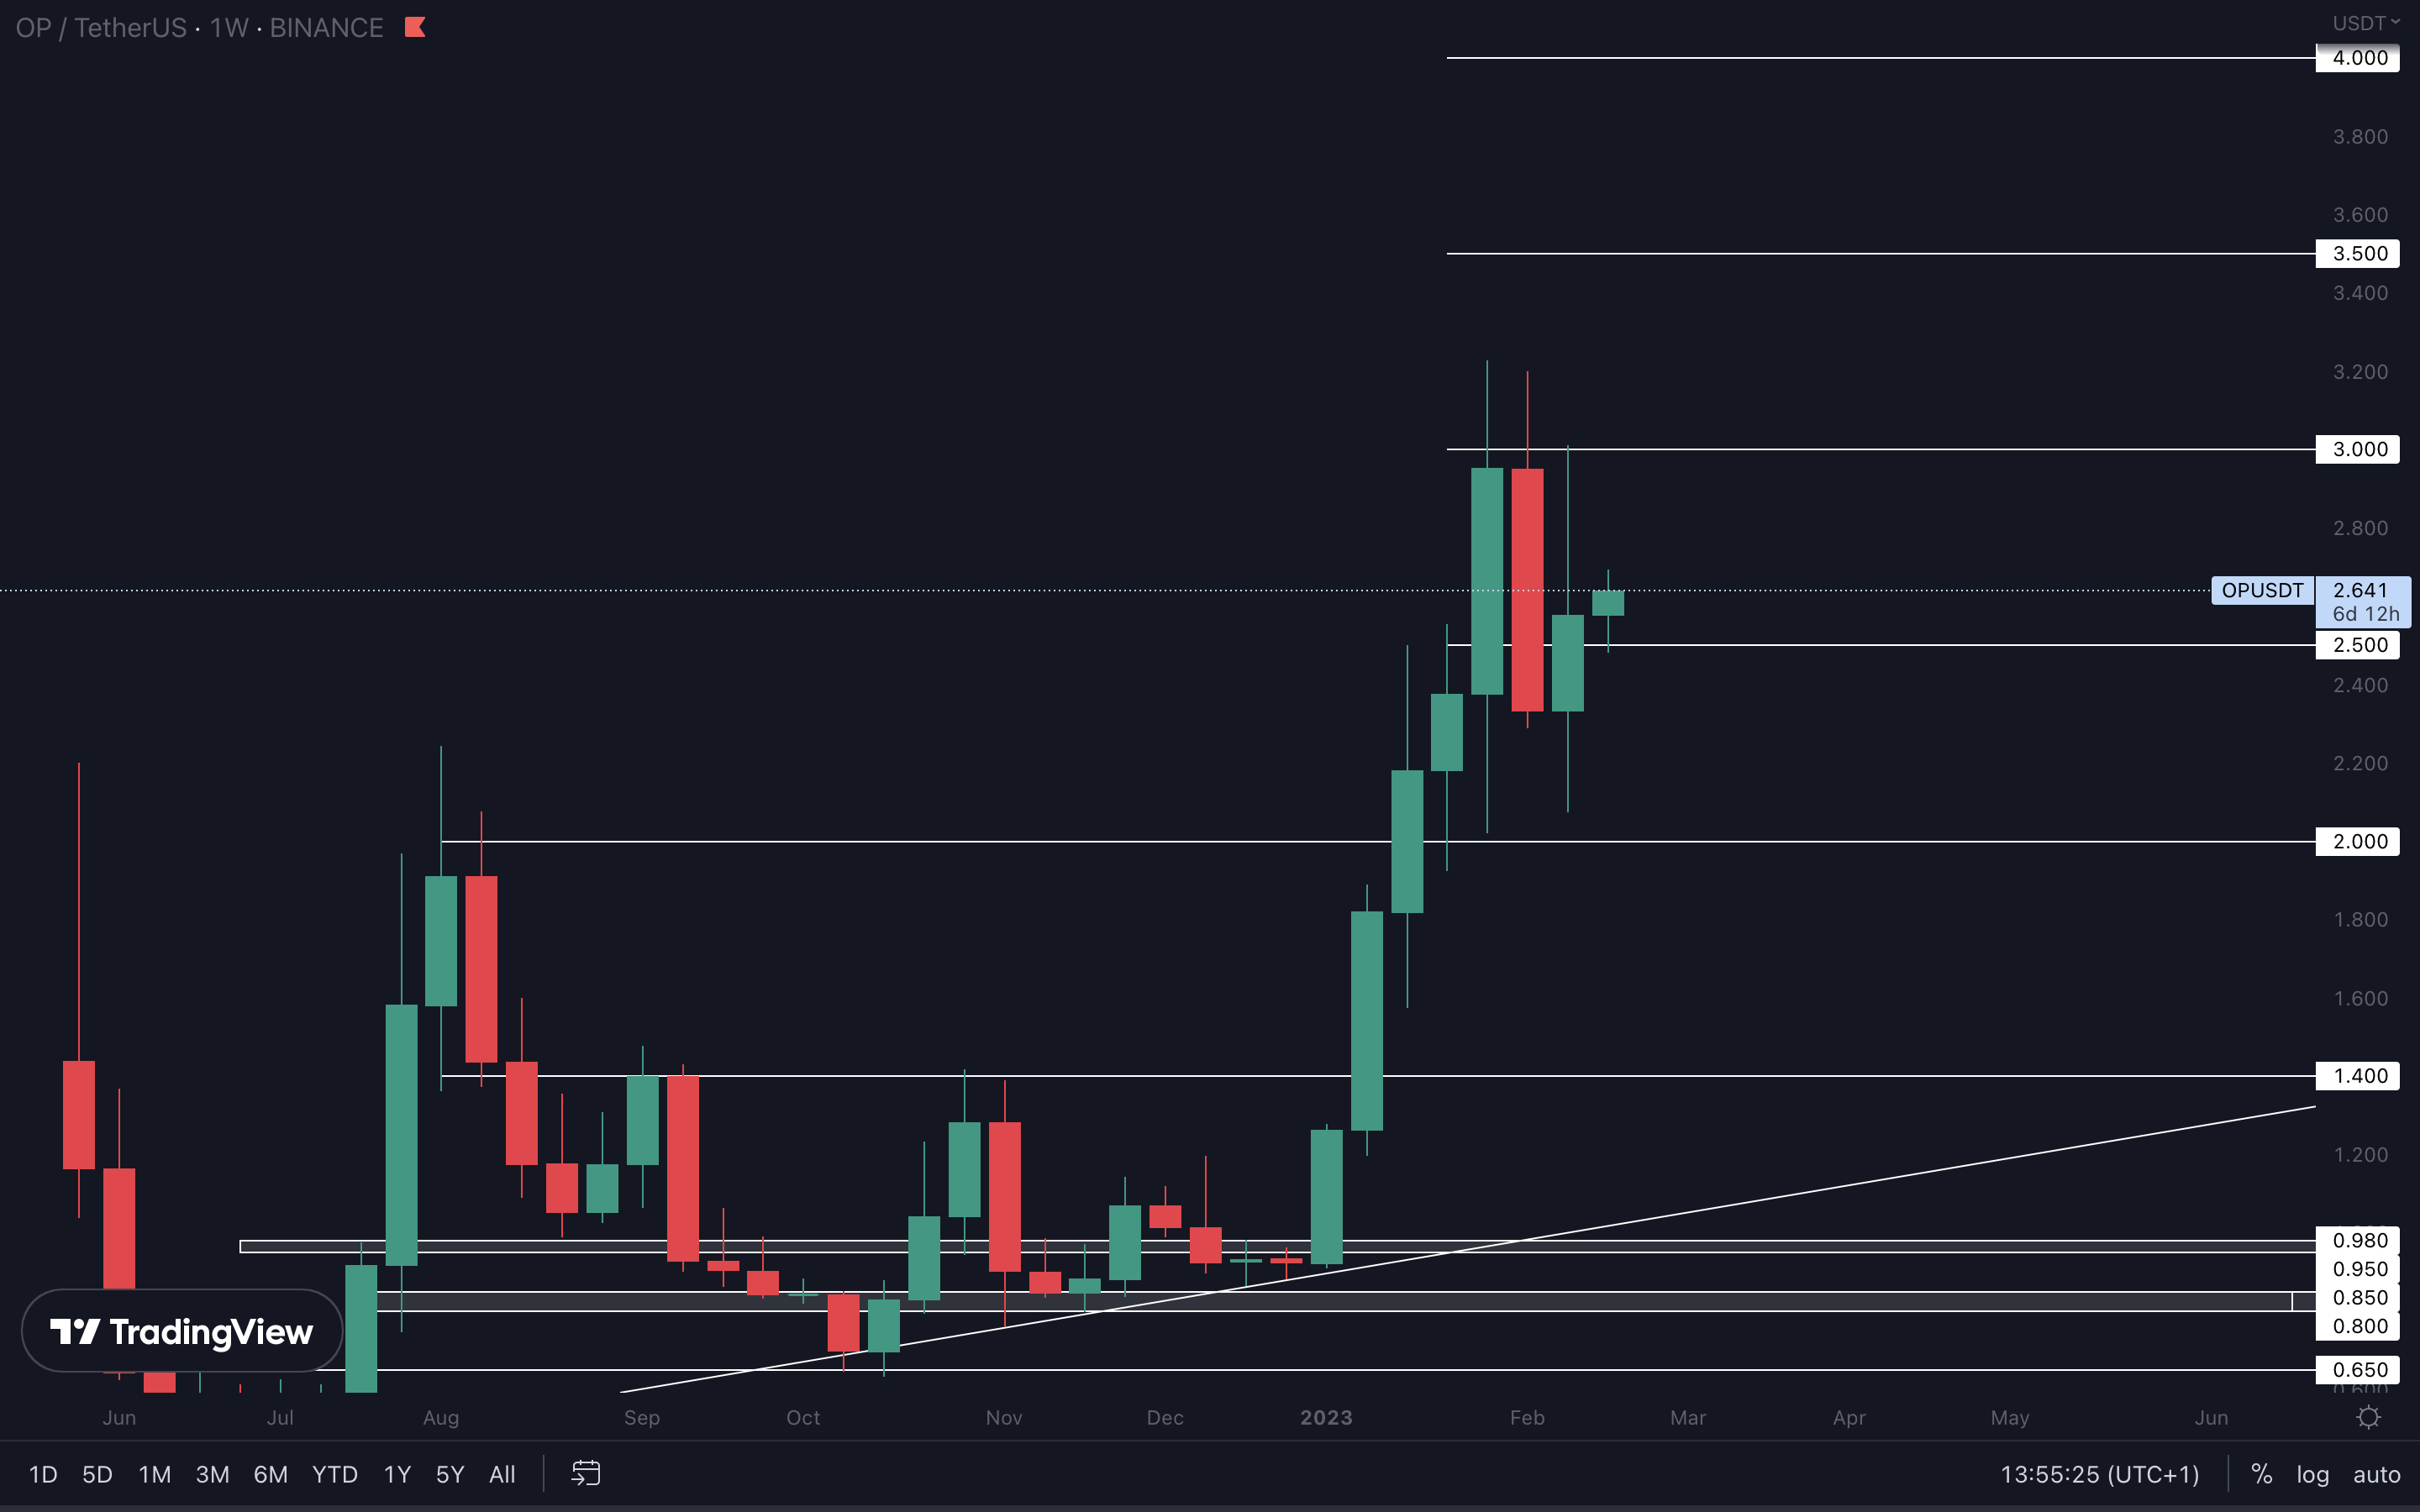
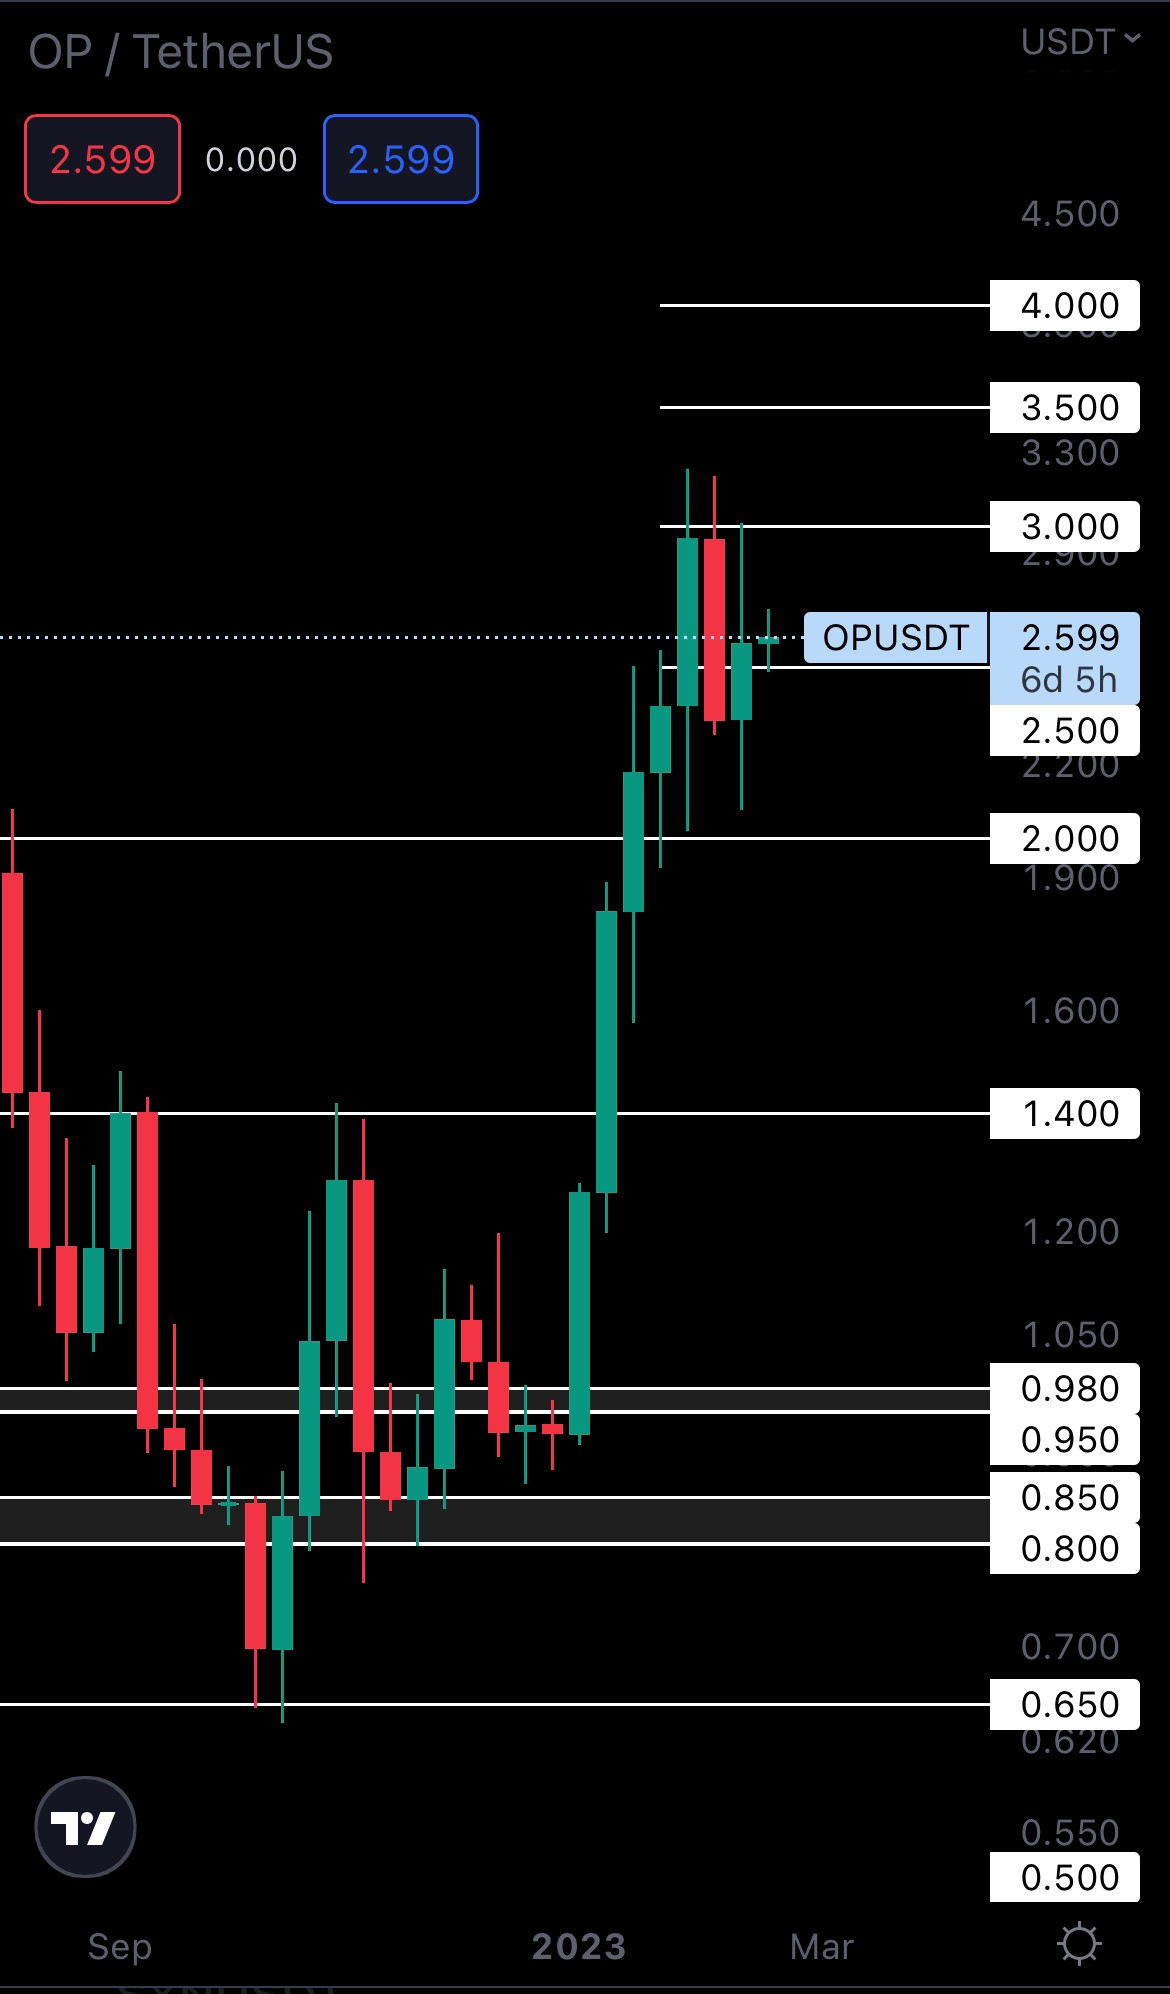
The bearish engulfing candle from two weeks ago has been invalidate after last week’s candle closure above resistance ($2.50). From a technical standpoint and in confluence with the market, OP is now headed for $3 unless $2.50 is lost again.
LDO | Lido DAO

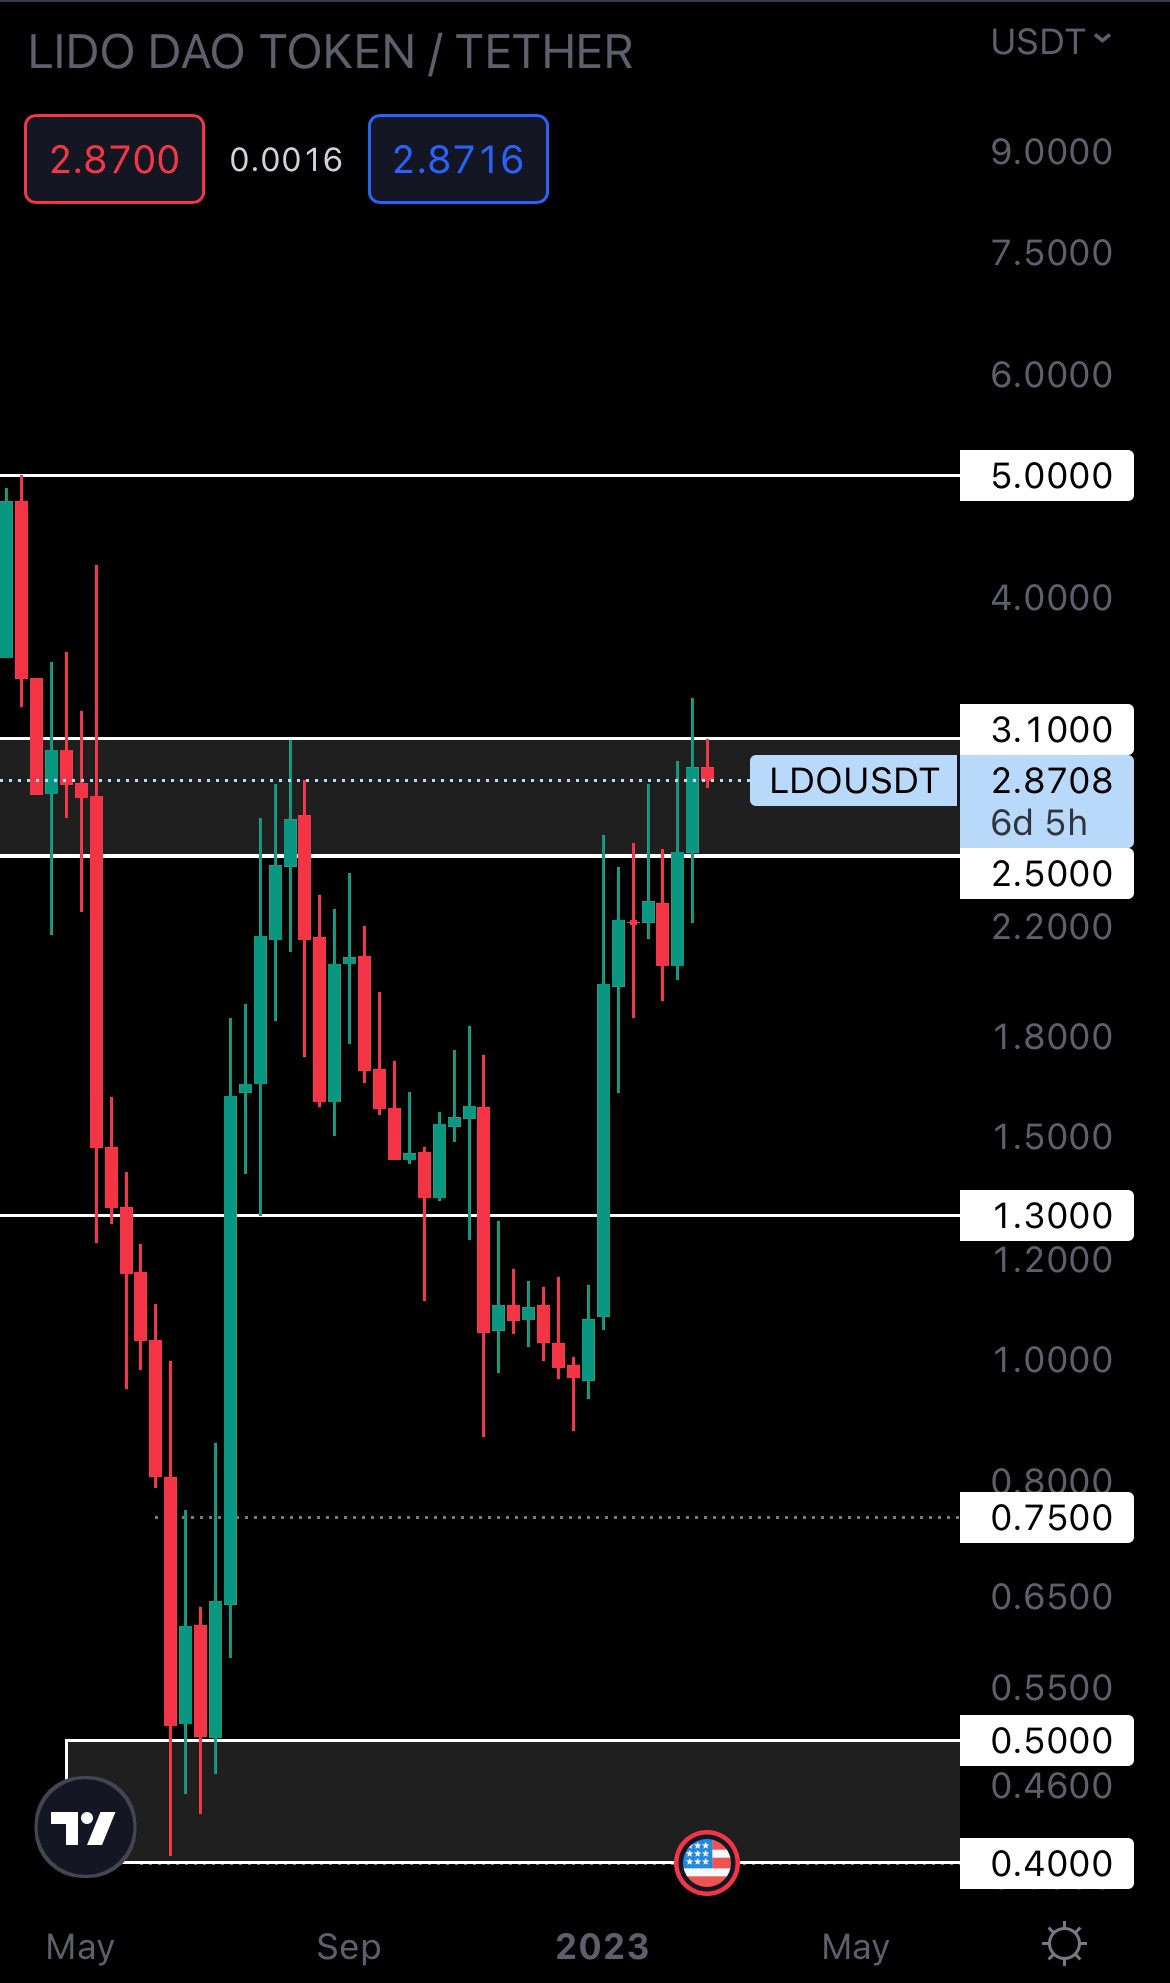 Last week marked the first time in 11 months when LDO rose above $3.10. Although this is a bullish signal, we need to see the asset closing a weekly candle above $3.10 to properly confirm further upside.
Therefore, we recommend waiting for $3.10 to be reclaimed before considering this as an option.
HEGIC | Hegic
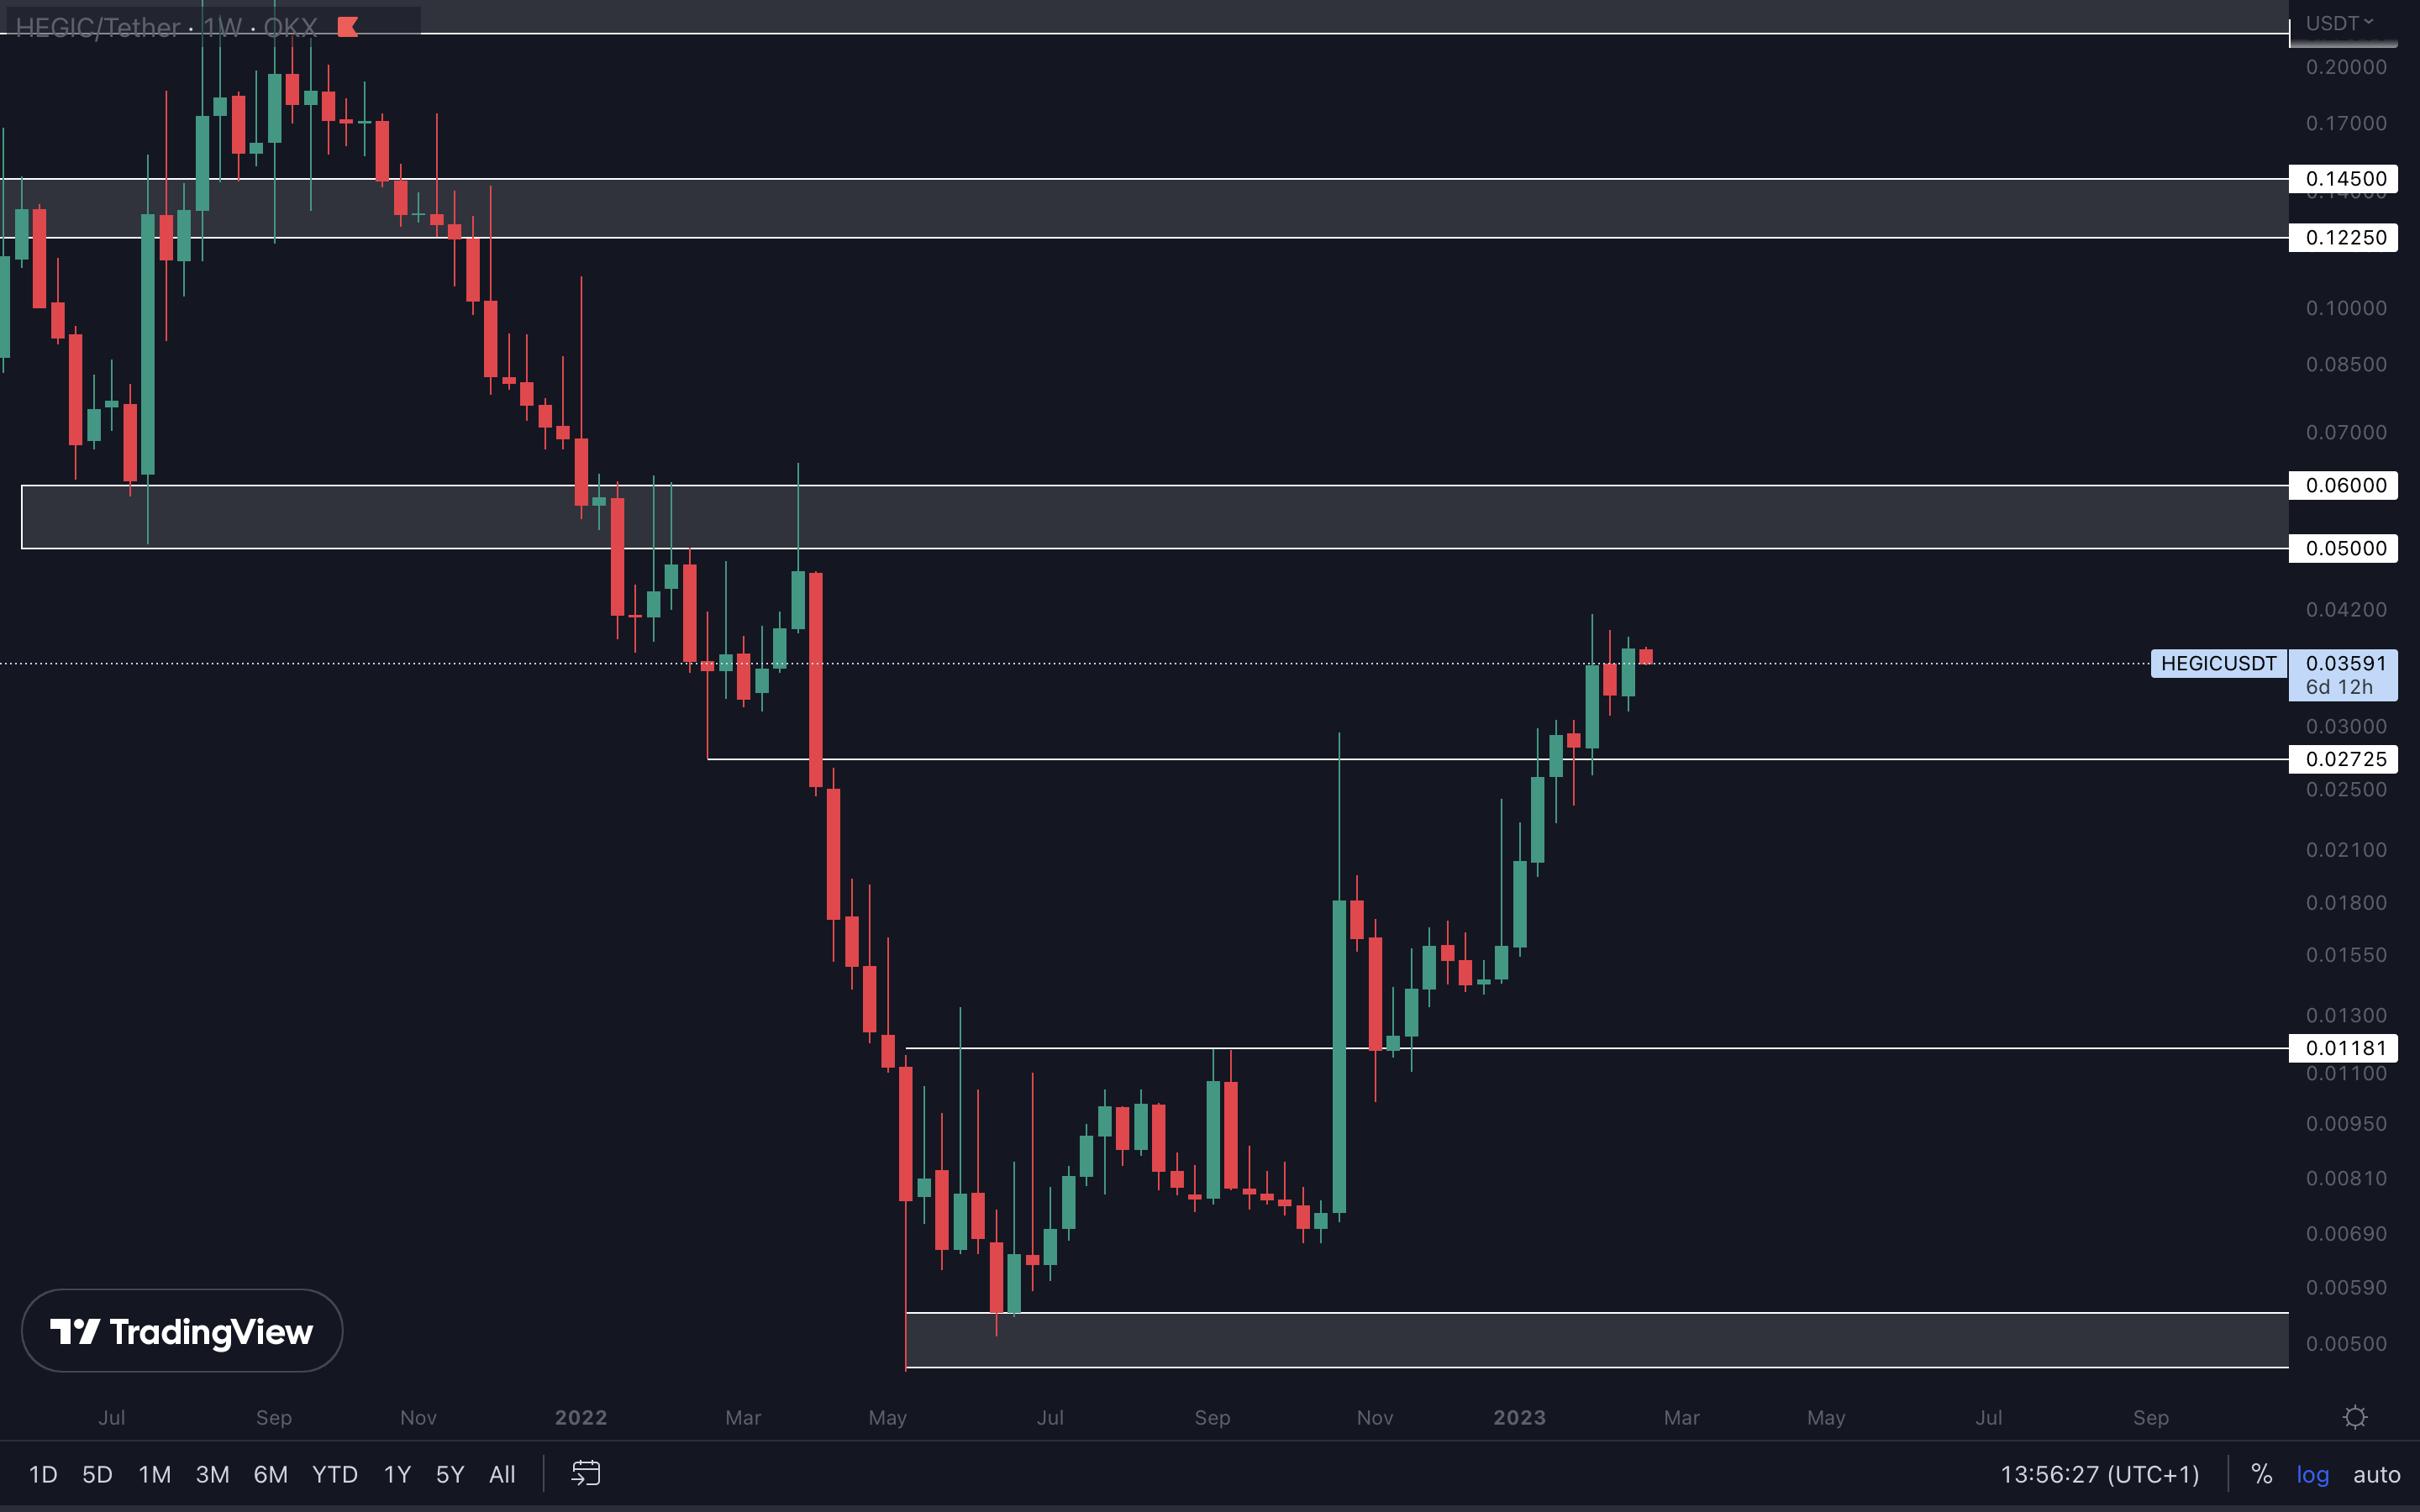
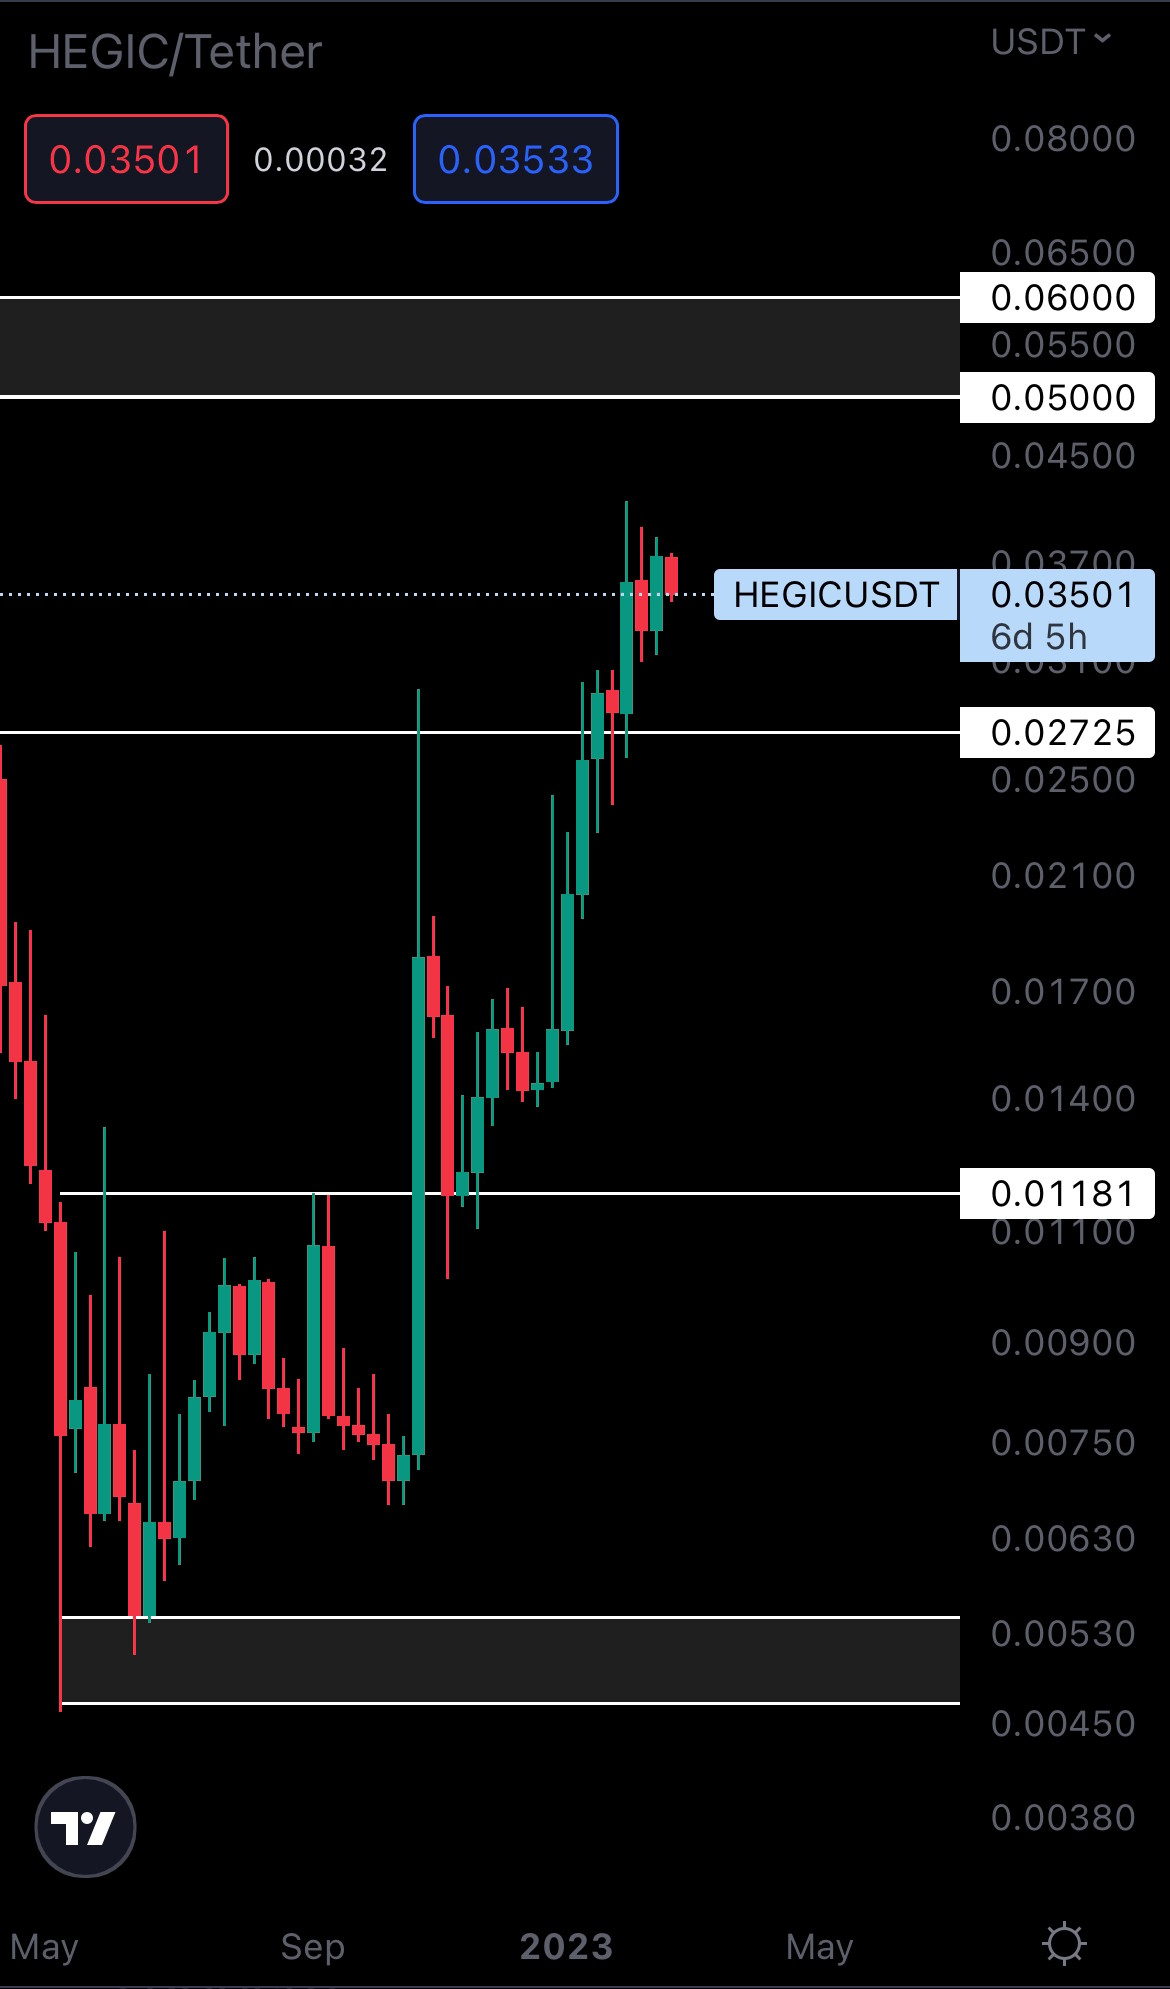
HEGIC’s weekly market structure is bullish, the trend is healthy, and buyers remained in control even until now, as the asset closed last week’s candle as a bullish engulfing. Therefore, HEGIC will continue rising toward the $0.05 - $0.06 resistance area in the coming weeks. However, that doesn’t necessarily make it a good opportunity now. If you haven’t entered HEGIC earlier, there’s no point in doing so now. Compared to previous entries, the R/R (risk/reward ratio) here is not the best, and there are better opportunities to be taken advantage of.
ASTR | Astar
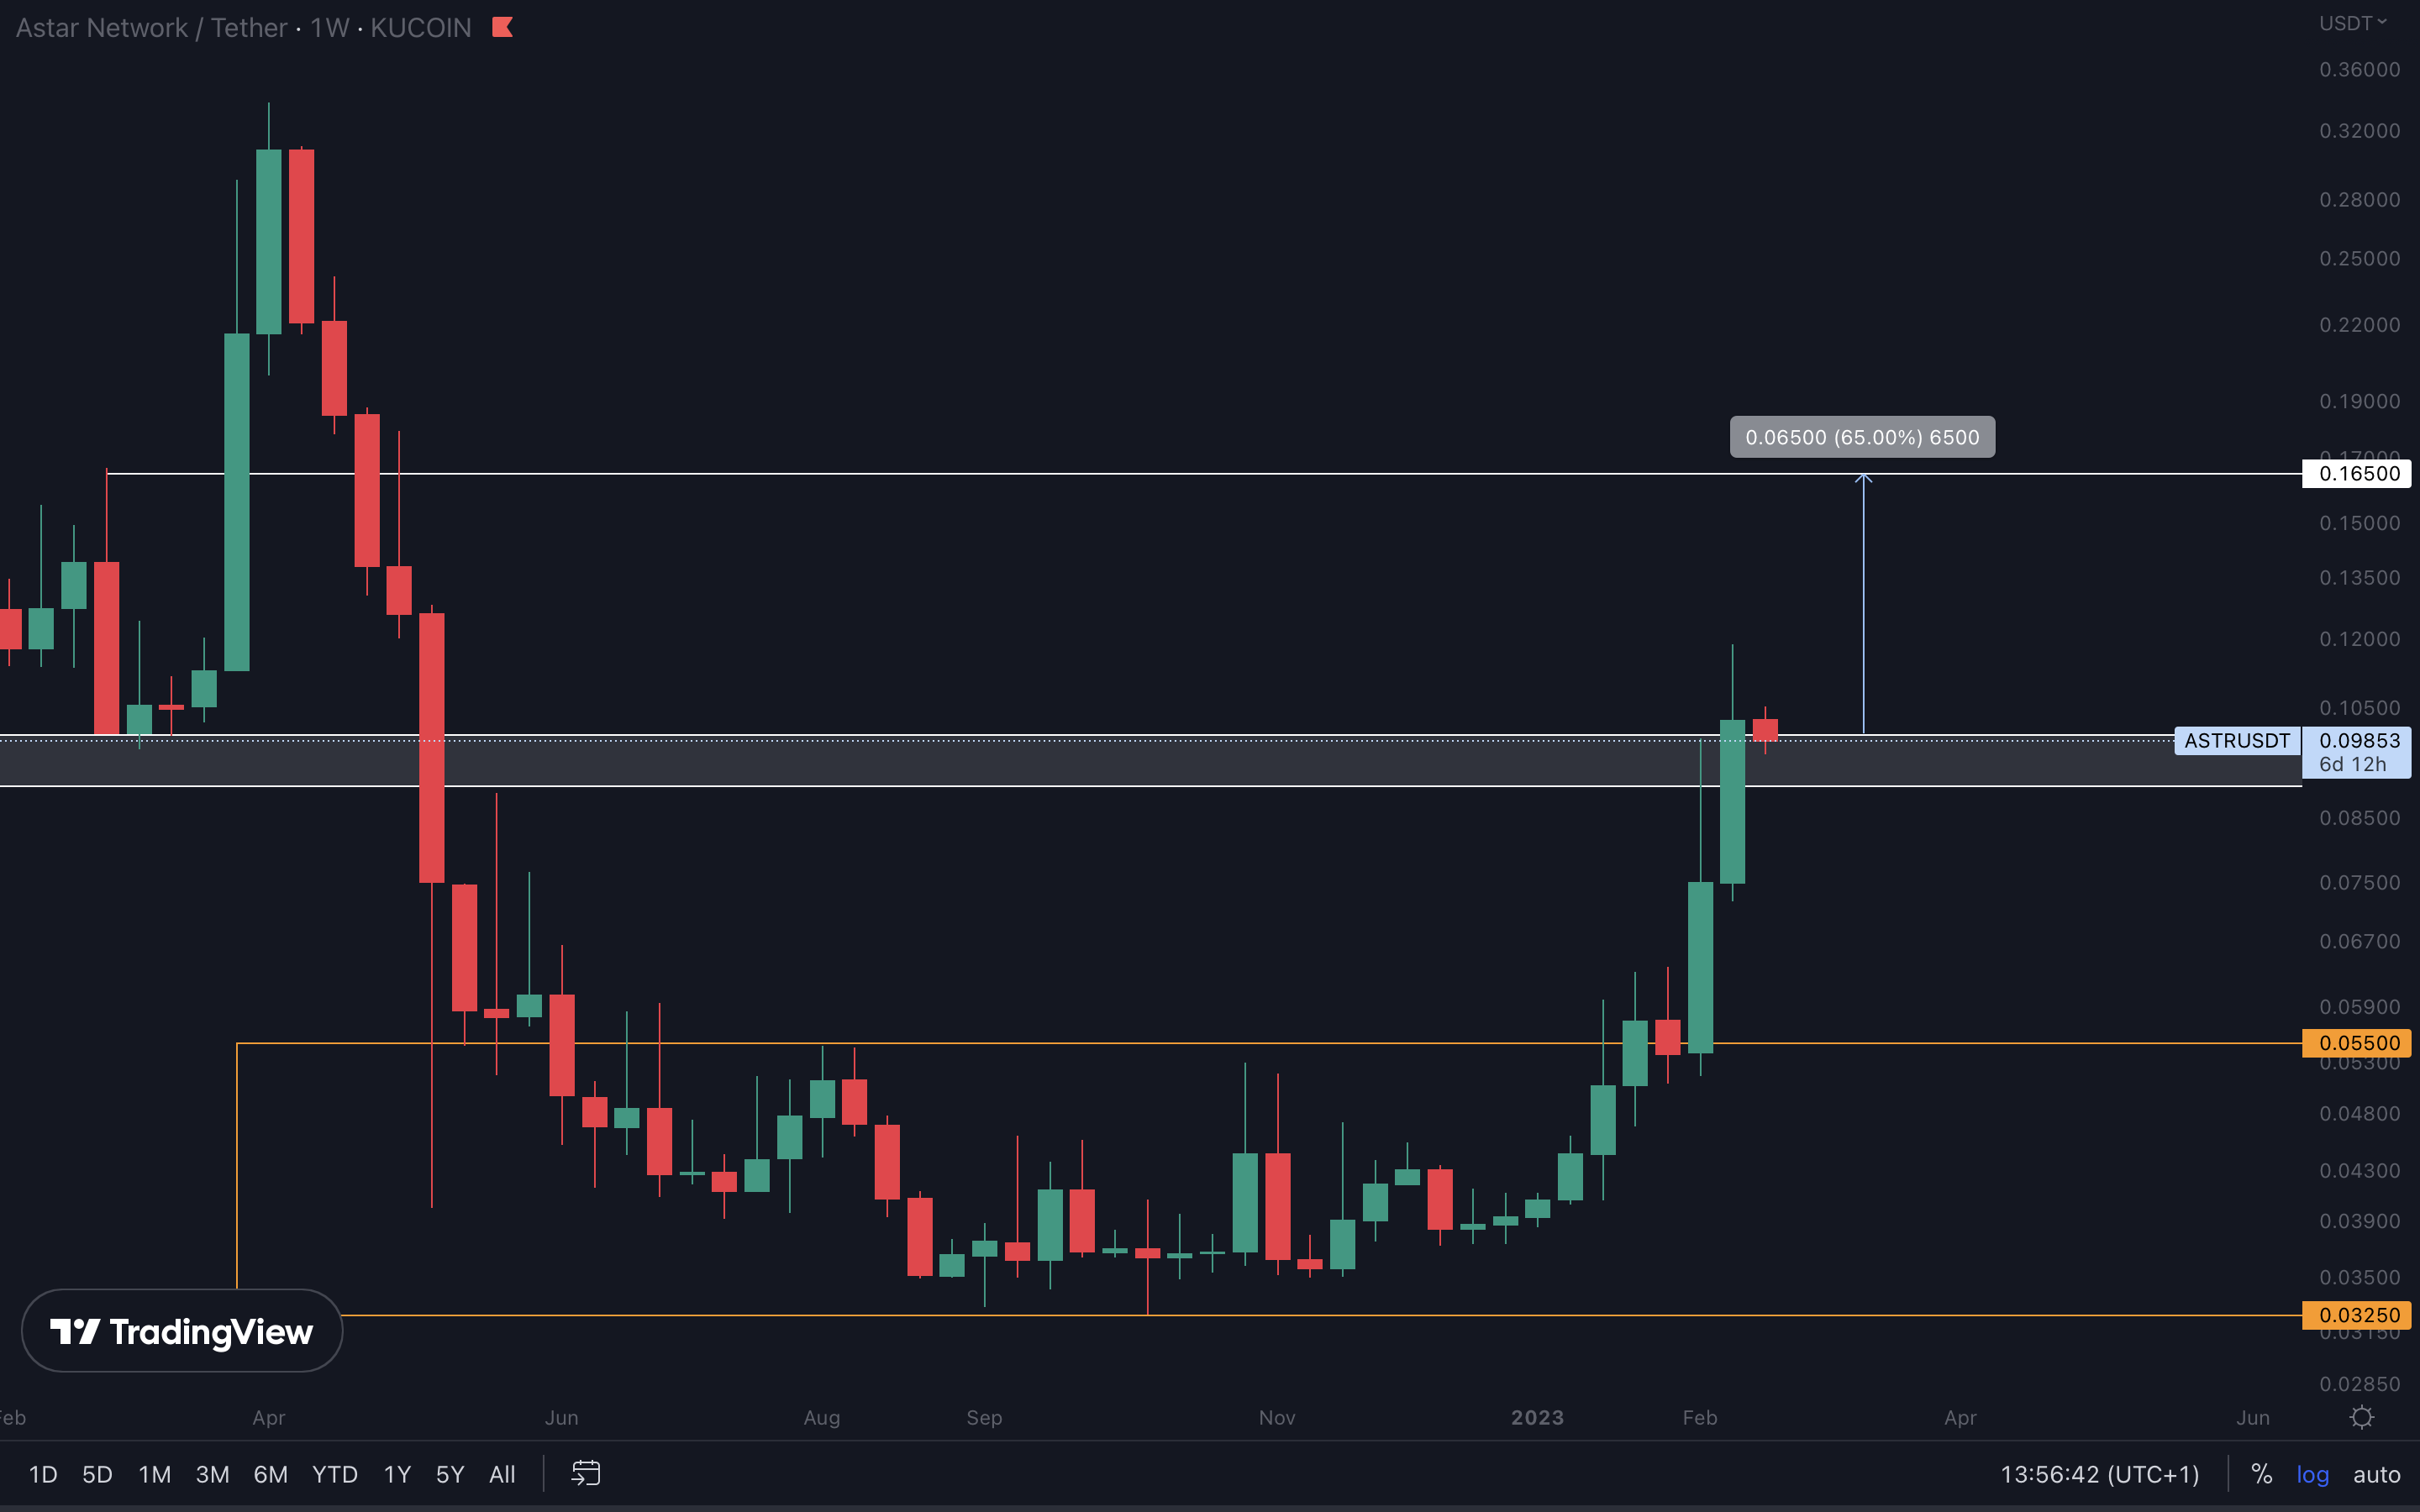
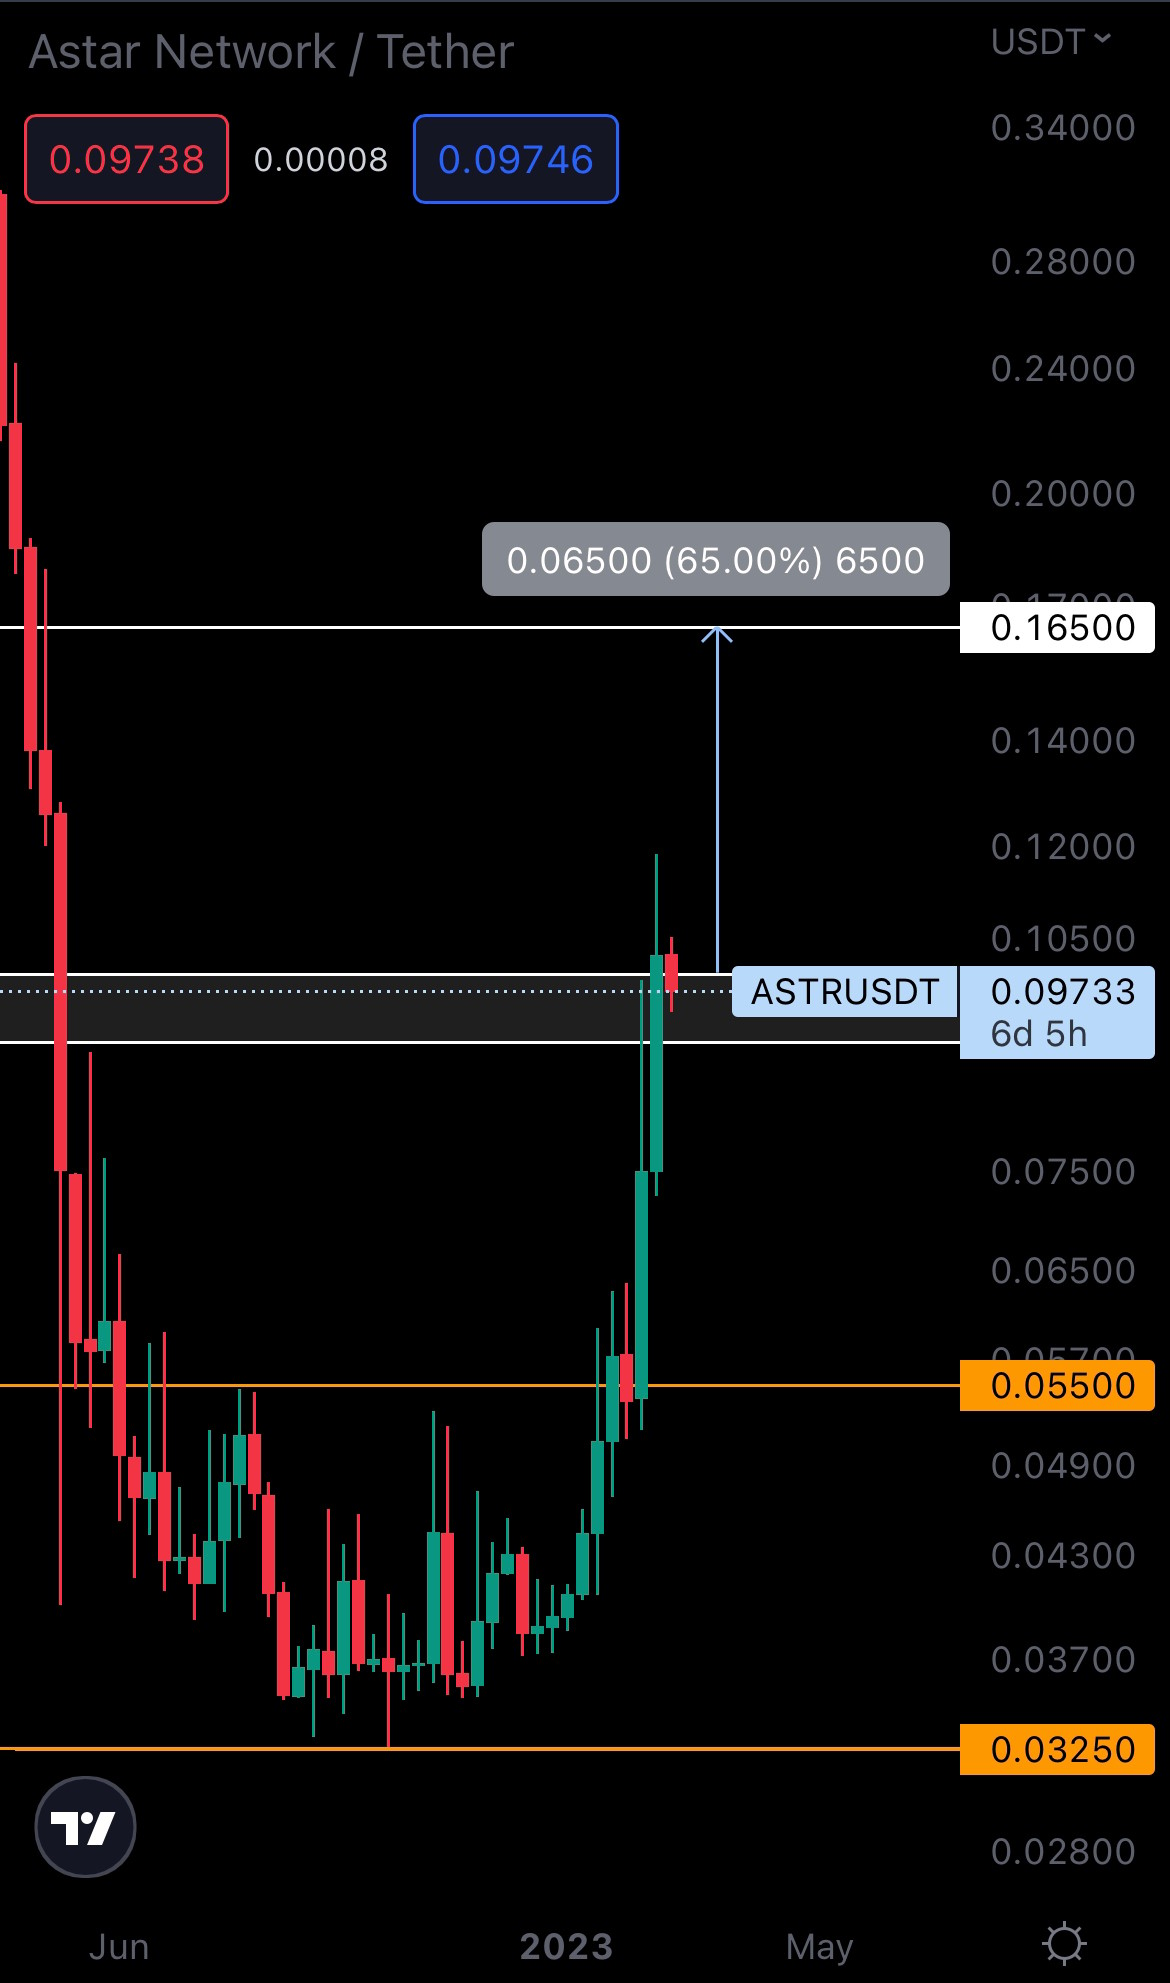
ASTR managed to close a weekly candle above $0.10 last week. Because the $0.09 - $0.10 area (gray box) now acts as support, only a loss of this will invalidate ASTR’s move to its next resistance level of $0.16500.
THOR | THORSwap
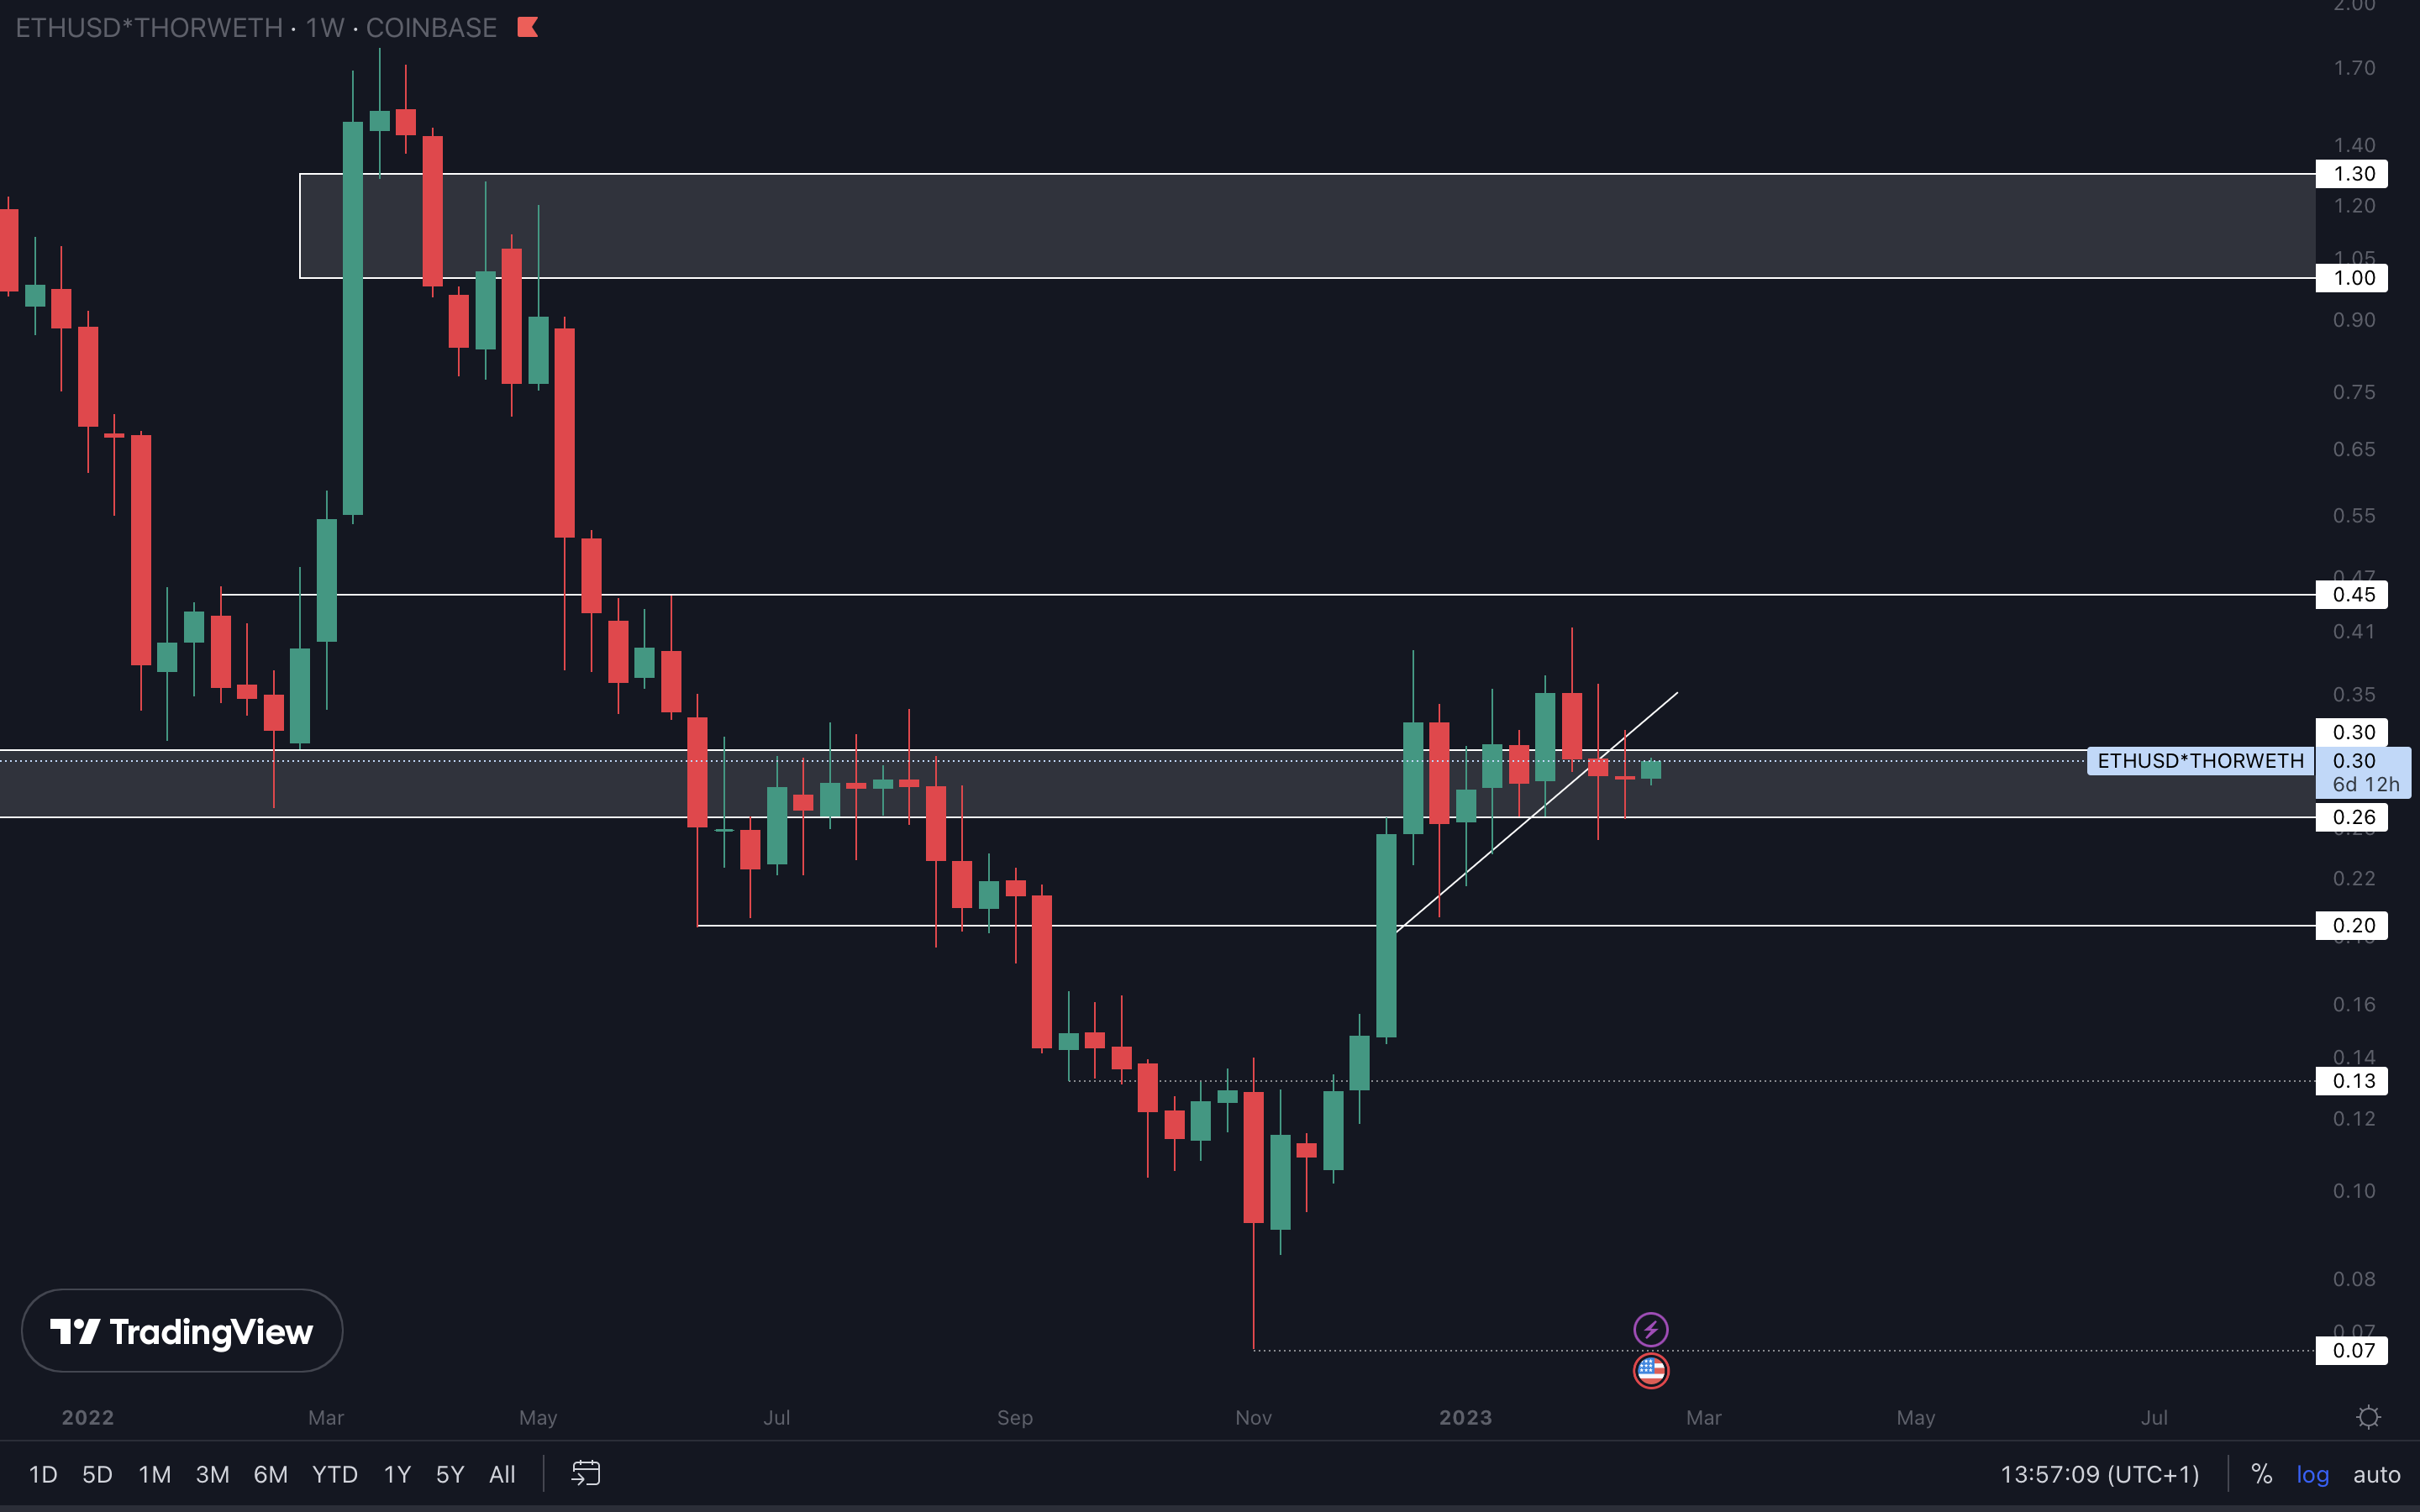
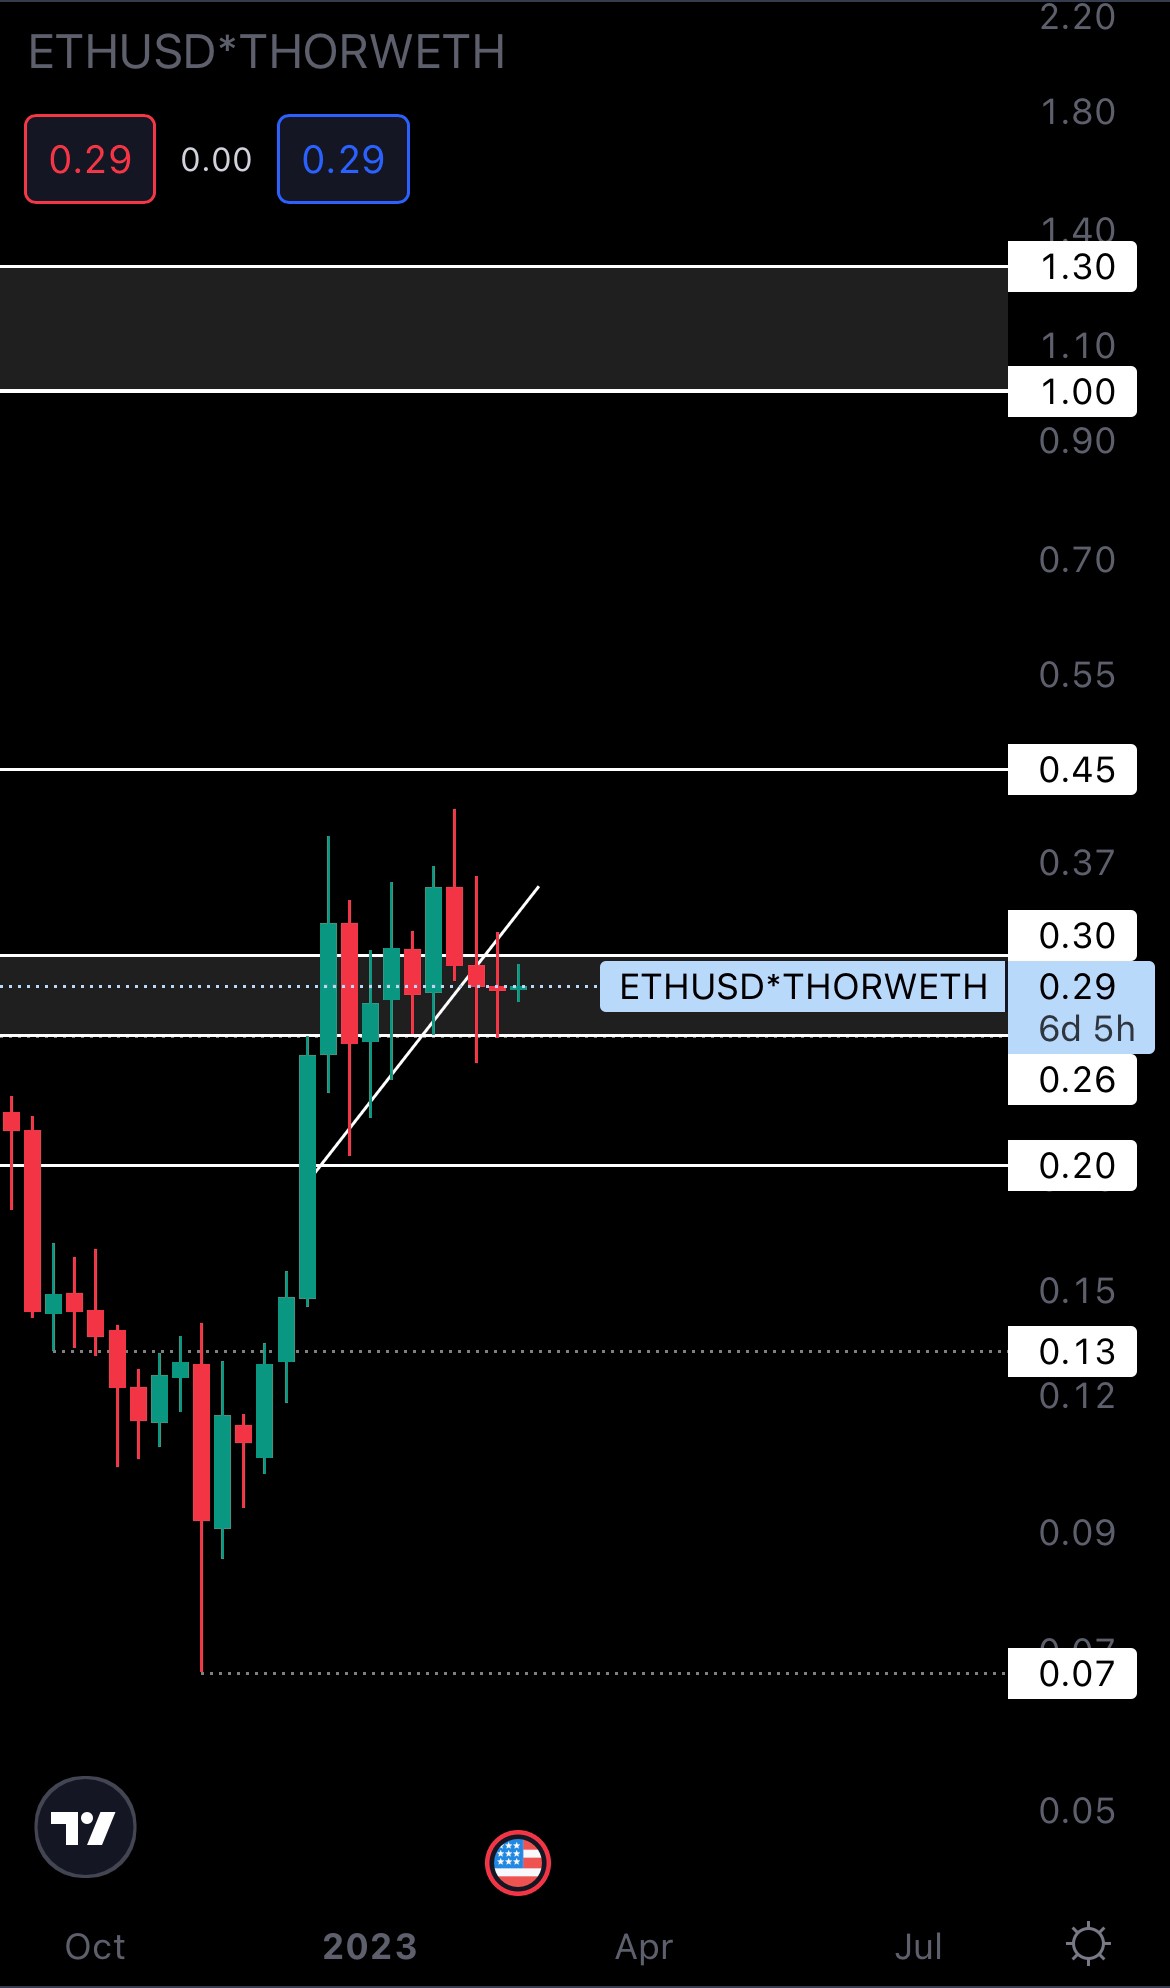
As long as $0.26 isn’t lost (weekly closure under is necessary), the possibility of THOR testing $0.45 in the coming weeks remains on the cards, especially with how the market’s looking. Buying anywhere above $0.26 could be a good play if the rest of the market performs well.
MINA | Mina Protocol
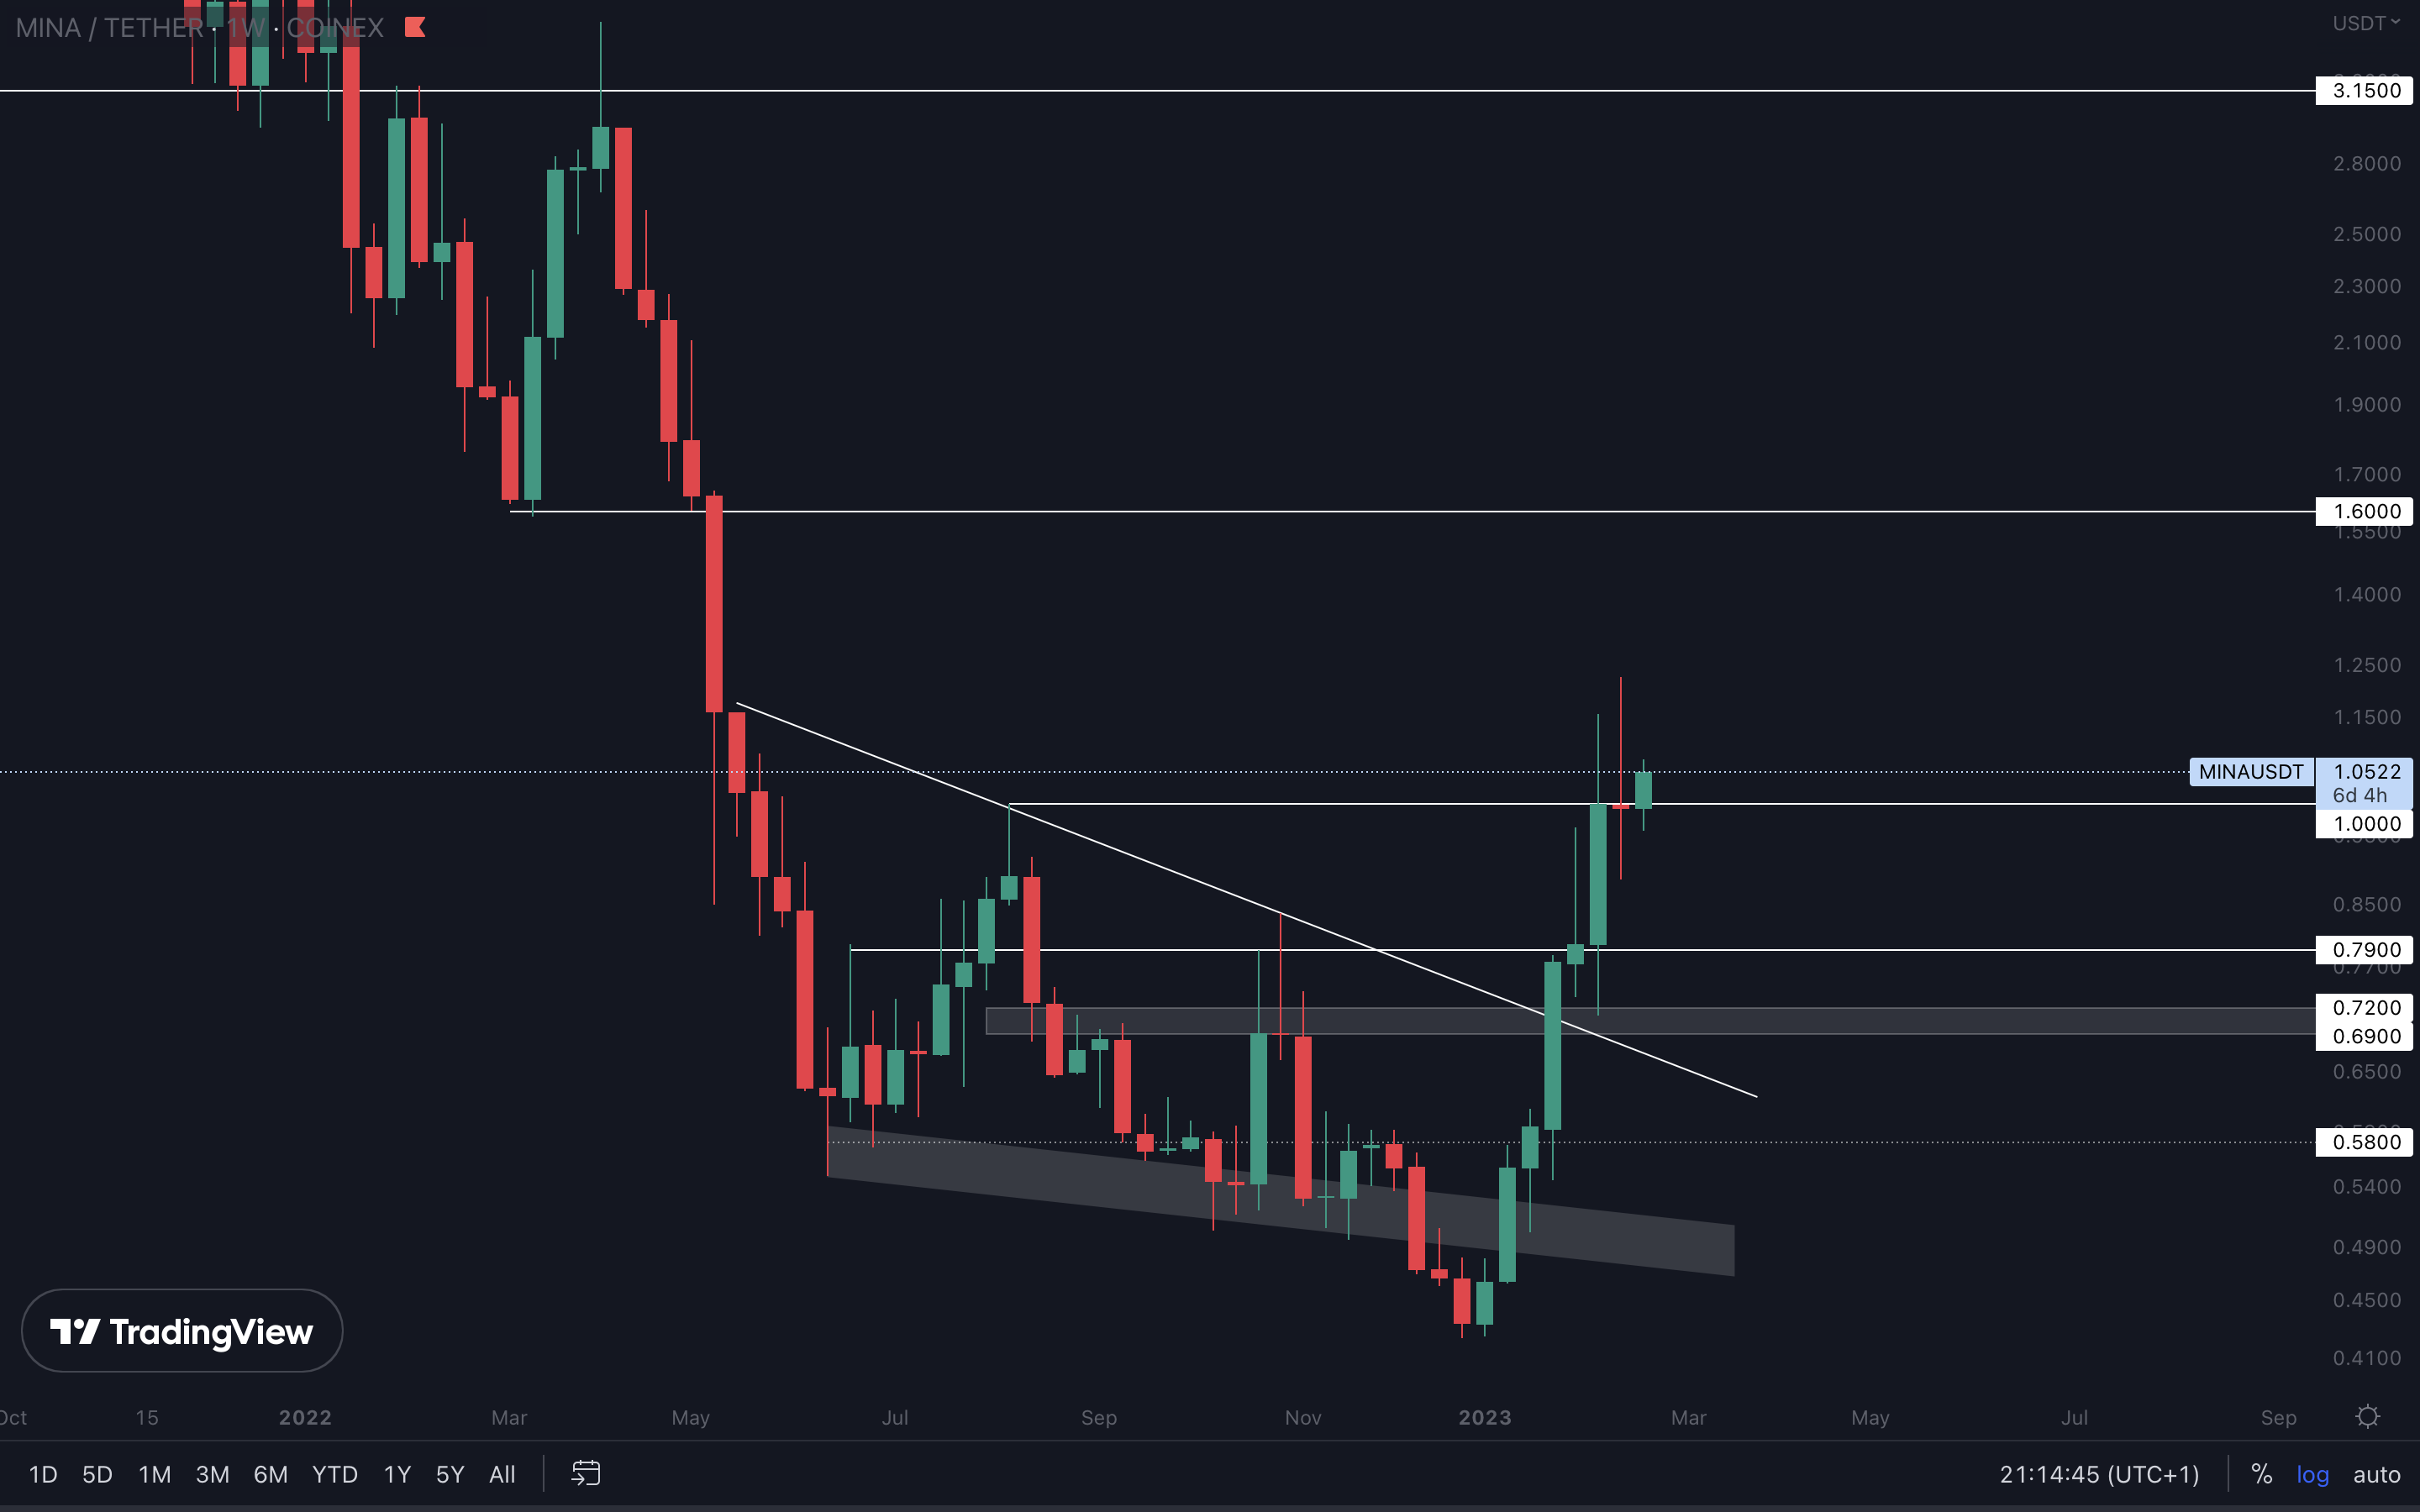
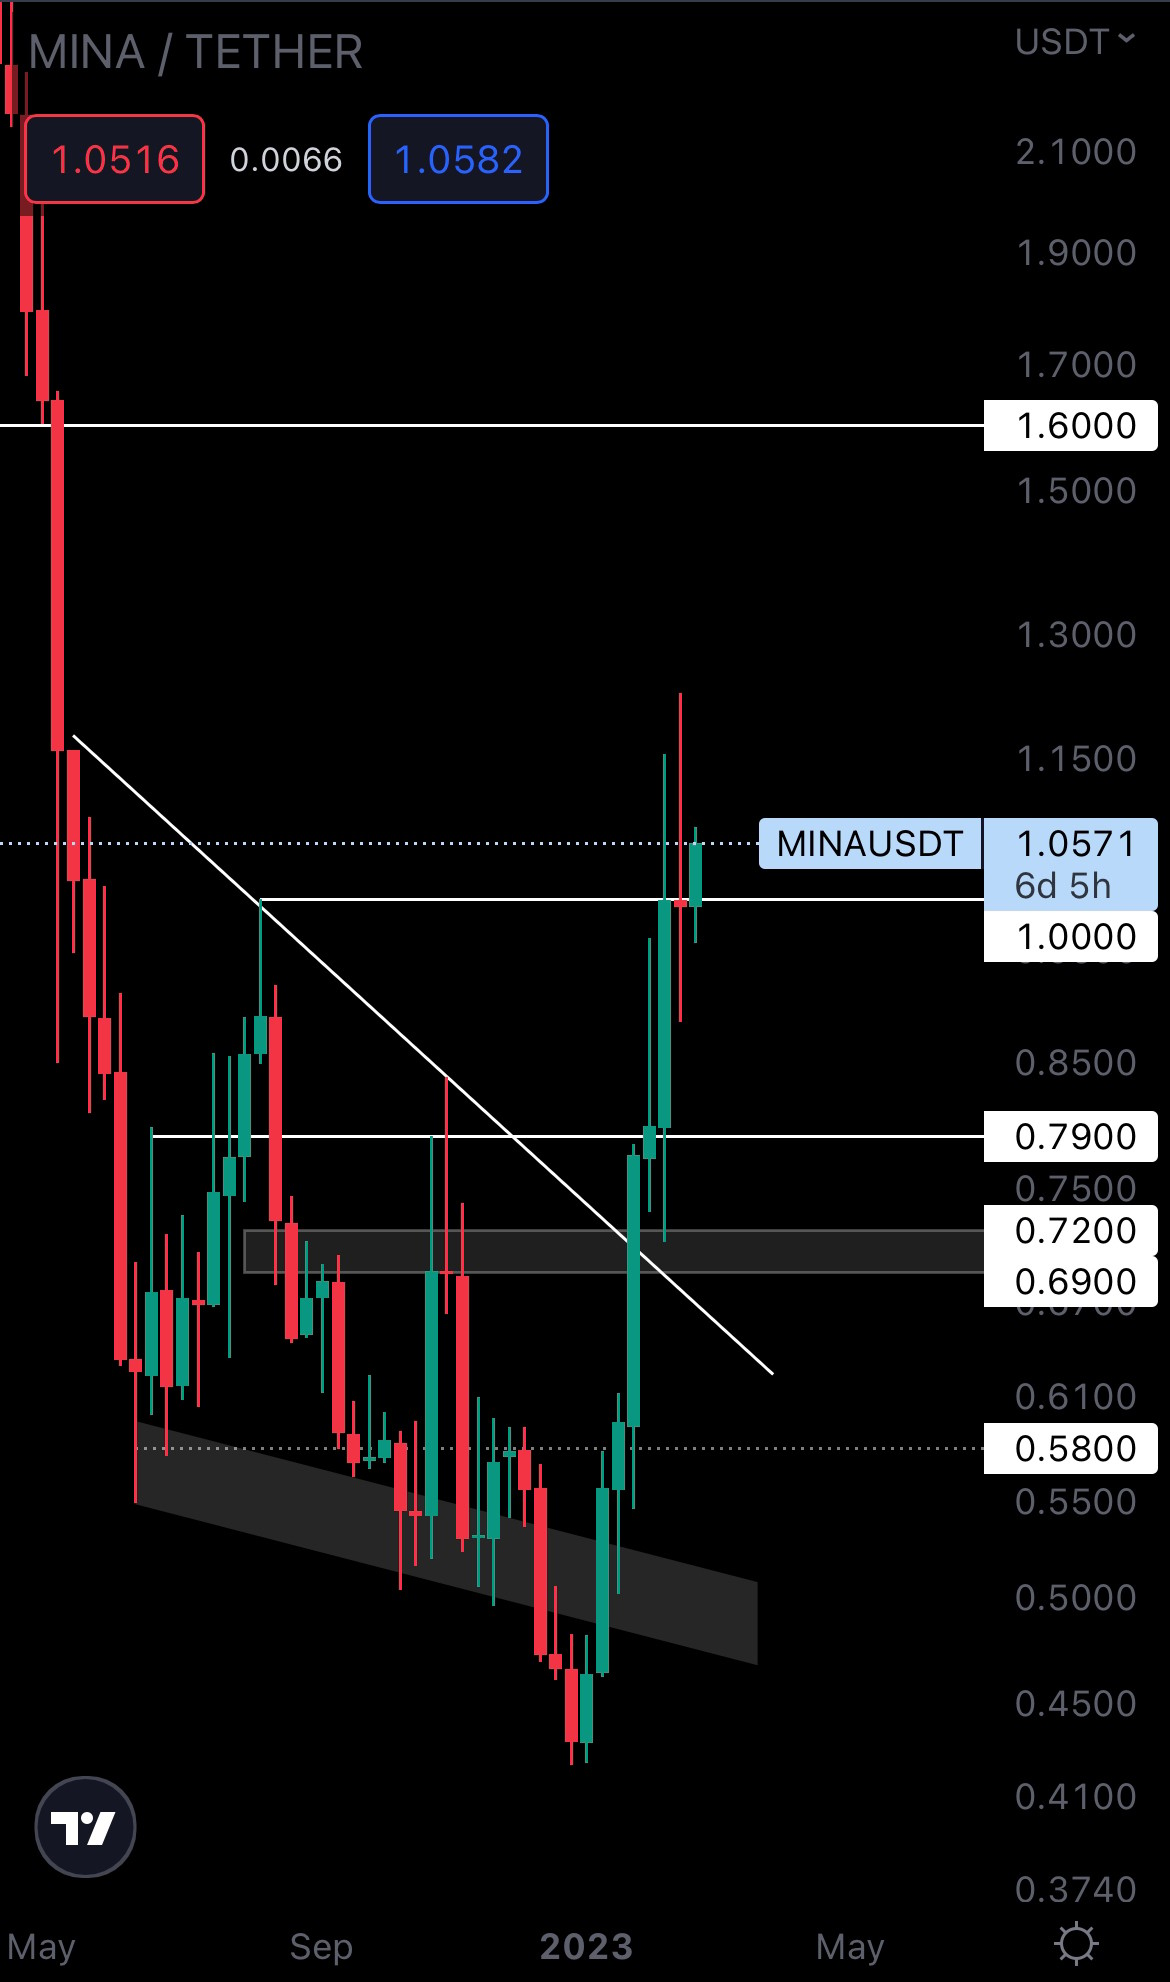
Unfortunately, MINA is indecisive. Last week’s candle closed not only as a Doji (short body, long wicks), but also under resistance. This isn’t in line with the rest of the market, which makes an entry here indecisive. Instead, waiting for a weekly closure above $1 would reinforce the idea that upside may follow, with the next target at $1.60.
STG | Stargate Finance
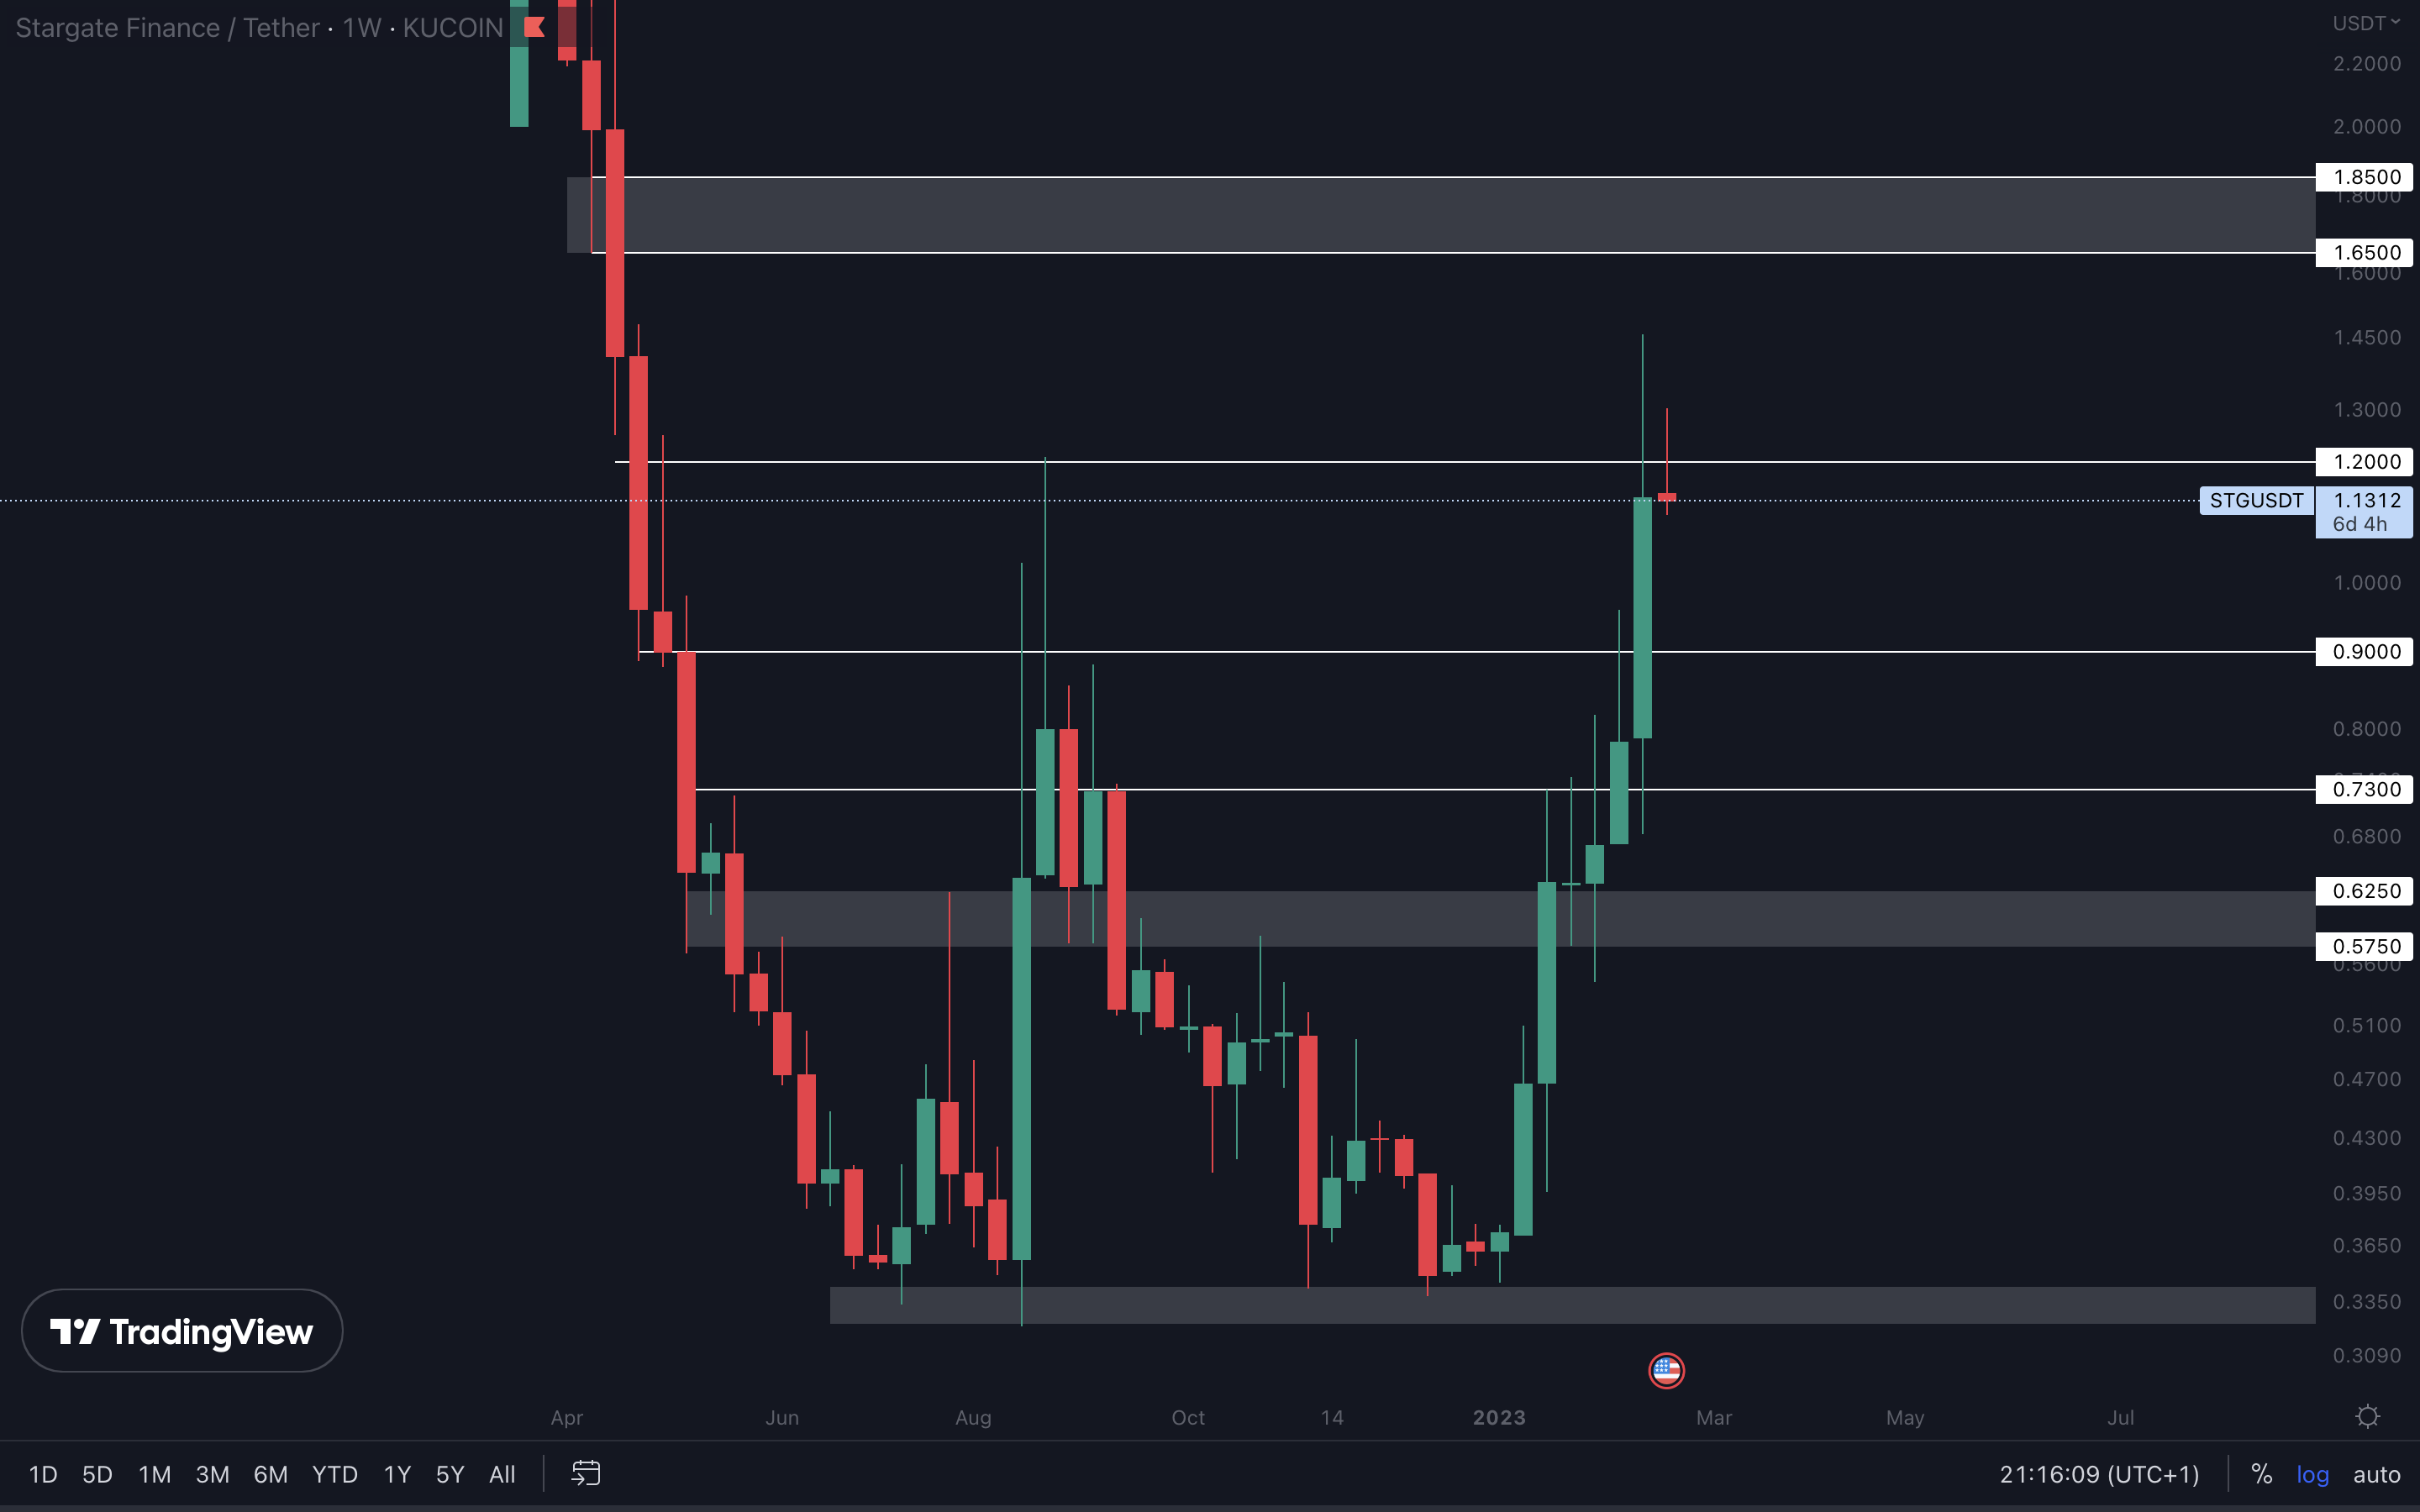
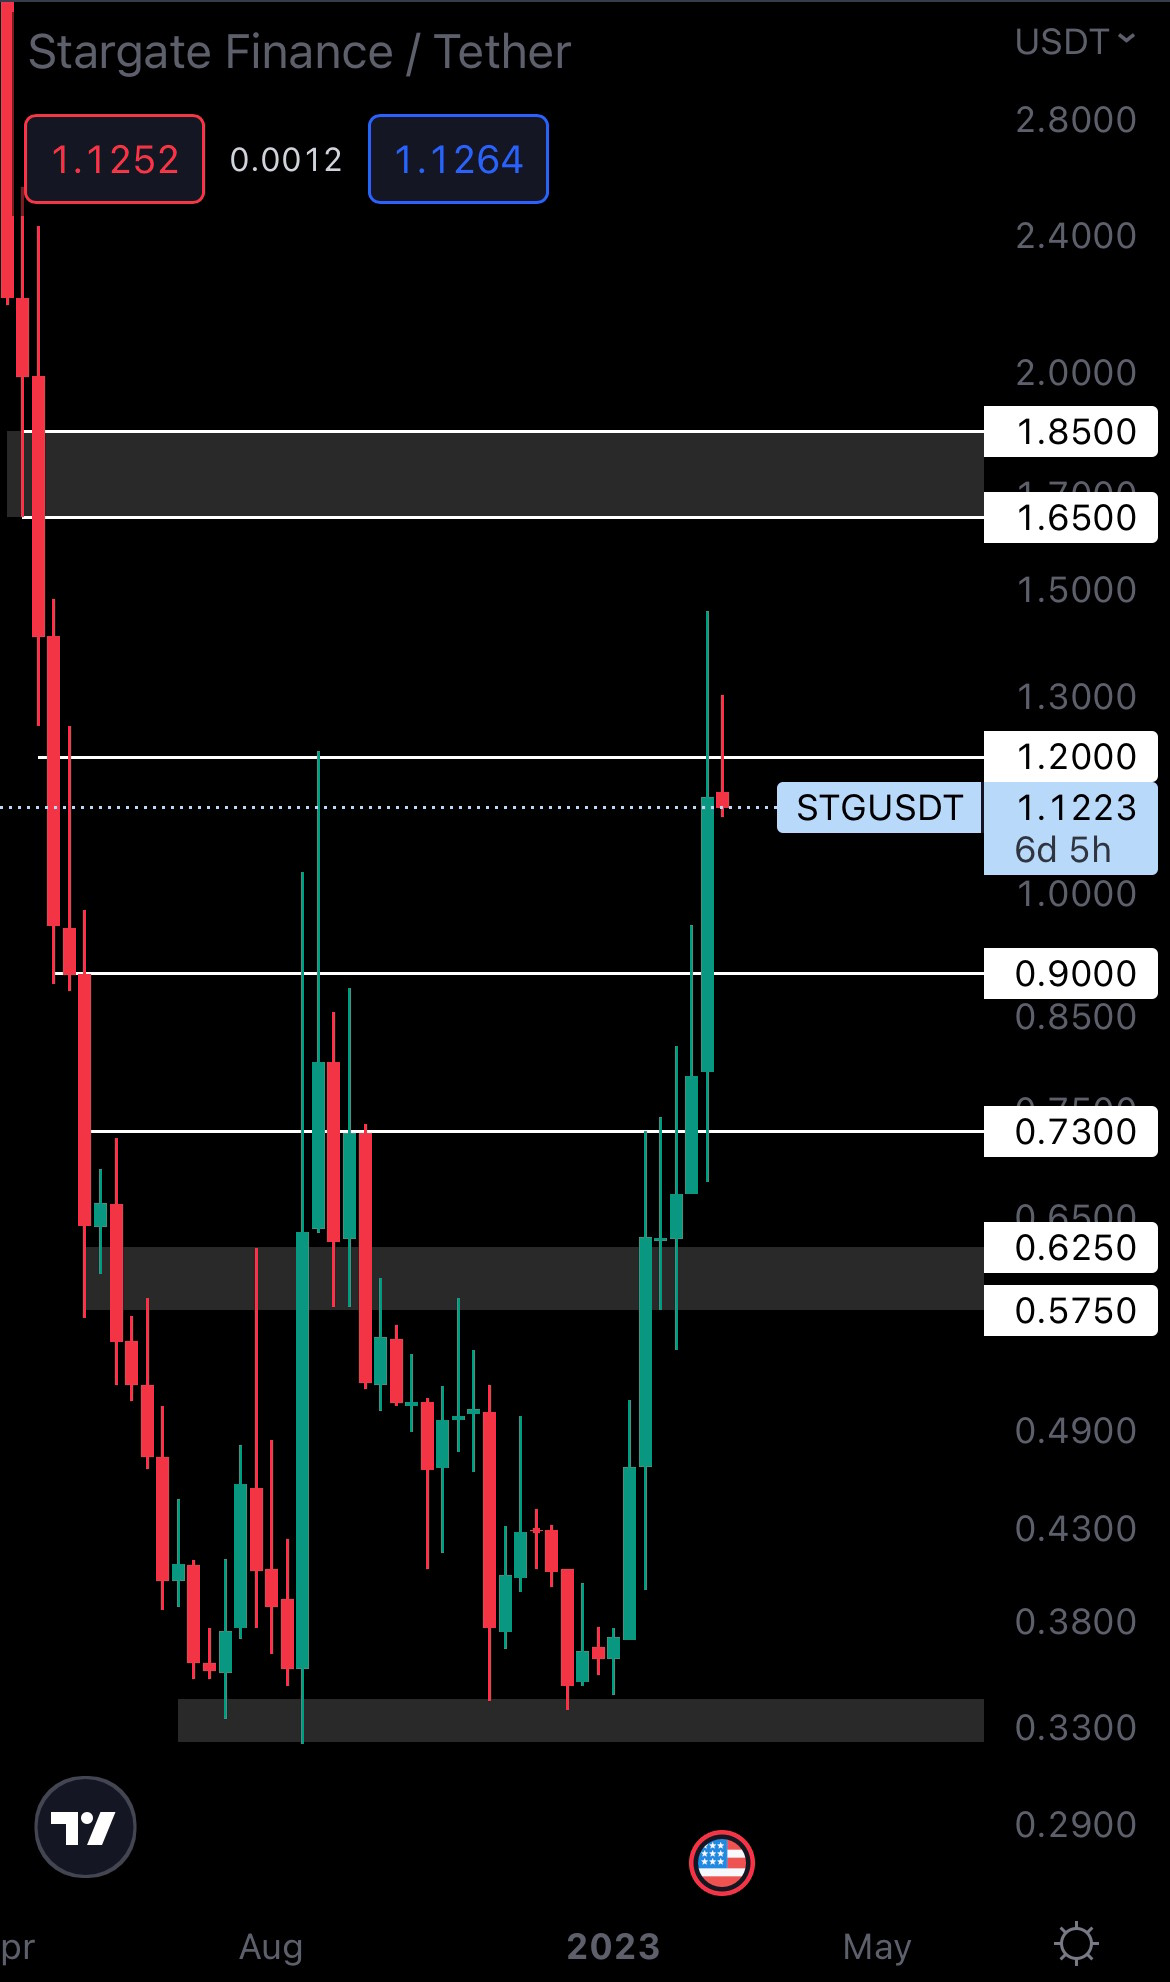
Quite an explosive week for STG, but there might be more. For further upside to continue, specifically to the next resistance area of $1.65 - $1.85, STG must close a weekly candle above $1.20. We believe this should be an easy task if the rest of the market performs well, as STG already has the necessary volume to break above this level. This is definitely an opportunity to watch as we head into the next weeks.
Cryptonary’s take
Although the Total Market Cap broke resistance, we must see Bitcoin breaking $25,150. As soon as that happens, the rally may continue, and we believe Bitcoin and Ether will reach $30,000 and $2000 respectively (that’s the minimum target, even higher prices can follow). Here are a few action points for you as we head into new weeks:
- No short-term opportunities should be taken until Bitcoin breaks above its $25,150 resistance level, as there is a risk of rejection.
- If Bitcoin gets rejected from resistance (clear and aggressive rejection), reducing short-term positions is recommended. This will not impact your long-term positions at all.
- If the market rallies again, taking profits on the way up is recommended.
Recommended from Cryptonary


