Save 23% ($351) & Get a Free 1-1 Call with our Team ⏰ : 0d 2h 59m 43s
Here's why we're going to the moon | Jan 9th
You might be familiar with the phrase "to the moon", it means we are going up, right? Well, in this report, we dive into the charts to help you understand why we believe we're going to the moon, and why you should too.
Disclaimer: Not financial or investment advice. You are responsible for any capital-related decisions you make, and only you are accountable for the results.
TLDR
- The ETH flippening has begun - check the ETH/BTC chart below.
- January will be bullish for crypto.
- The crypto market is bottoming and there’s only one thing you can do about it.
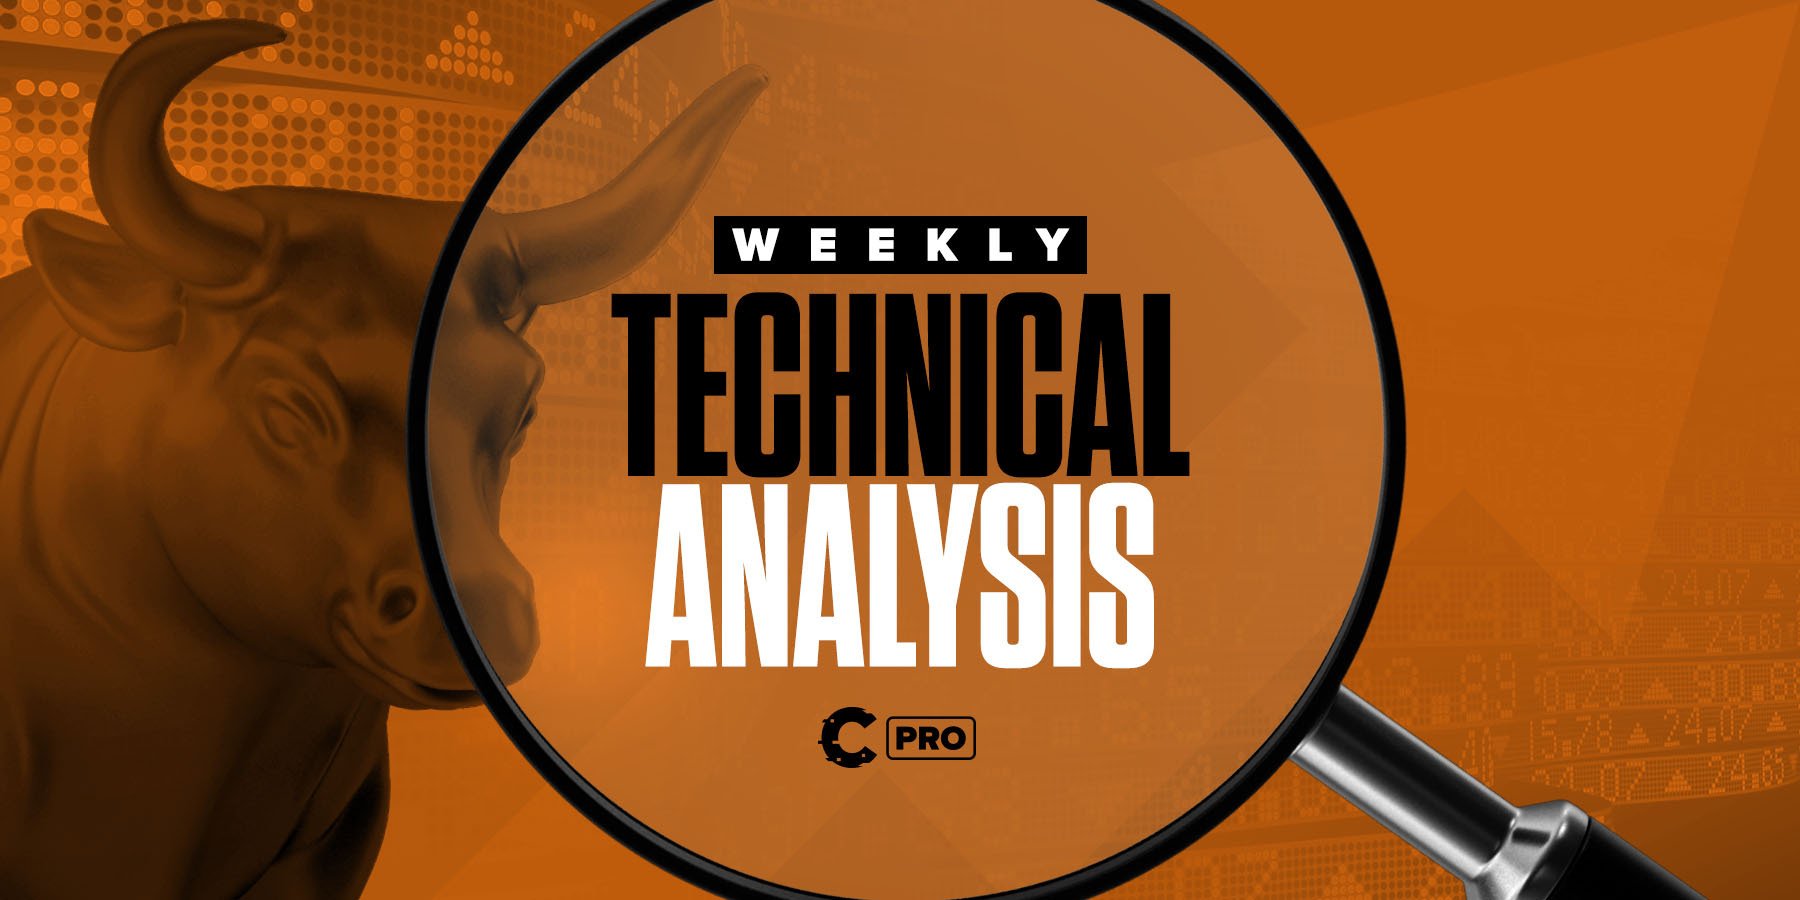
Total Market Cap
If this chart isn’t simple for you, then let us simplify it even more:
First of all, we have never seen the Total Market Cap index drop under the previous bull run's all-time high. This means that historically, the odds of the market staying above the 2018 all-time high are a lot higher than dropping under it. With that said, we believe we're in a bottom-making territory. The Total Market Cap index is trading just above its 2018 all-time high level, the price action is becoming flatter by the day, which means people have already started leaving the market in hope that they could time the bottom. Let me tell you this - they won’t time the bottom, but they could understand where it might be forming if only they would pay attention. And that’s exactly what we’re trying to show you - the crypto market at 2018 all-time high levels has a high probability of bottoming. This is a process that will take multiple months, and there’s nothing you should do about it other than prepare.
If history changes and we're wrong, then just know that a bottom will form at some point this year.
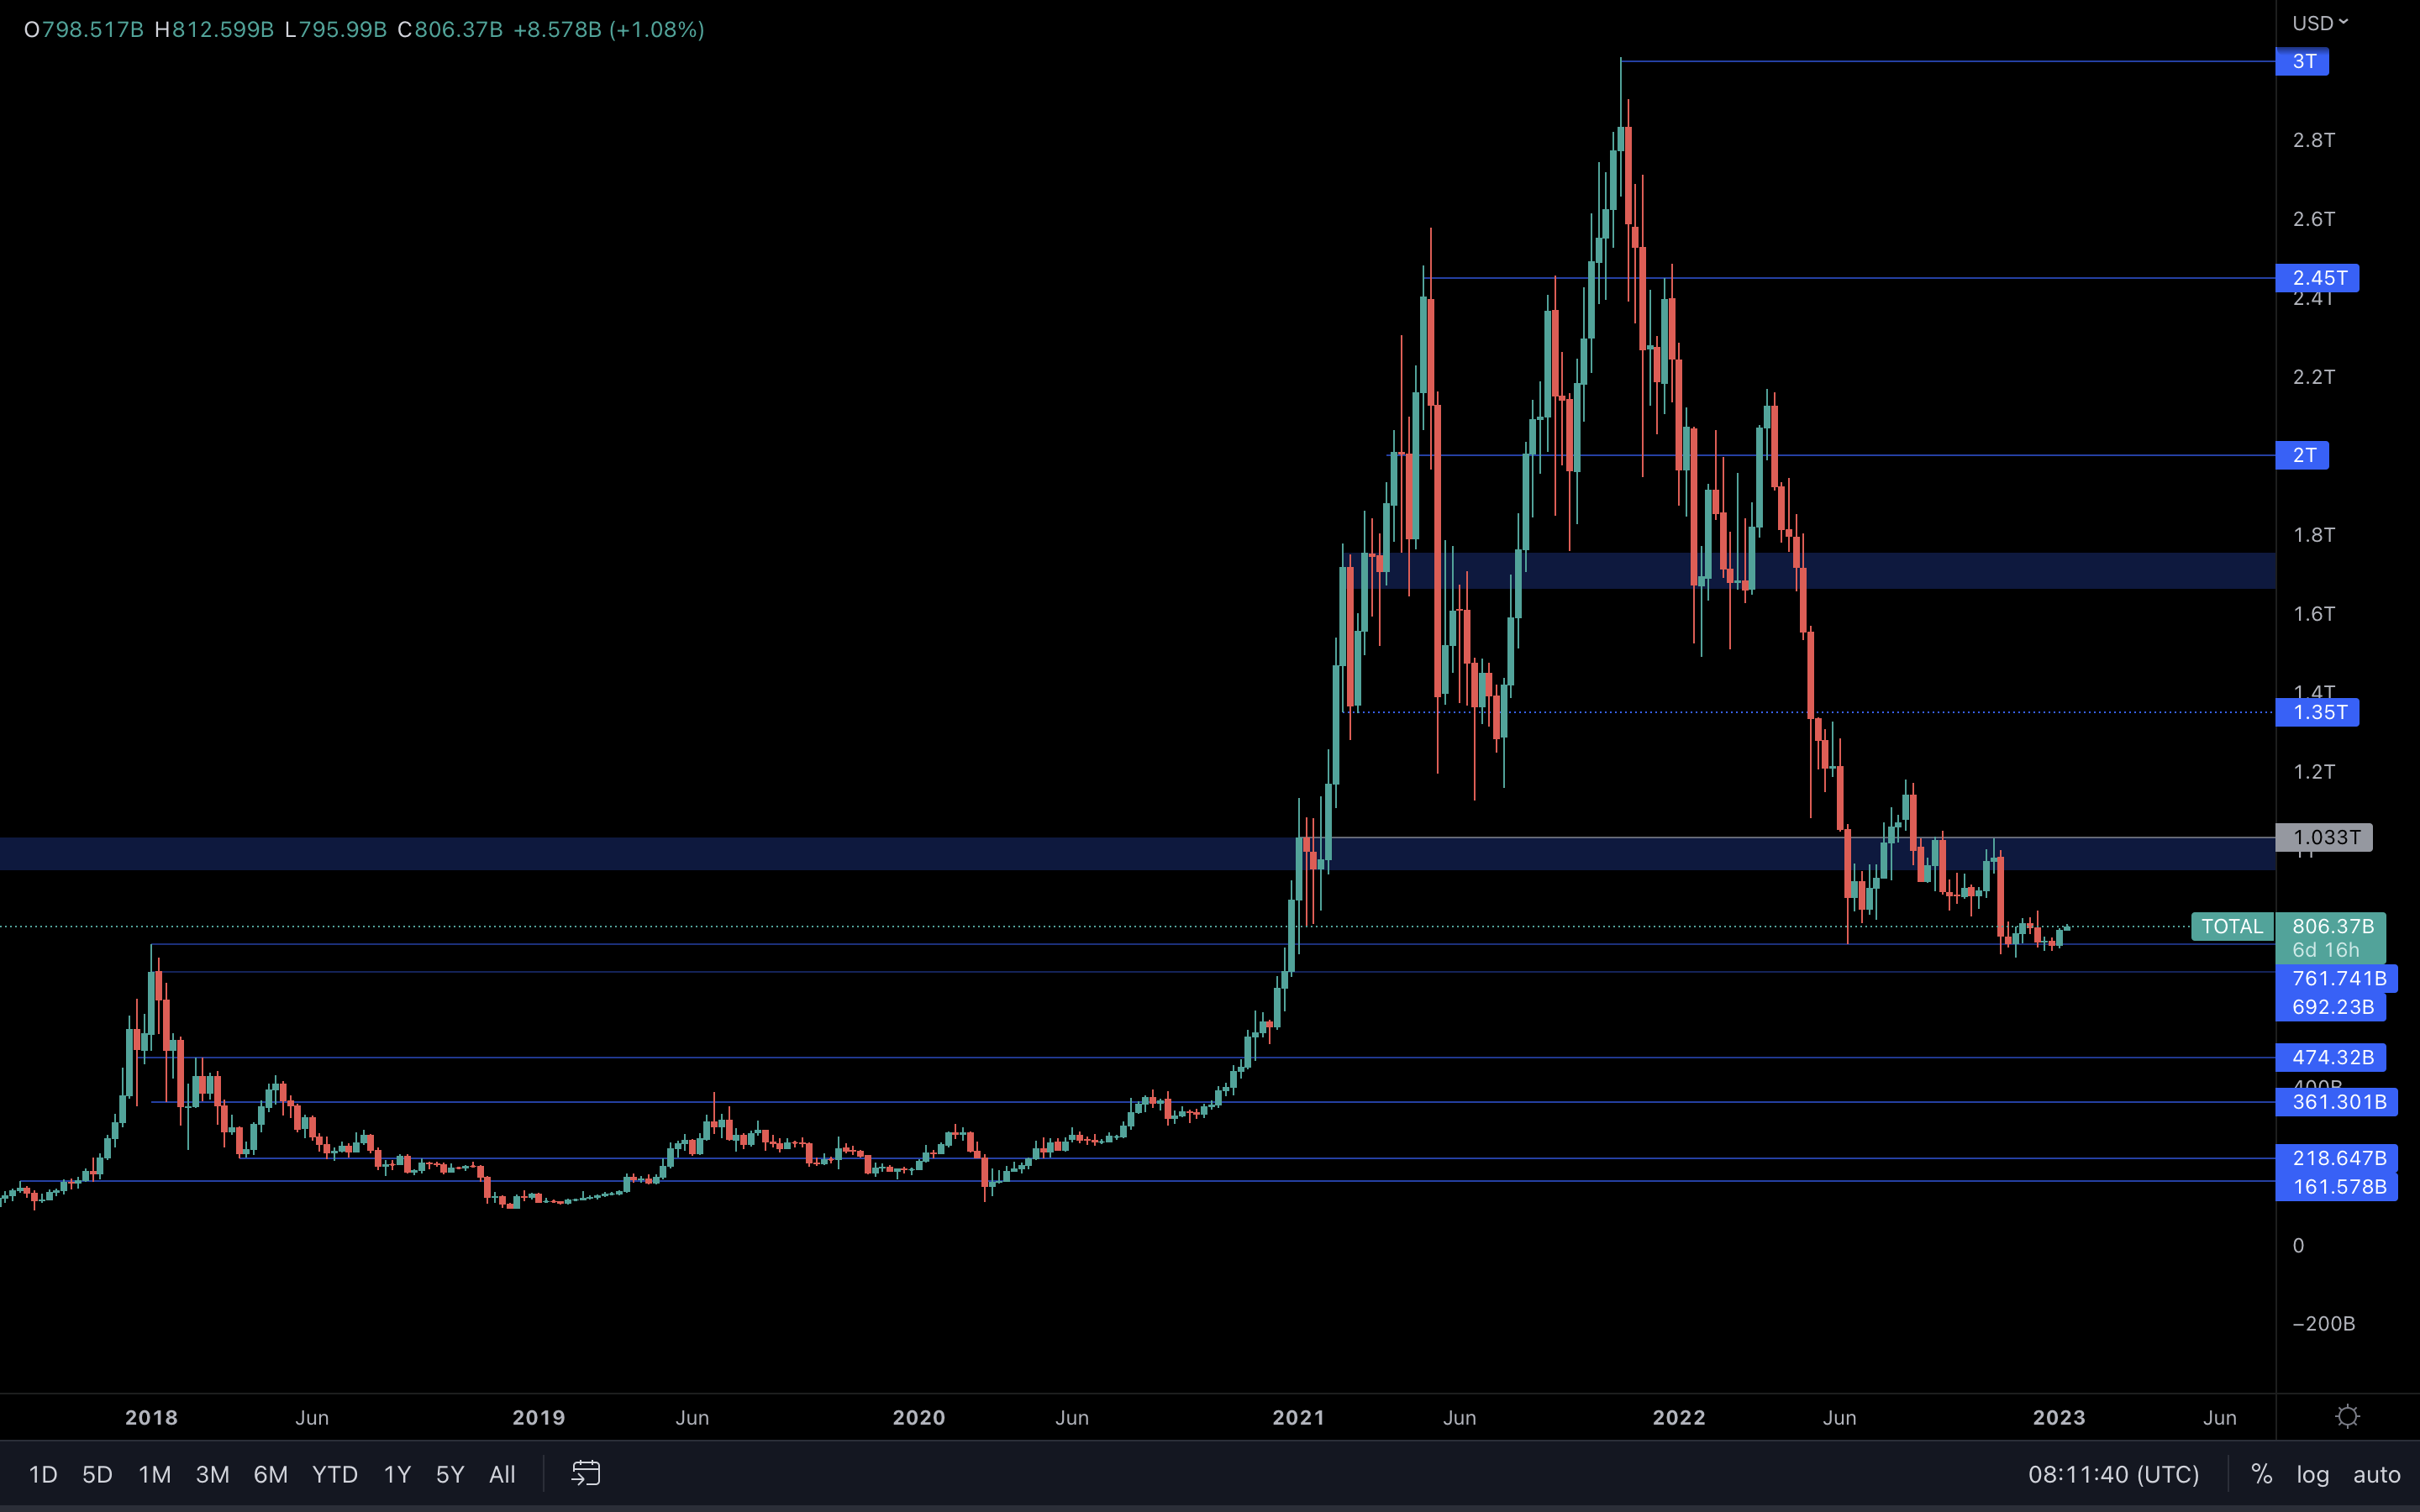
Altcoins Market Cap
The Altcoins Market Cap index is currently testing resistance at $475B. A weekly break above this level will put $550B on the cards.
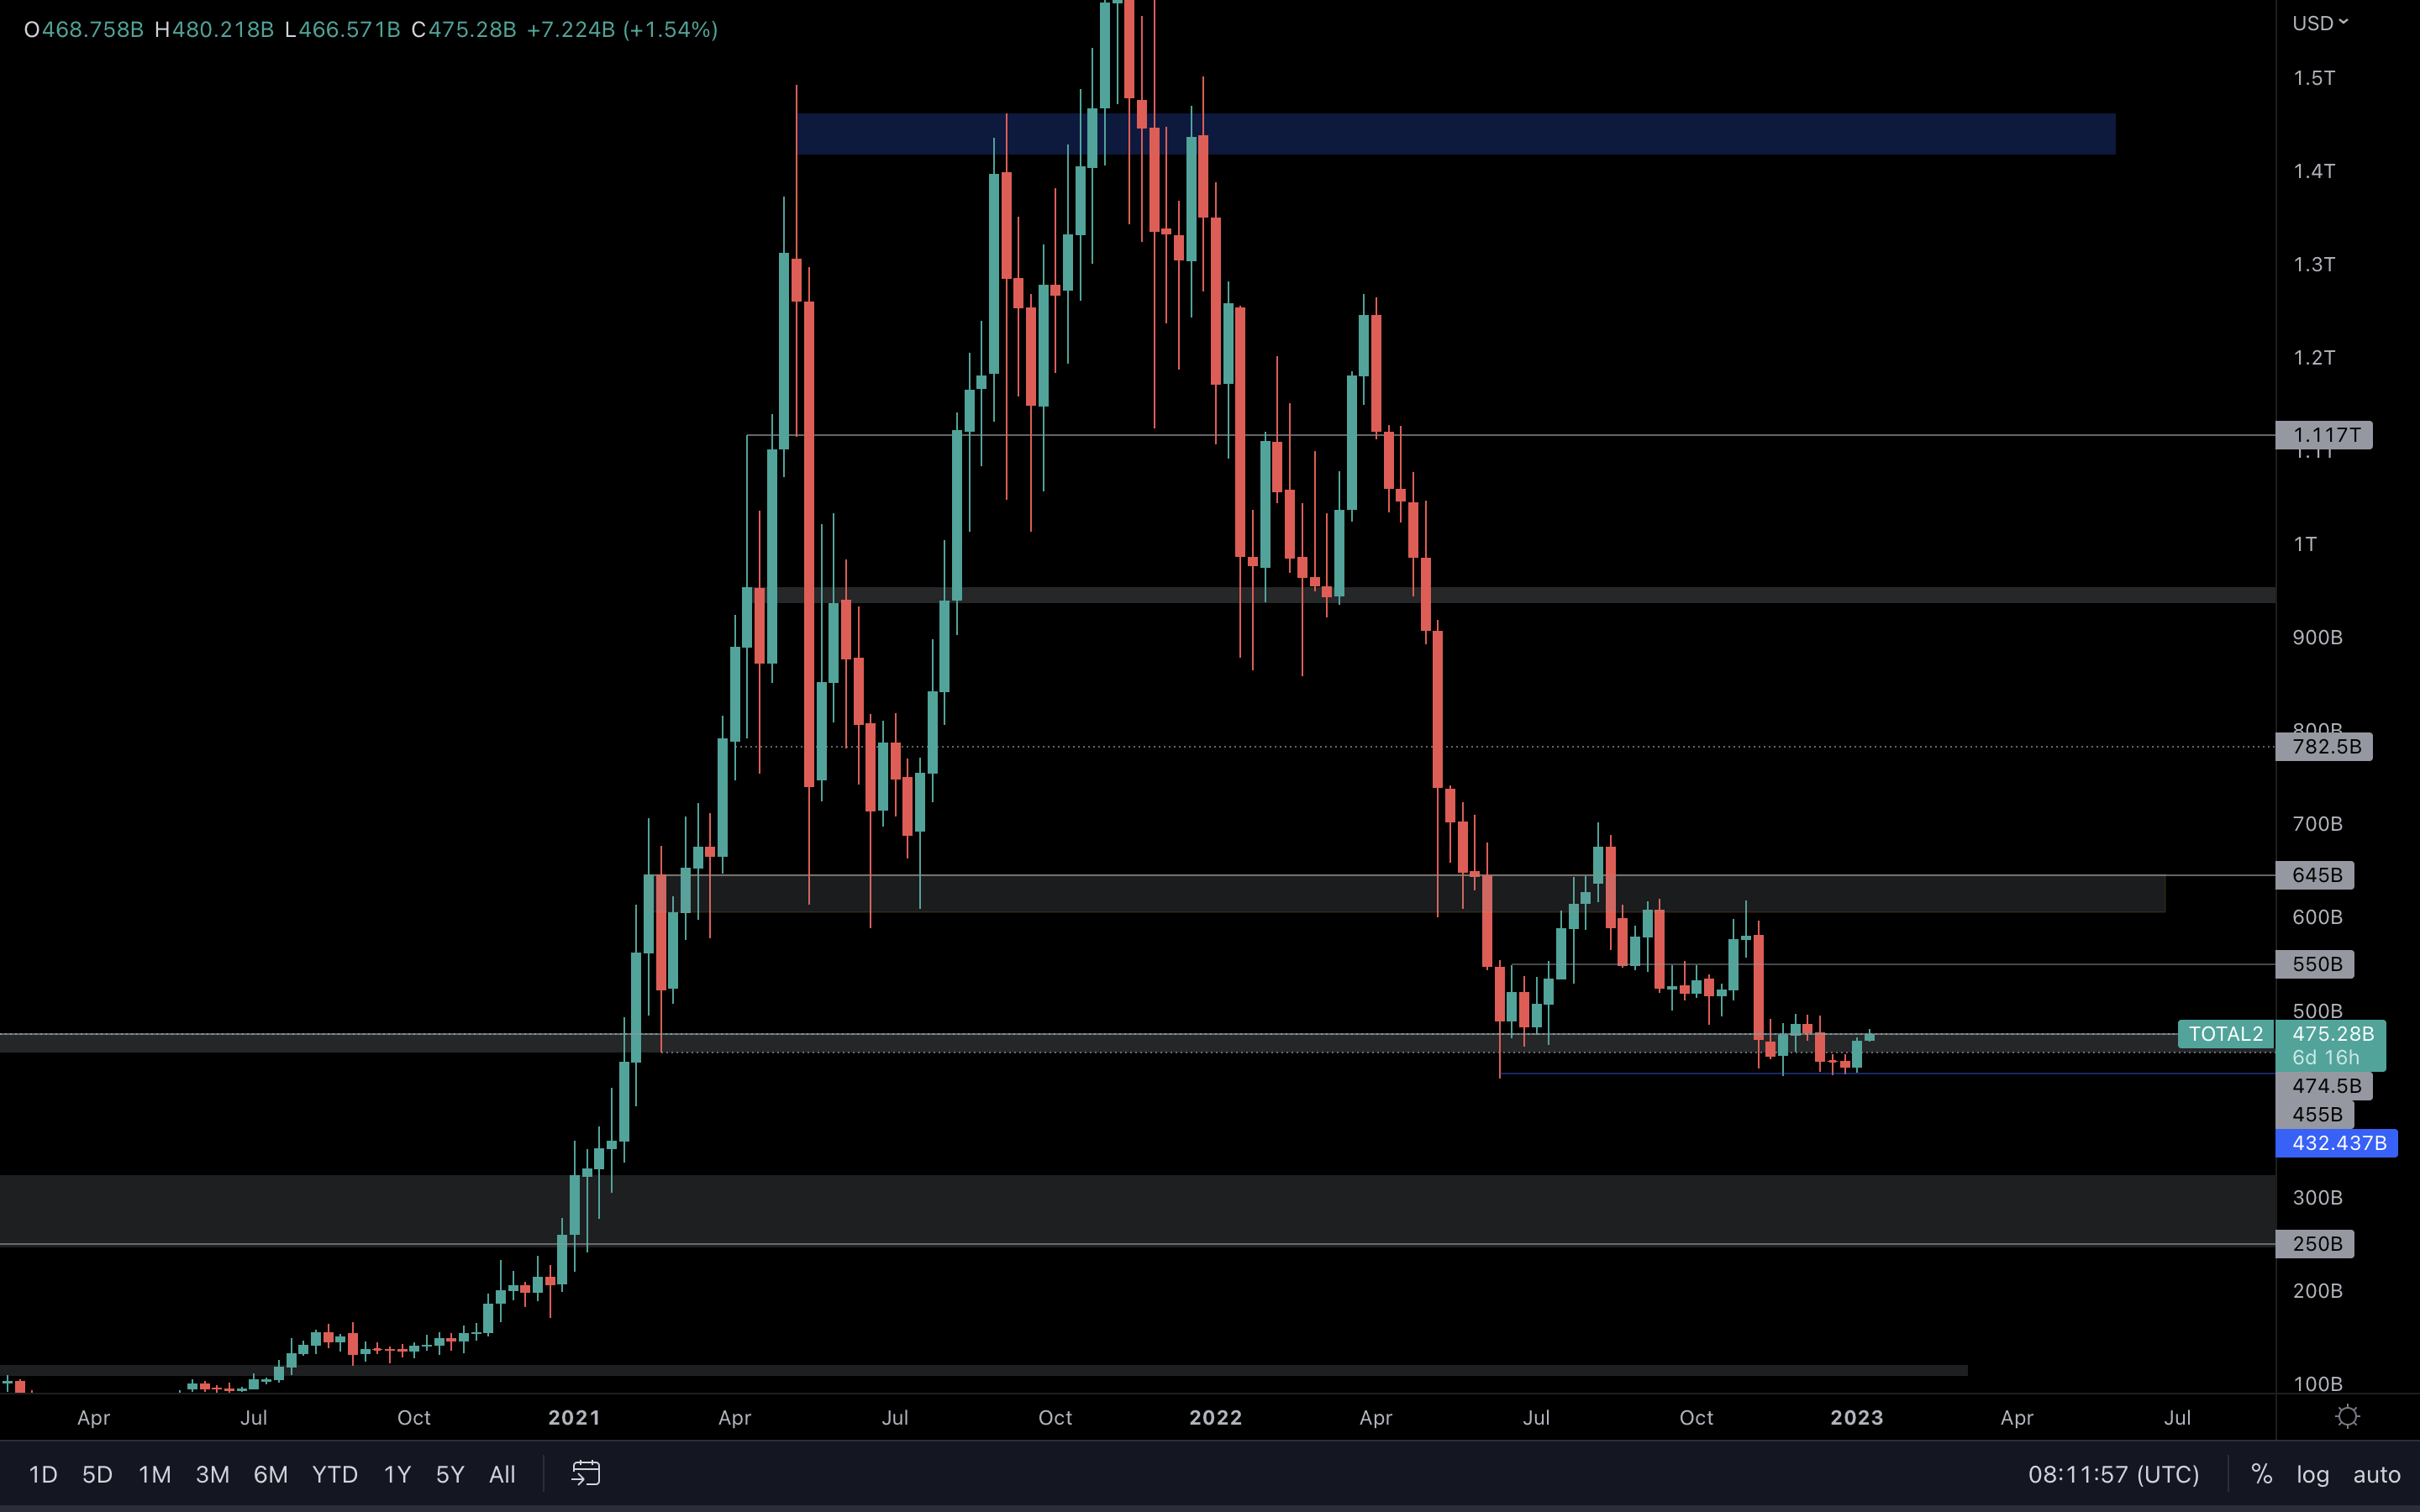
DPI | DeFi Index
The DPI (DeFi Pulse Index) measures the overall health and performance of the DeFi market, which should be of interest to all market participants.
We can definitely see the index is forming a bottom after dropping throughout 2021 and 2022 based on the decrease in volume & strength. What's important here is for us to see a break & reclaim of $125 (the blue trend line) - this will confirm a DeFi rally.
BTC | Bitcoin
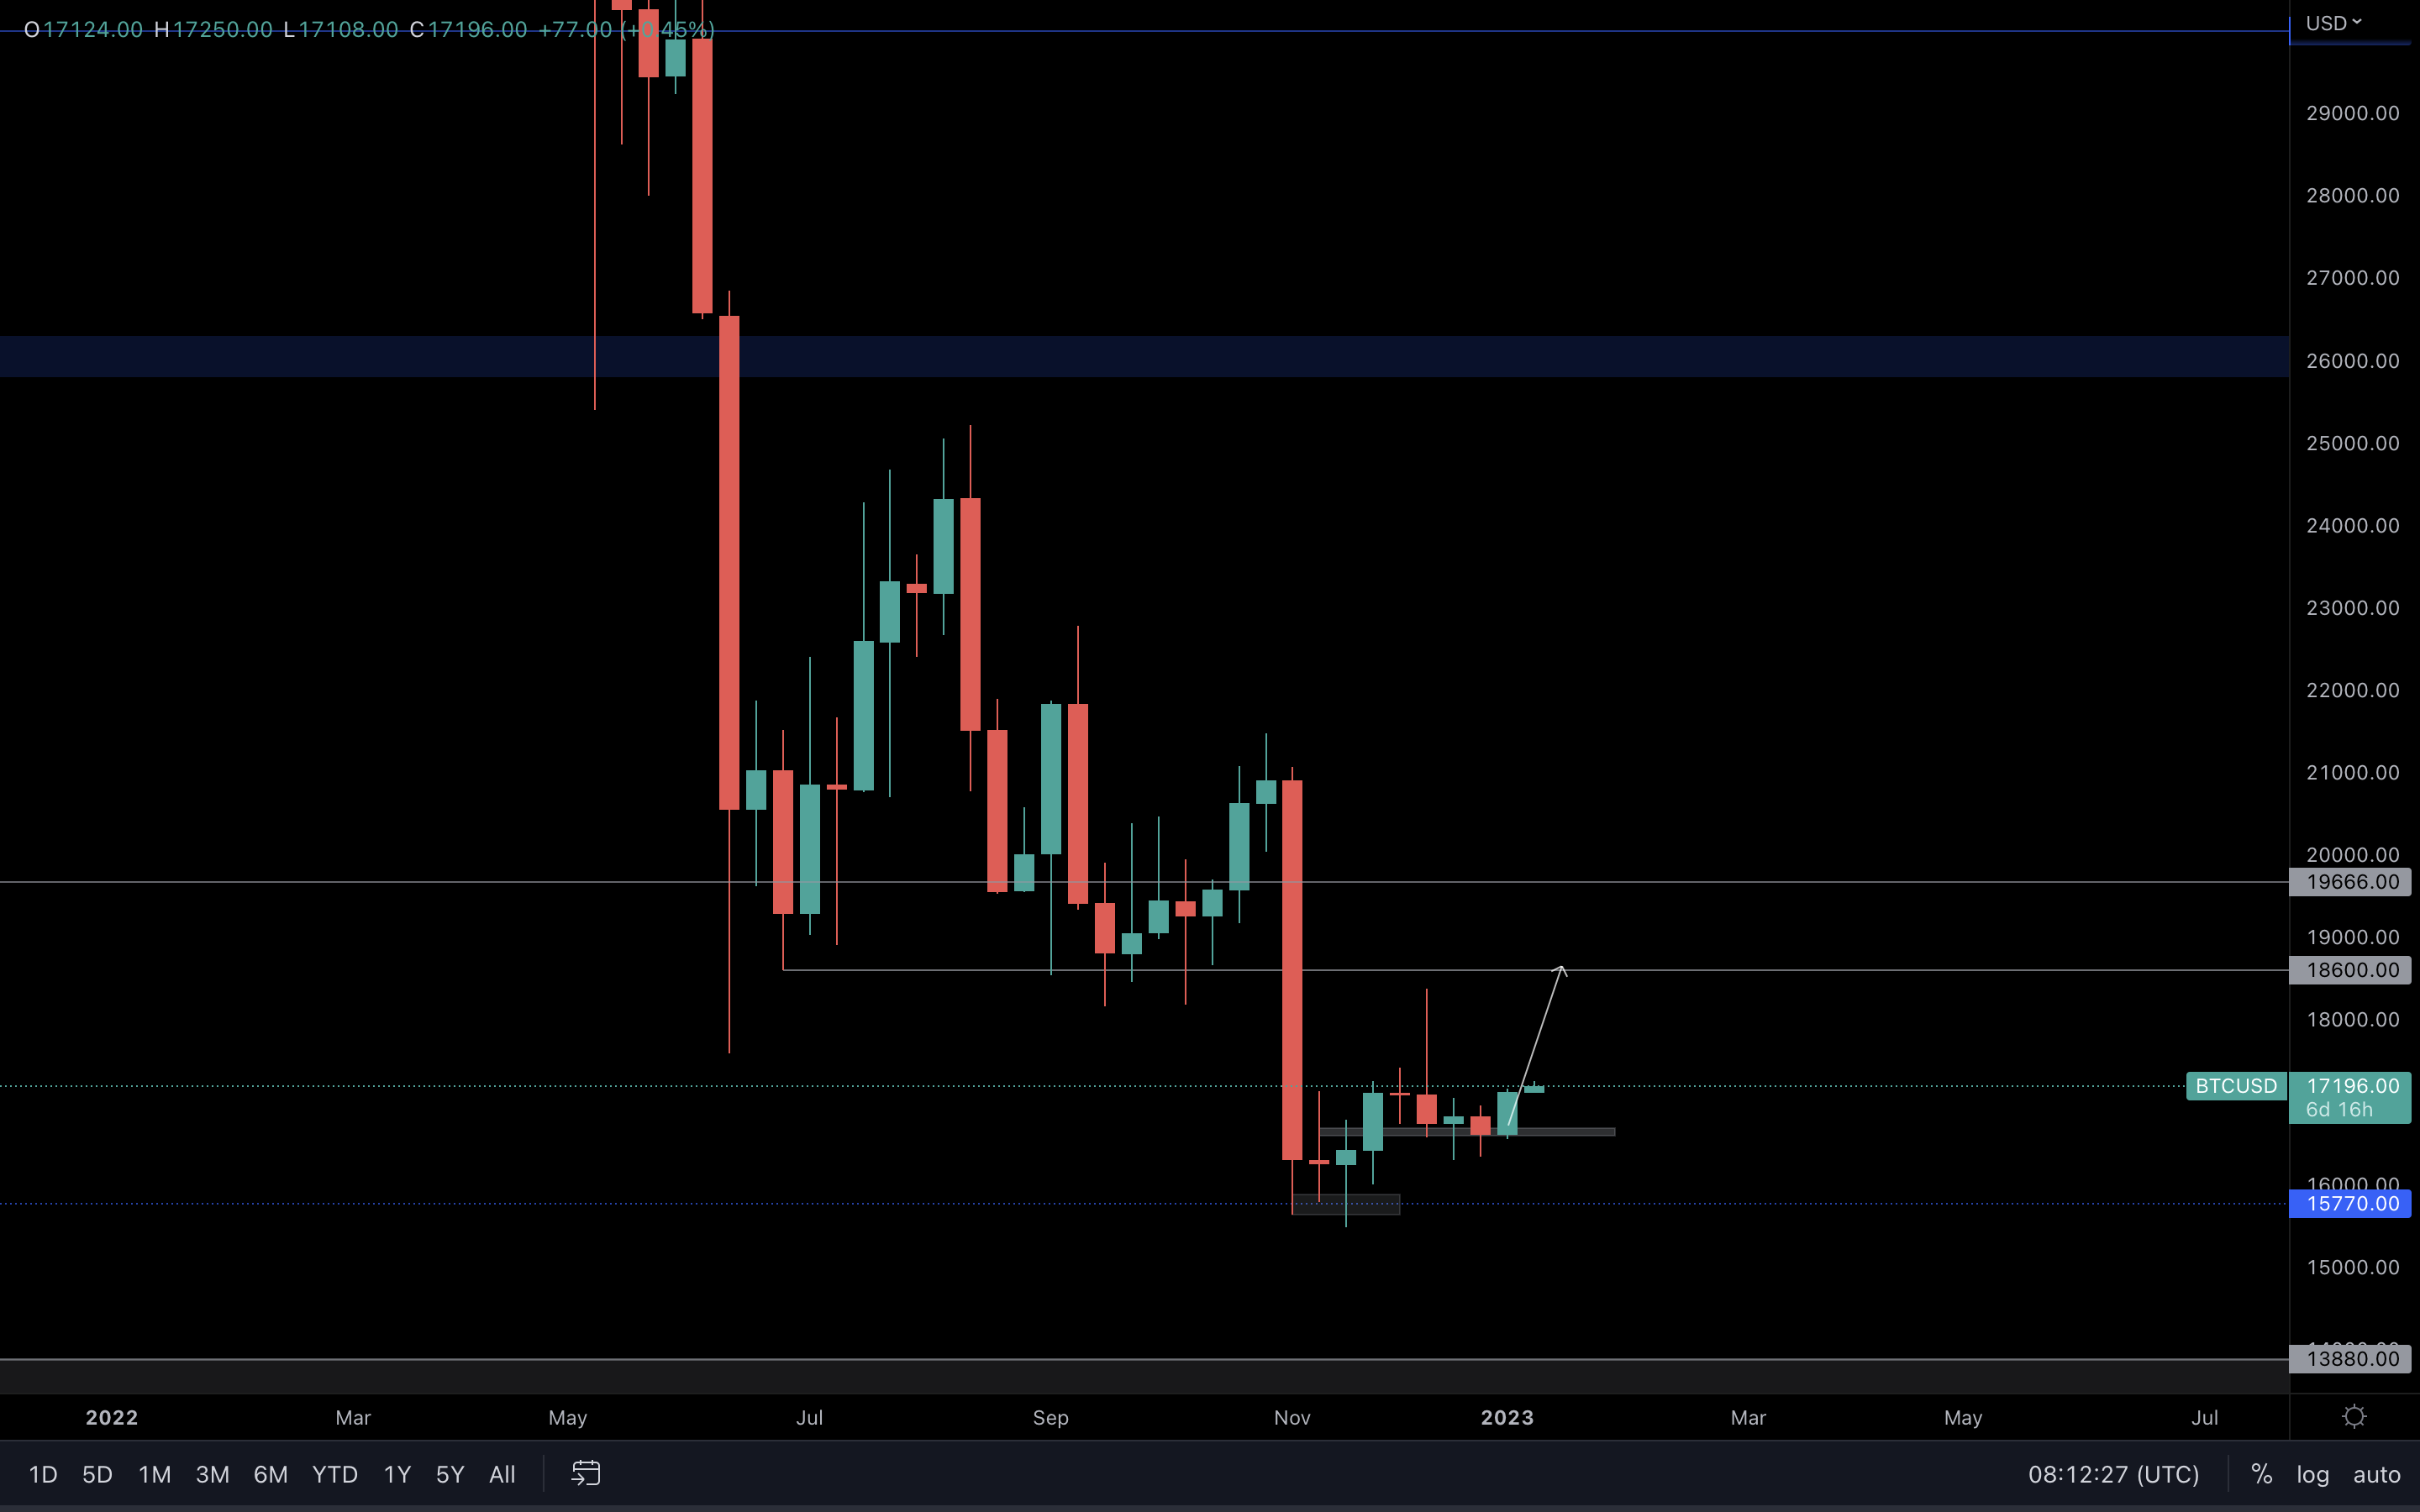
Last week, Bitcoin closed a bullish engulfing candle that opens the road for $18,600. We will likely see this level being tested in the next two weeks if the pace continues as it is now. Anything above $18,600 remains skeptical for now since we’re still in a bear market.
If you've read the title, then the answer to "To the moon?" is a large NO. The bottoming process will take a lot more time, and it wouldn't be wise for us to believe a potential rally will push us to, let's say - $26k or above. Higher timeframes remain bearish, and until we see a clear change in market structures, then nothing major should be expected.
ETH | Ethereum
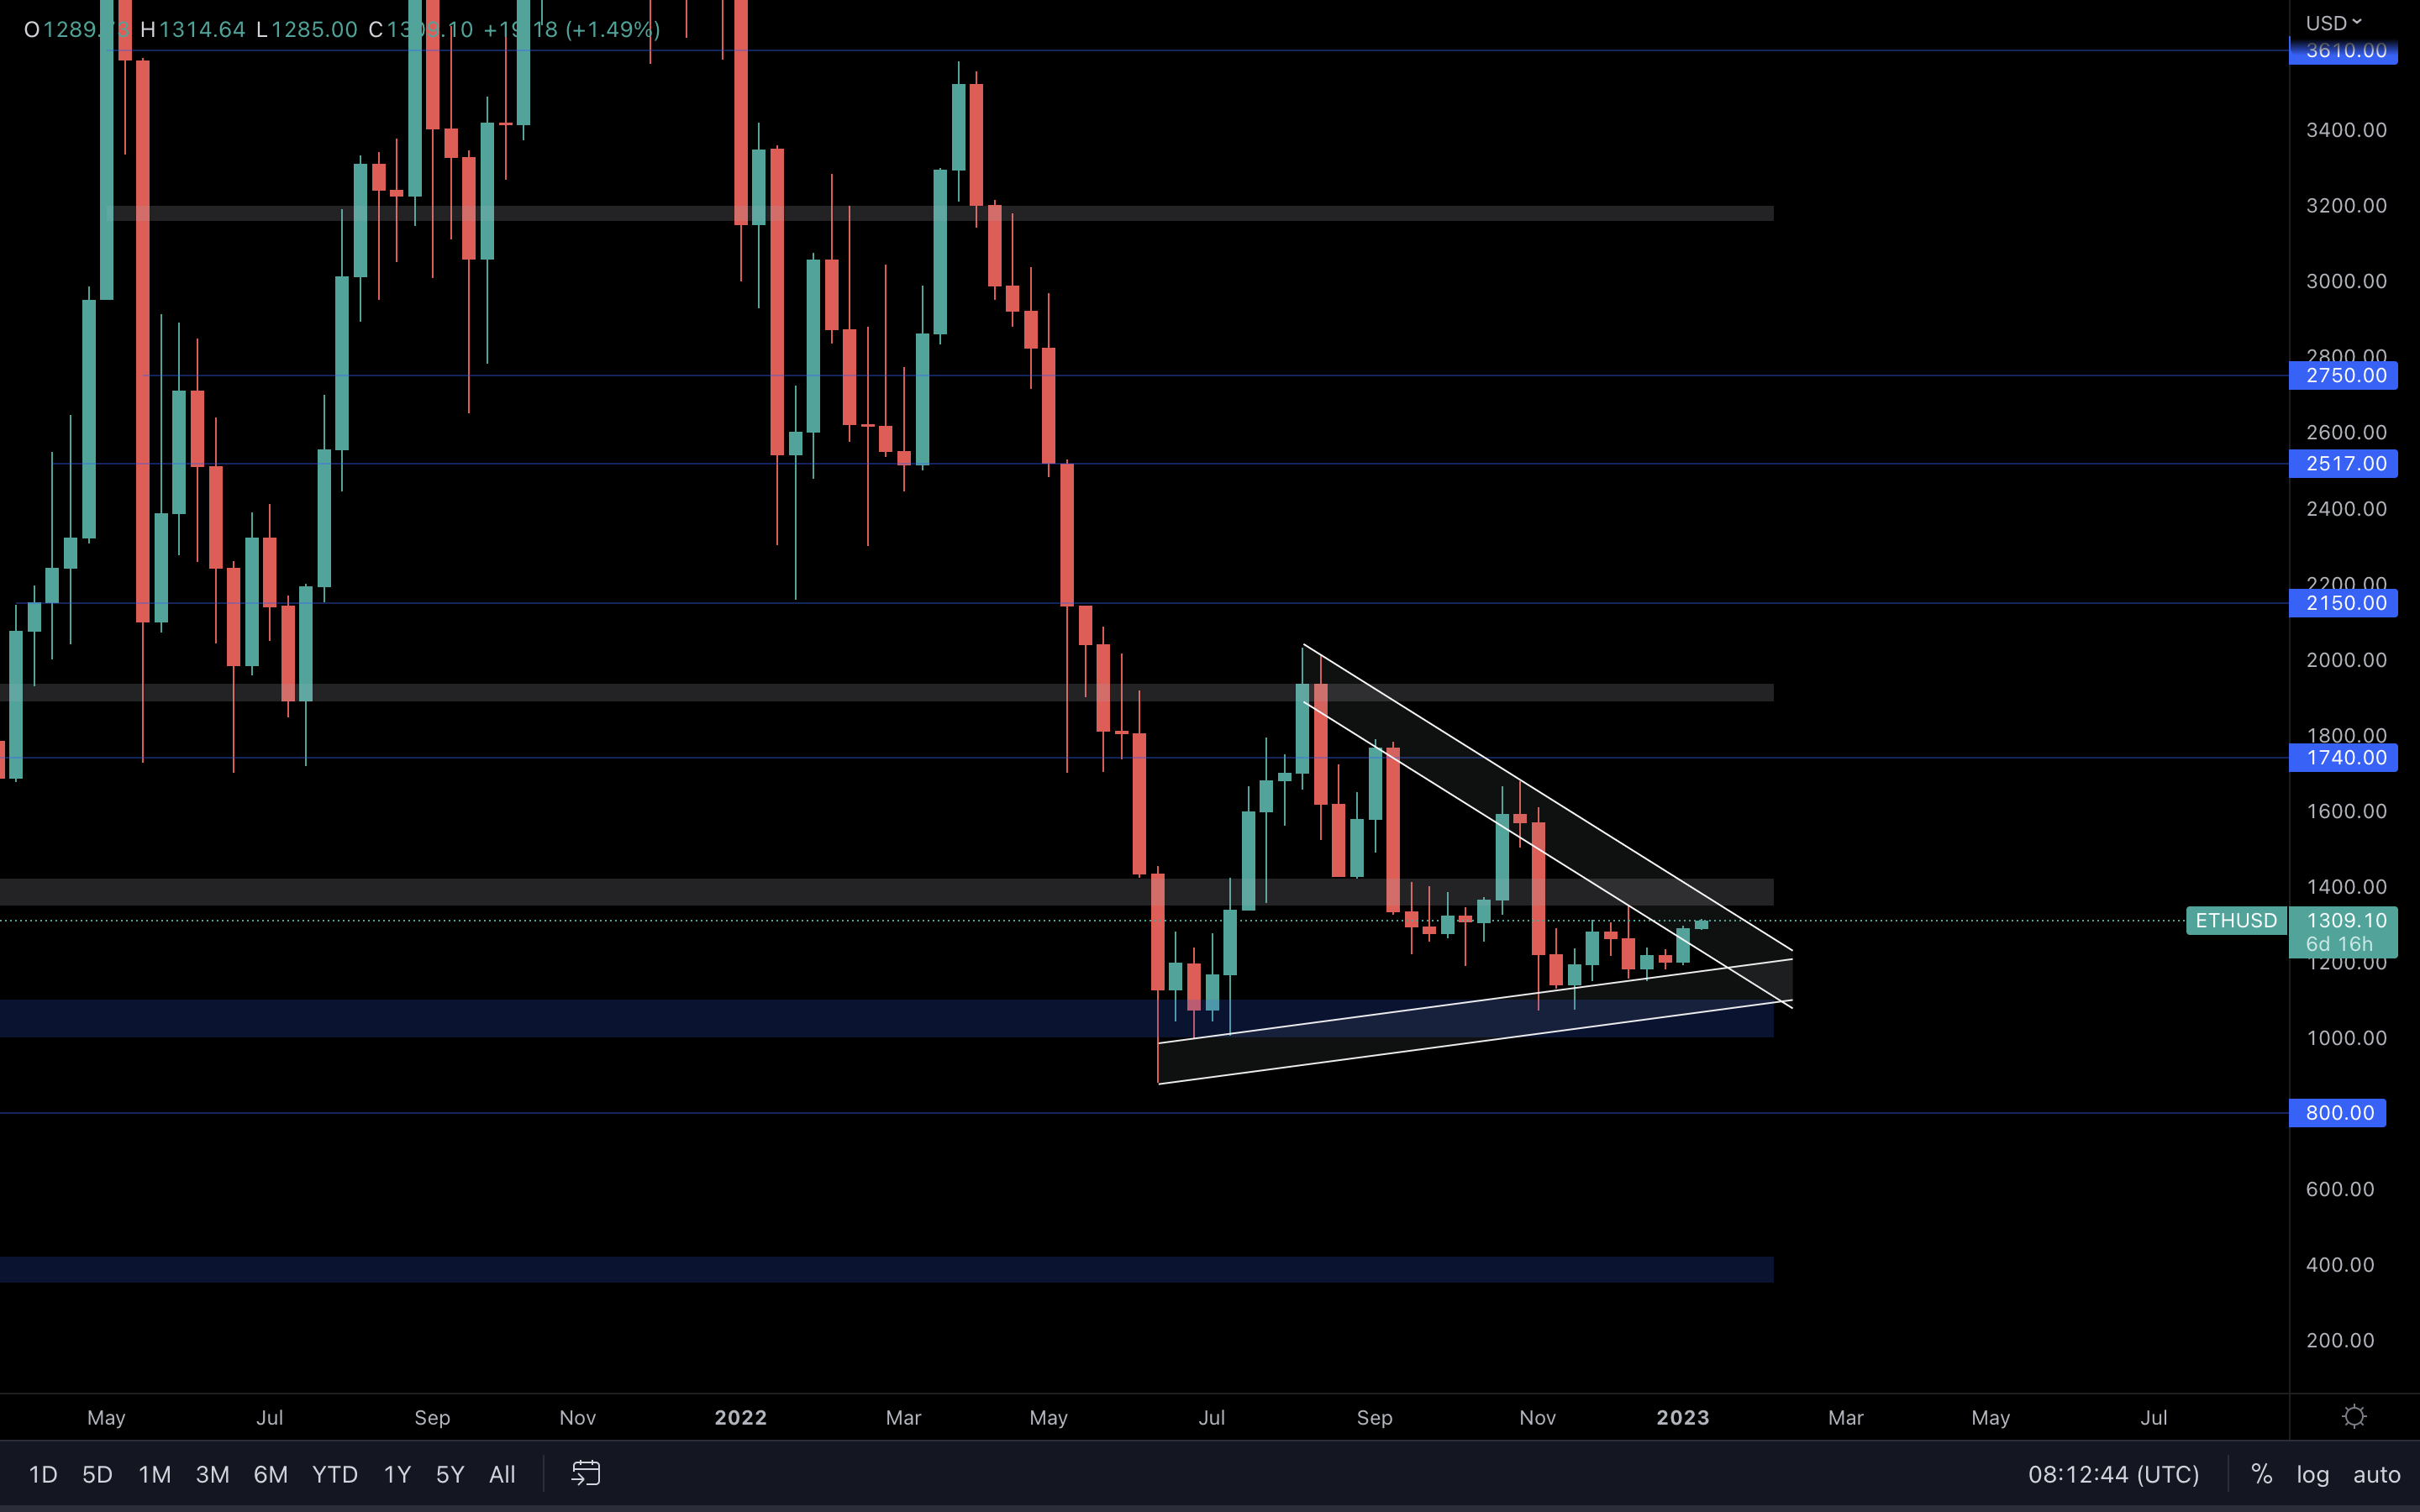
Almost a full-bodied candle for Ethereum last week, that suggests buyers now have the upper hand and will push the price of ETH to the next resistance area of $1400. The symmetrical triangle we identified a few weeks back is close to a decision-making point - and we believe it will break to the upside.
If we see Ethereum break the symmetrical triangle to the upside, then our targets are $1740, and $1900 respectively.
ETH/BTC
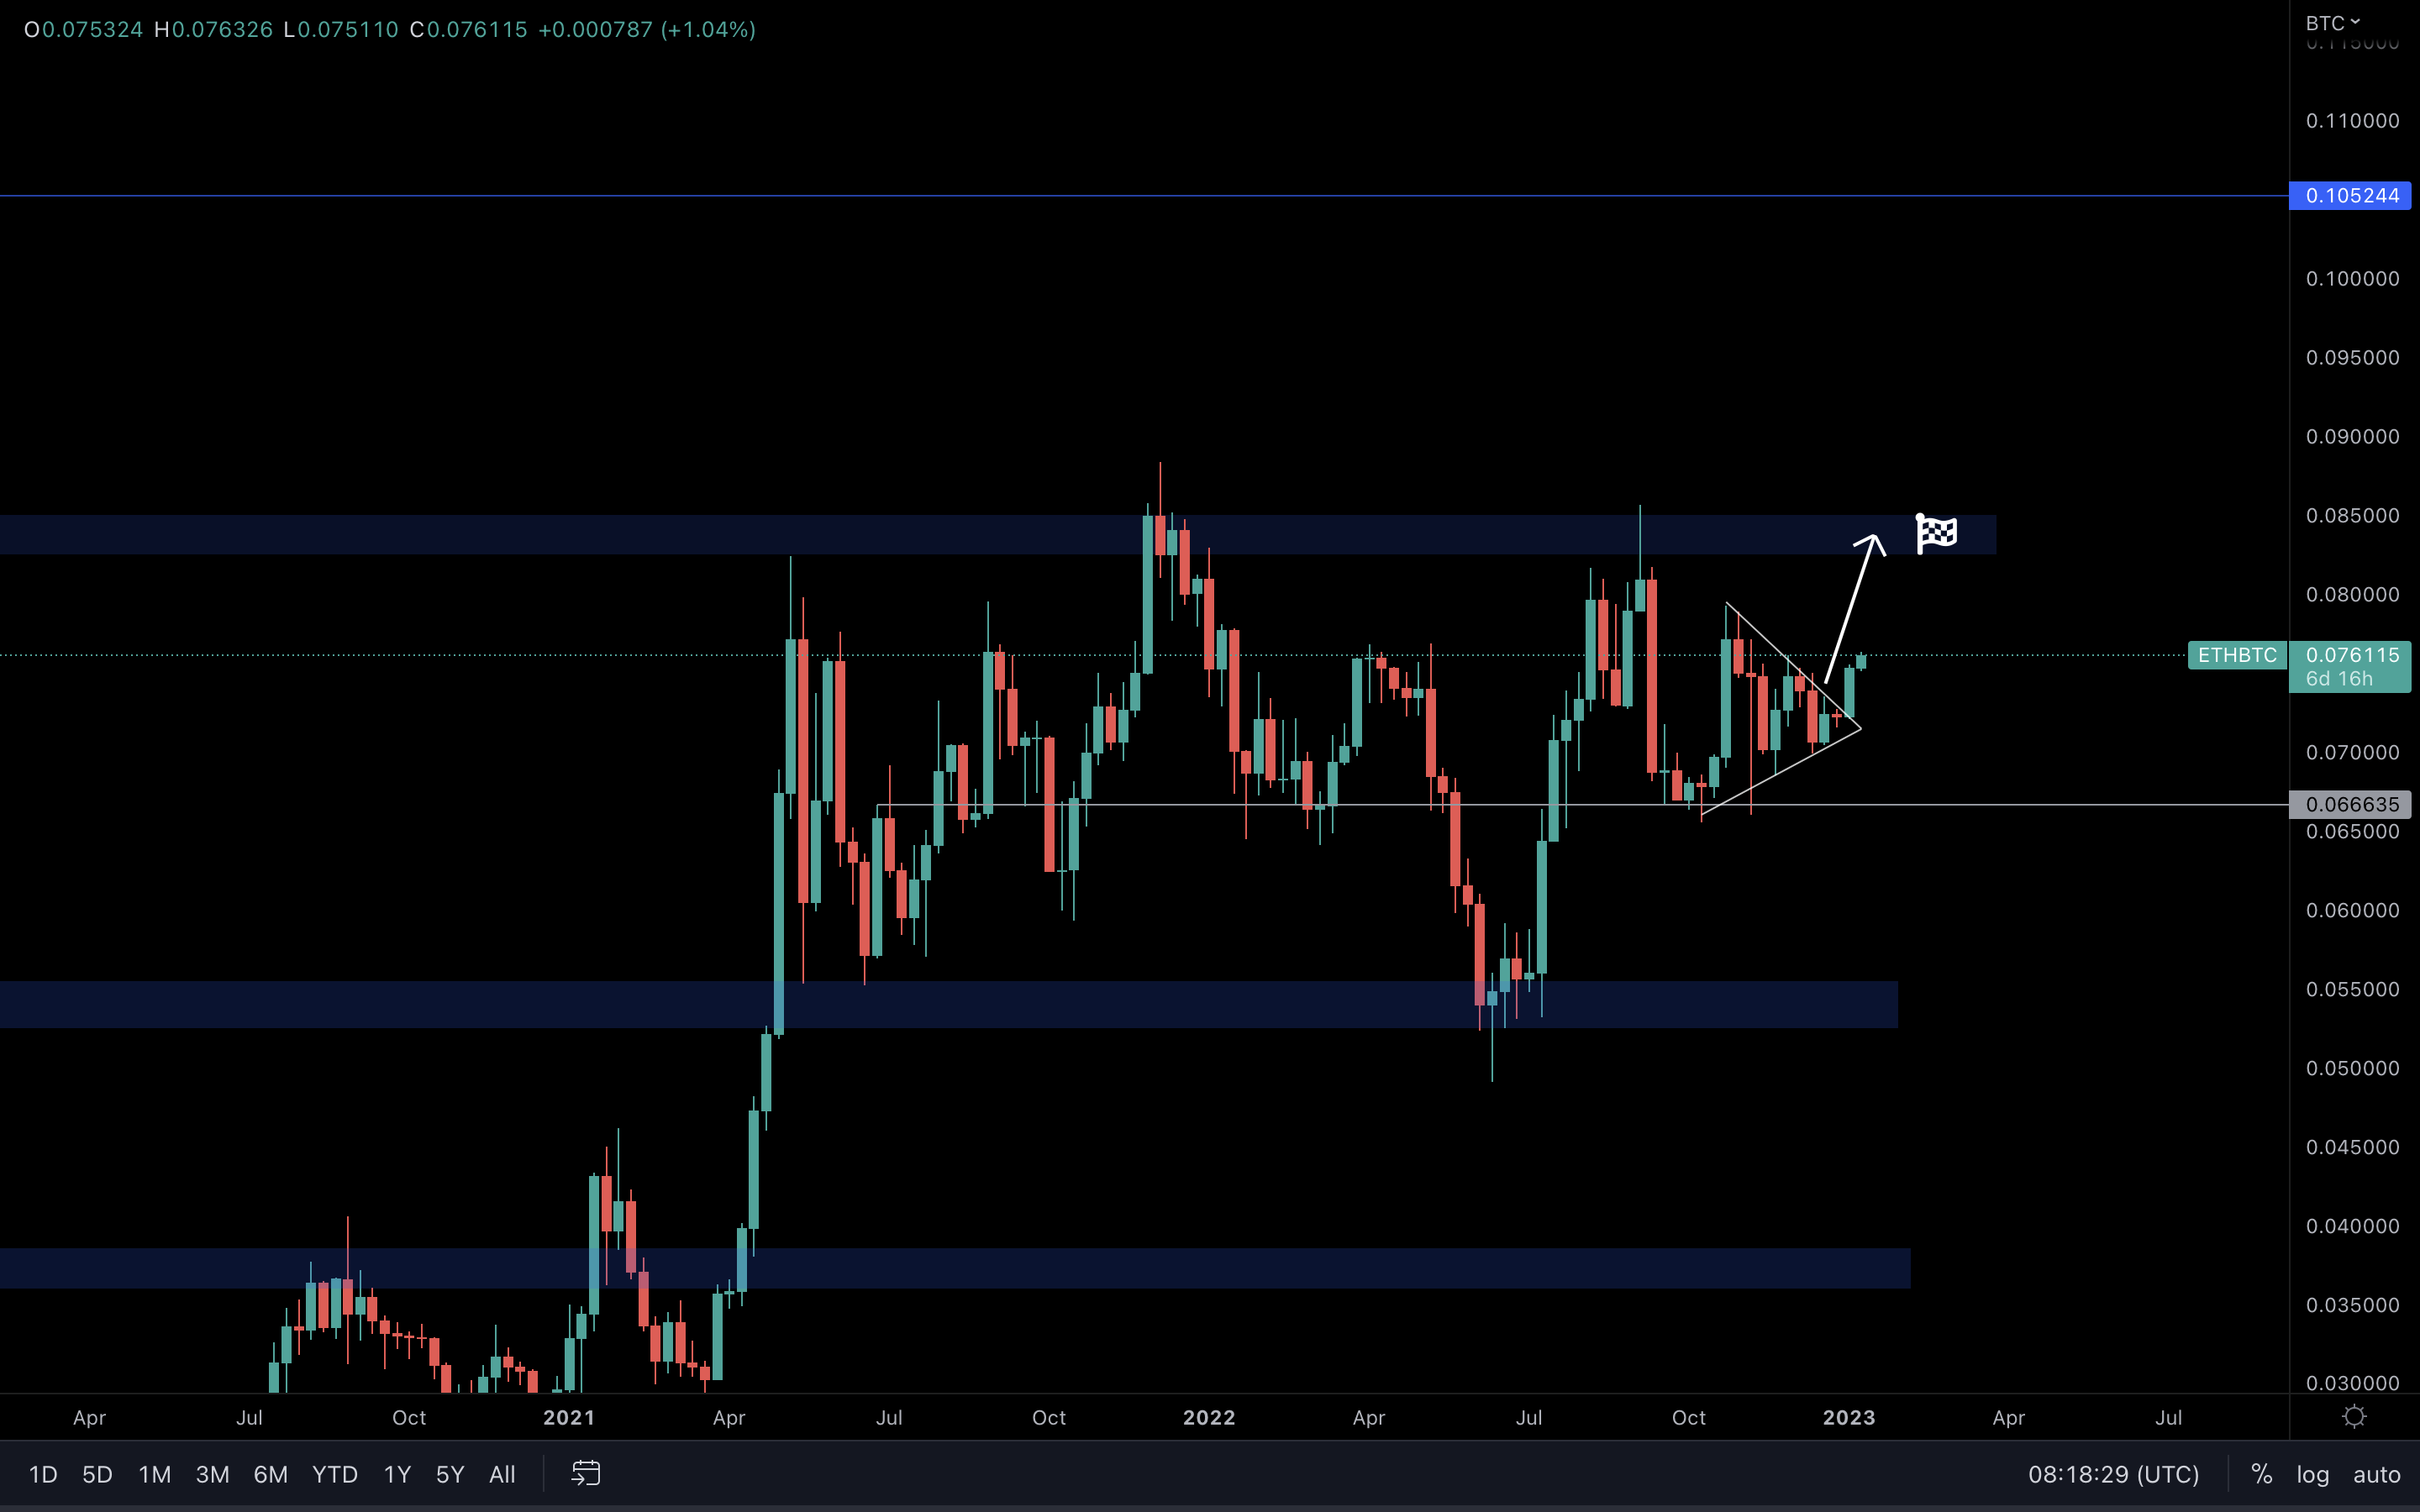
We look at the ETH/BTC chart to understand which of the two is outperforming. When this chart rises, it means Ethereum is outperforming.
The break from the symmetrical triangle is playing out well, so we should continue to see more capital injected into the altcoins market => our pockets get bigger.
SOL | Solana
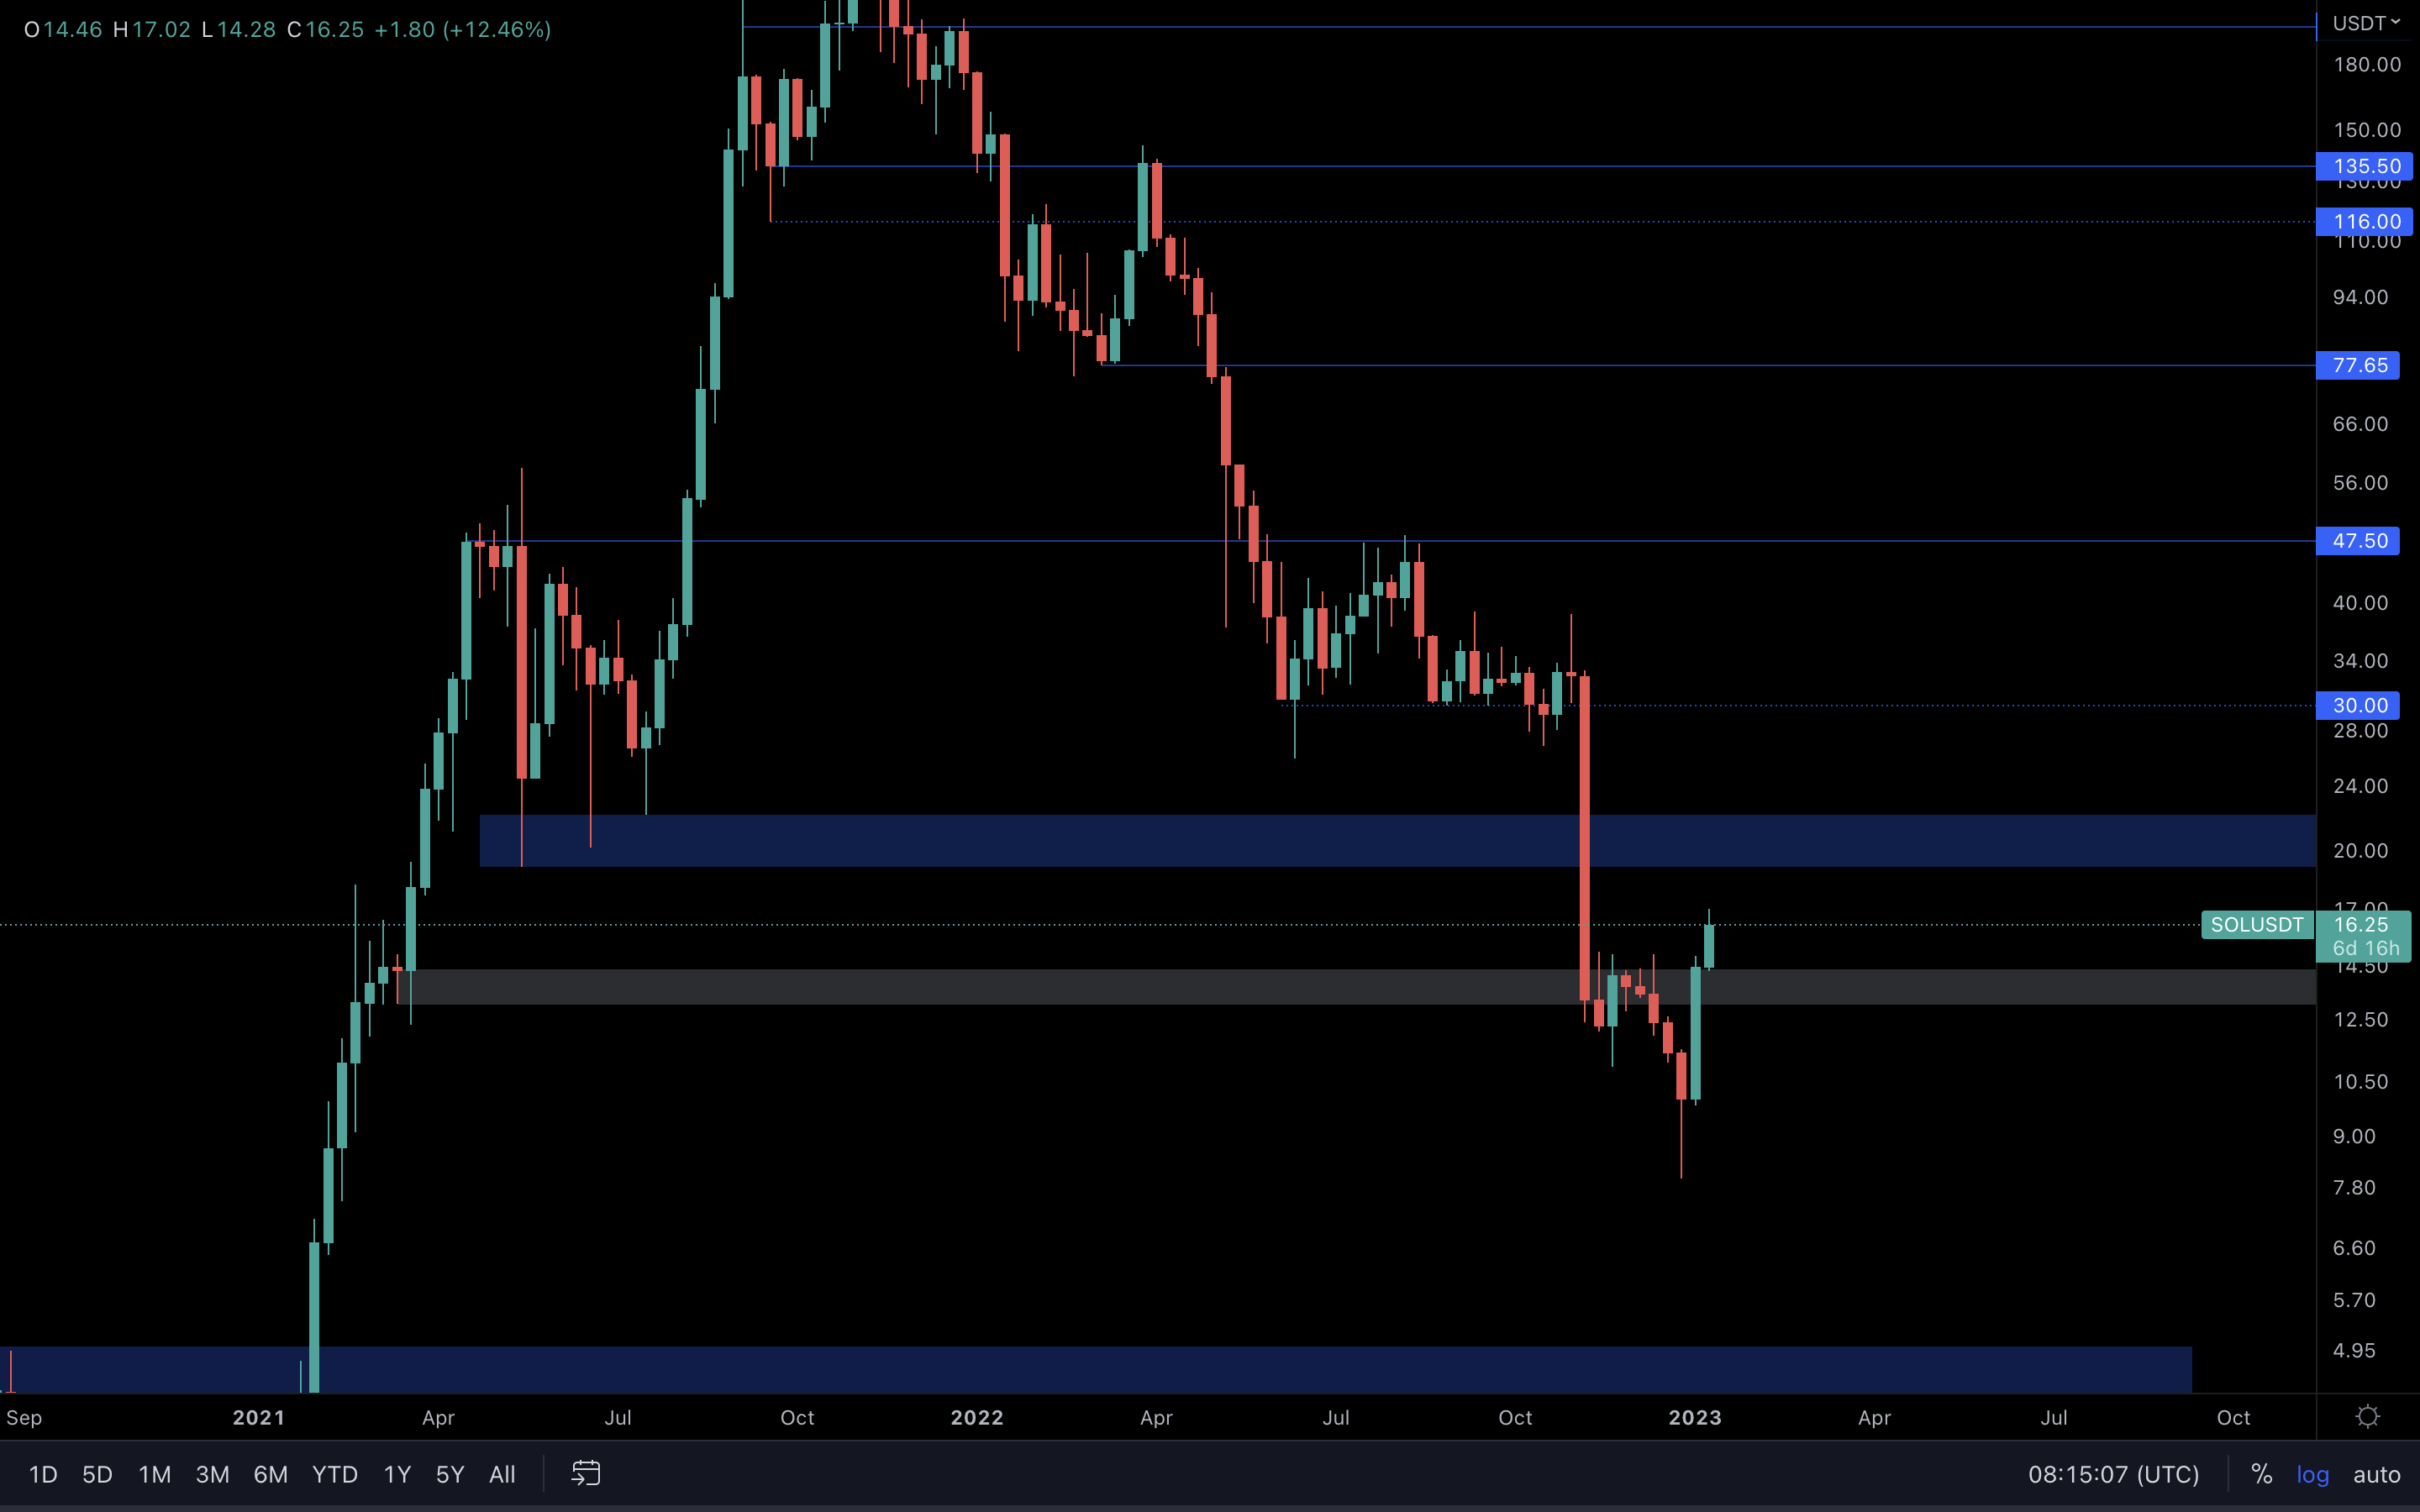
Solana reclaimed $14 and invalidated the bearish scenario (drop to $7.80). As a result, we should now look at the next resistance area of $19 - $22 (blue box) which SOL will likely test soon due to Bitcoin & Ethereum performing well.
RUNE | THORChain
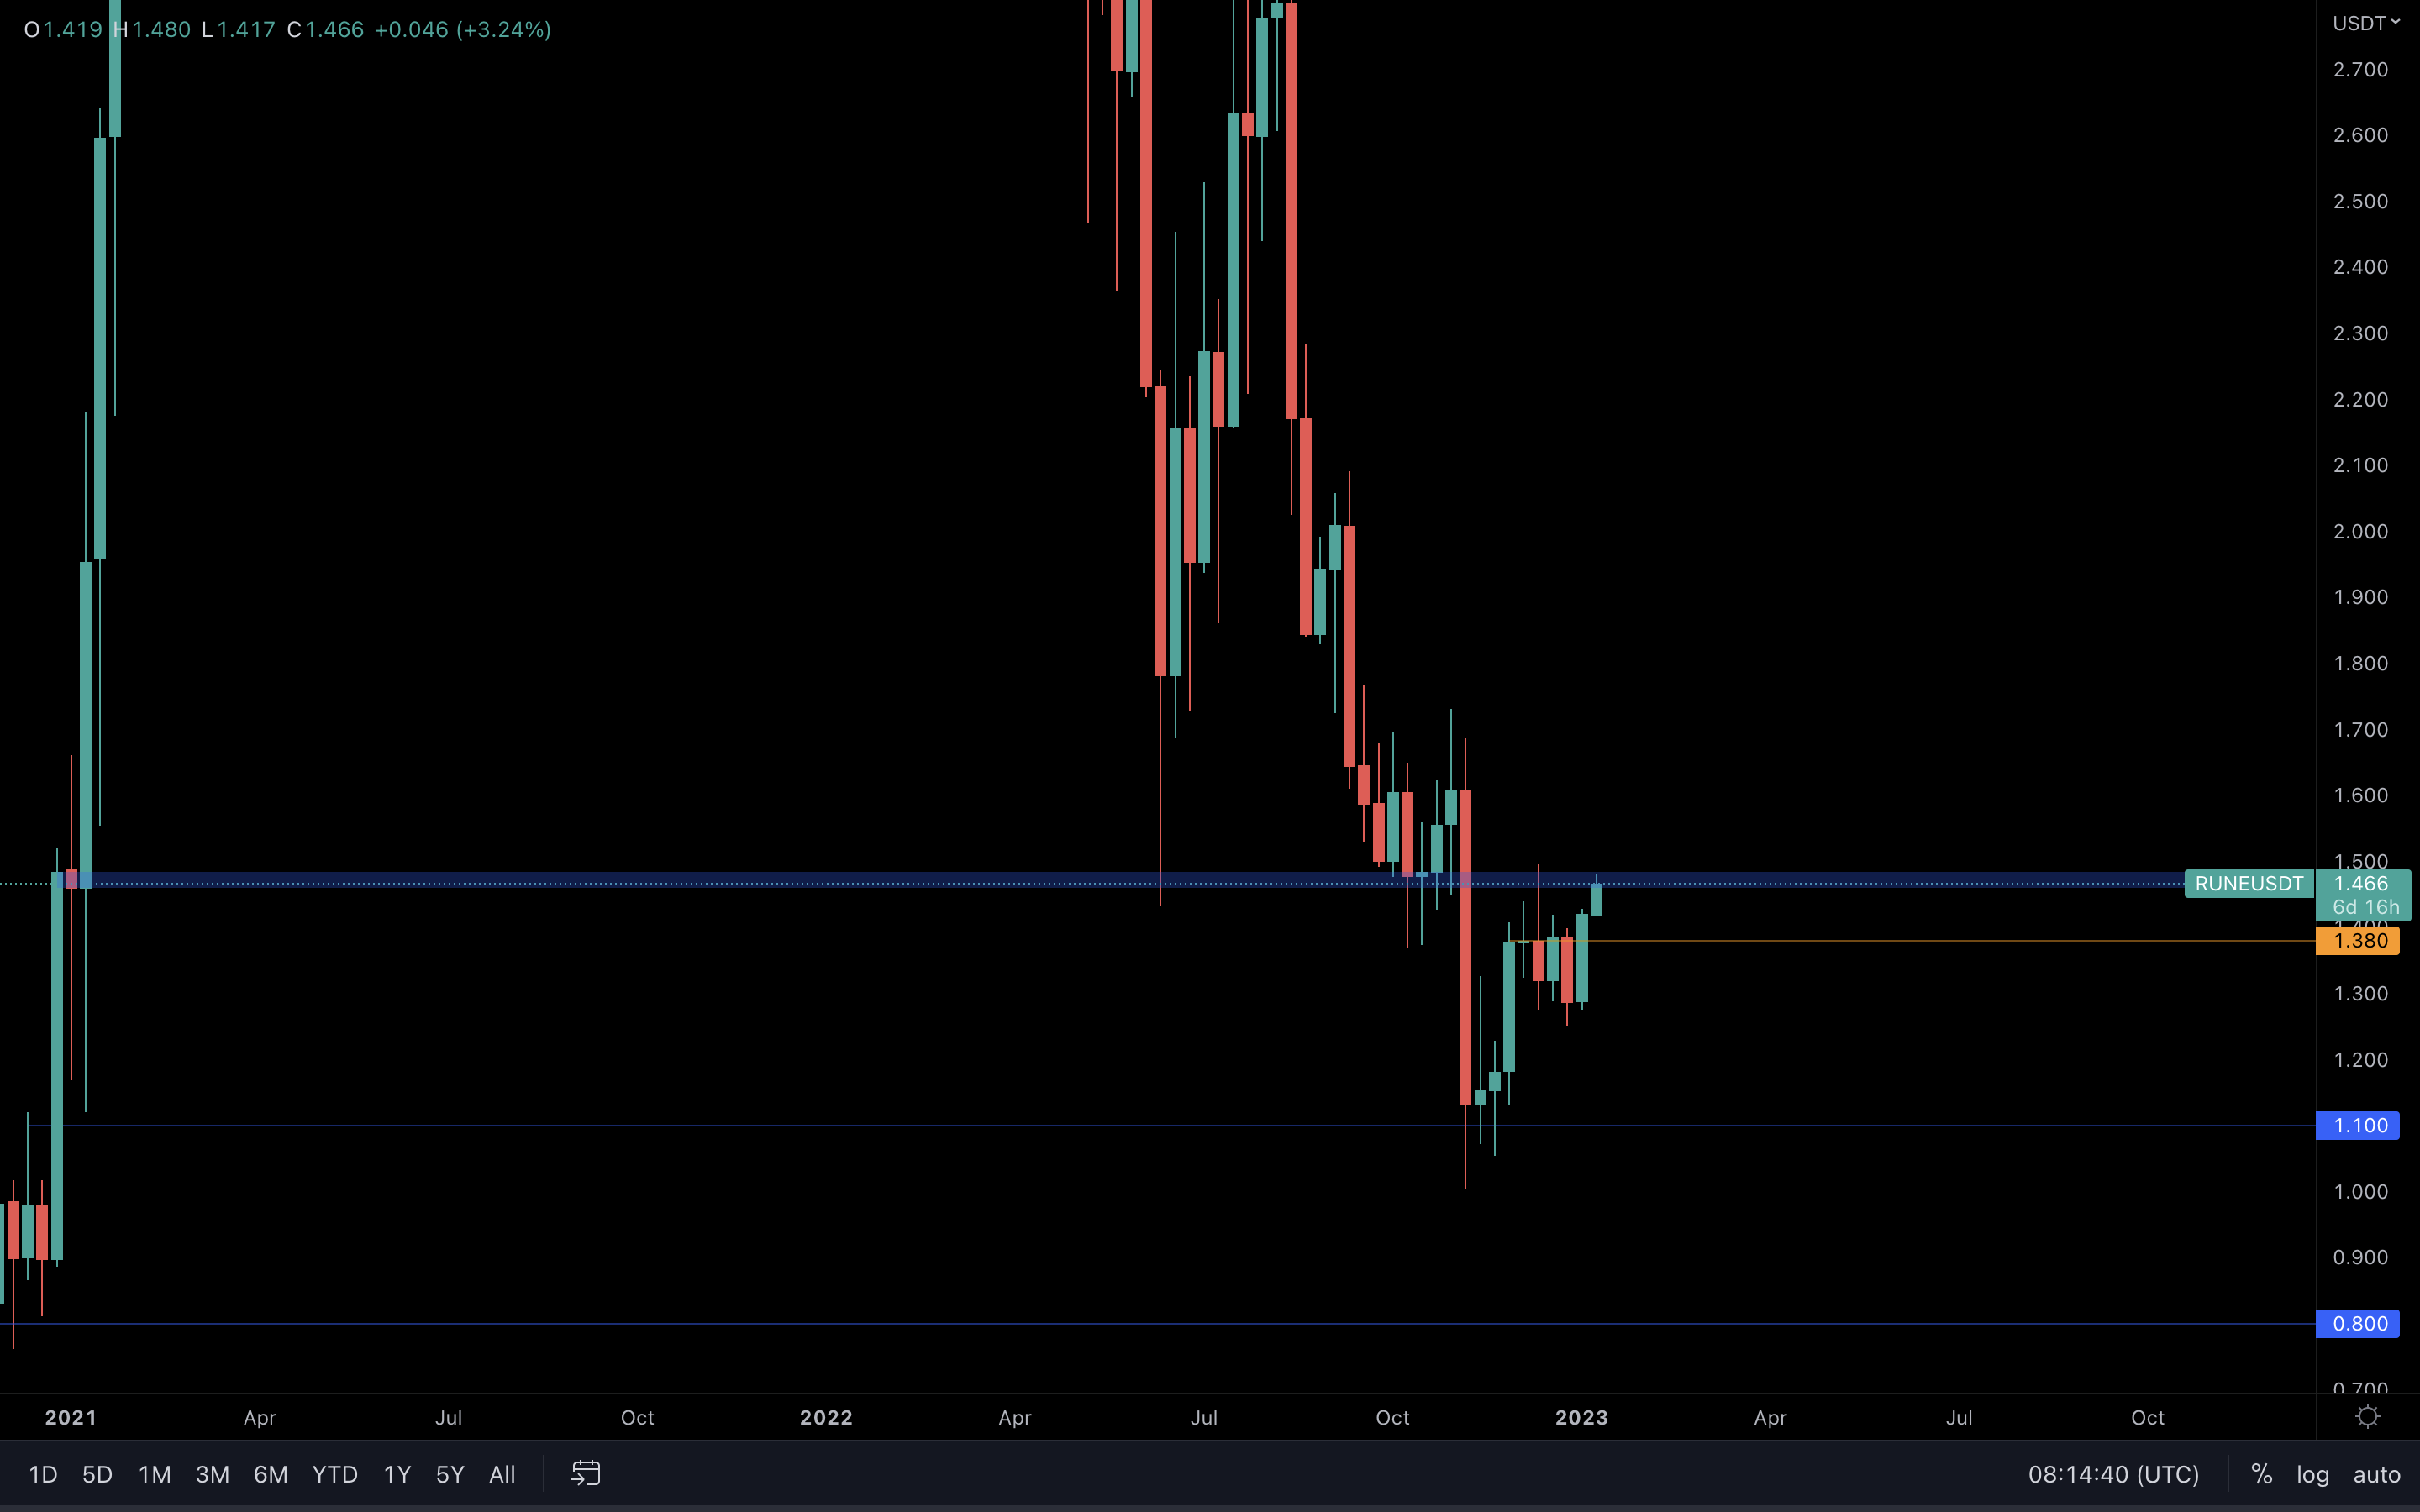
Clean bullish engulfing candle last week - this suggests more upside for RUNE. However, the asset is currently at resistance, so we’ll need a reclaim of its current resistance area ($1.45 - $1.50) before actually confirming a continuation of the bullish price action.
It’s safe to assume that we will see a break of this resistance with the majors’ help.
SNX | Synthetix
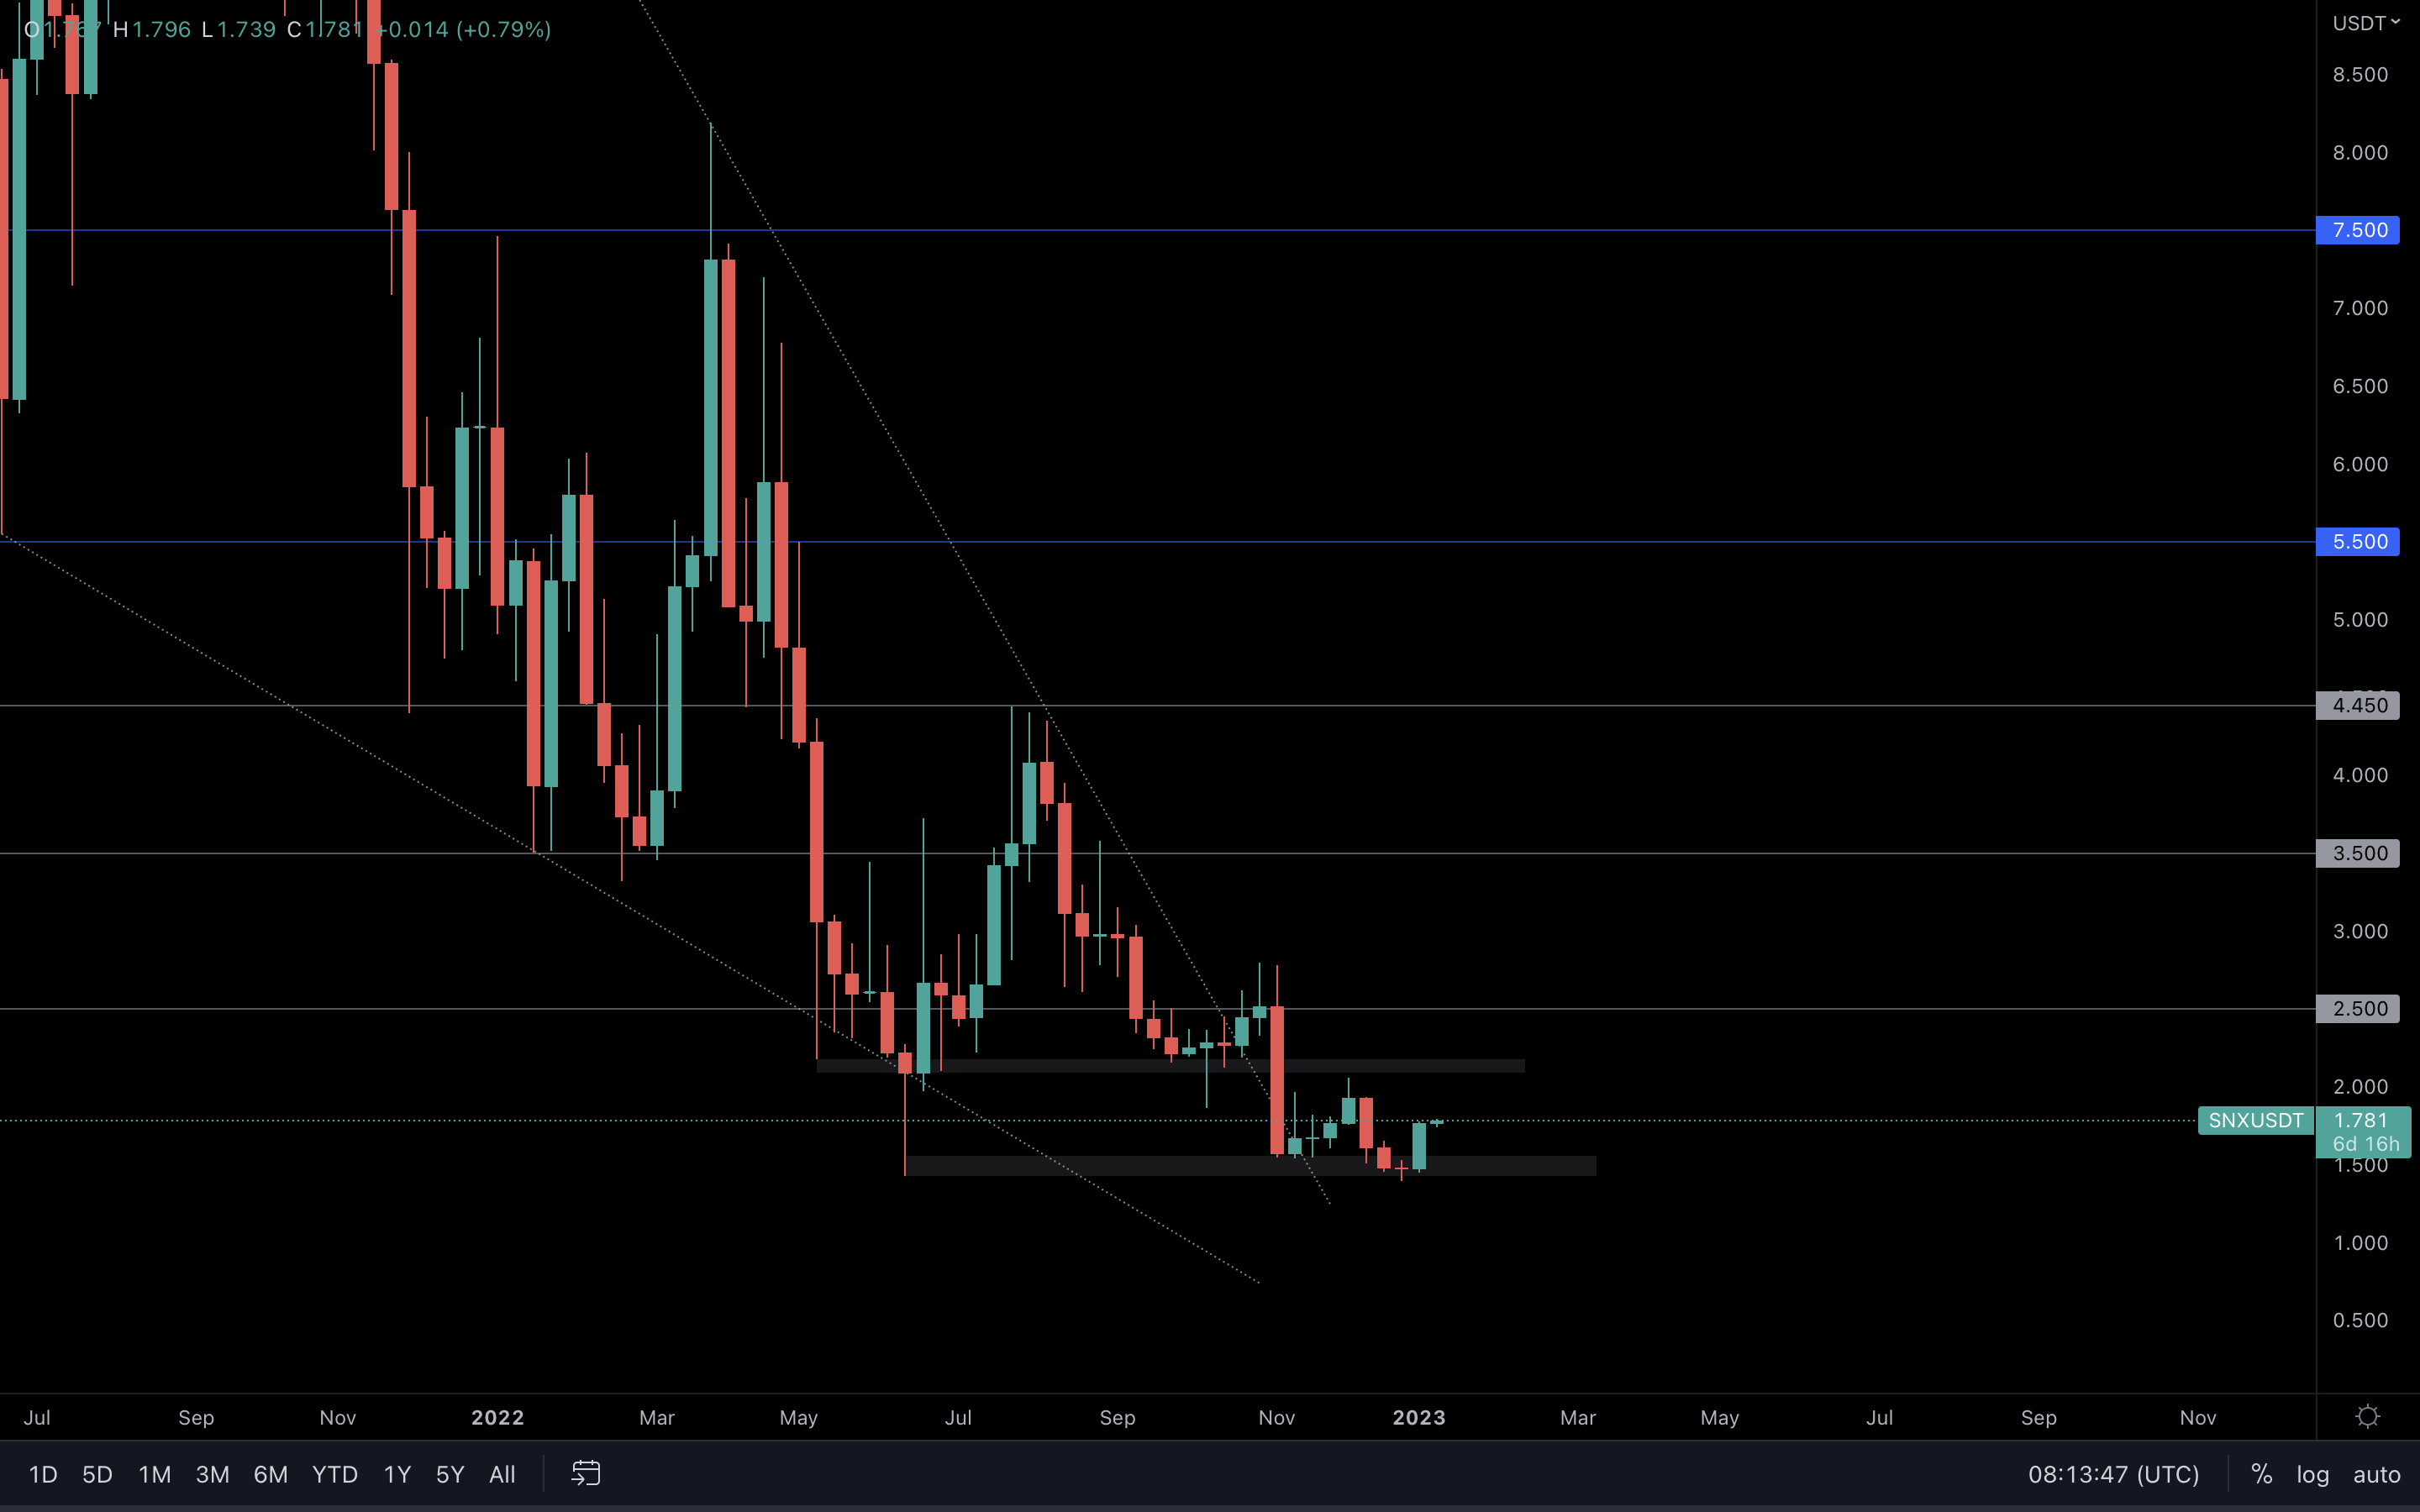
Buyers stepped in nicely at SNX’s june low => demand. Based on the buying pressure we’ve seen last week and the fact that Bitcoin and Ethereum are rising, SNX can test $2 very soon.
On a larger scale, SNX is in a bearish market structure - the trend will not change until we see the setting of a higher low and a higher high.
Cryptonary's Watchlist
DOT | Polkadot
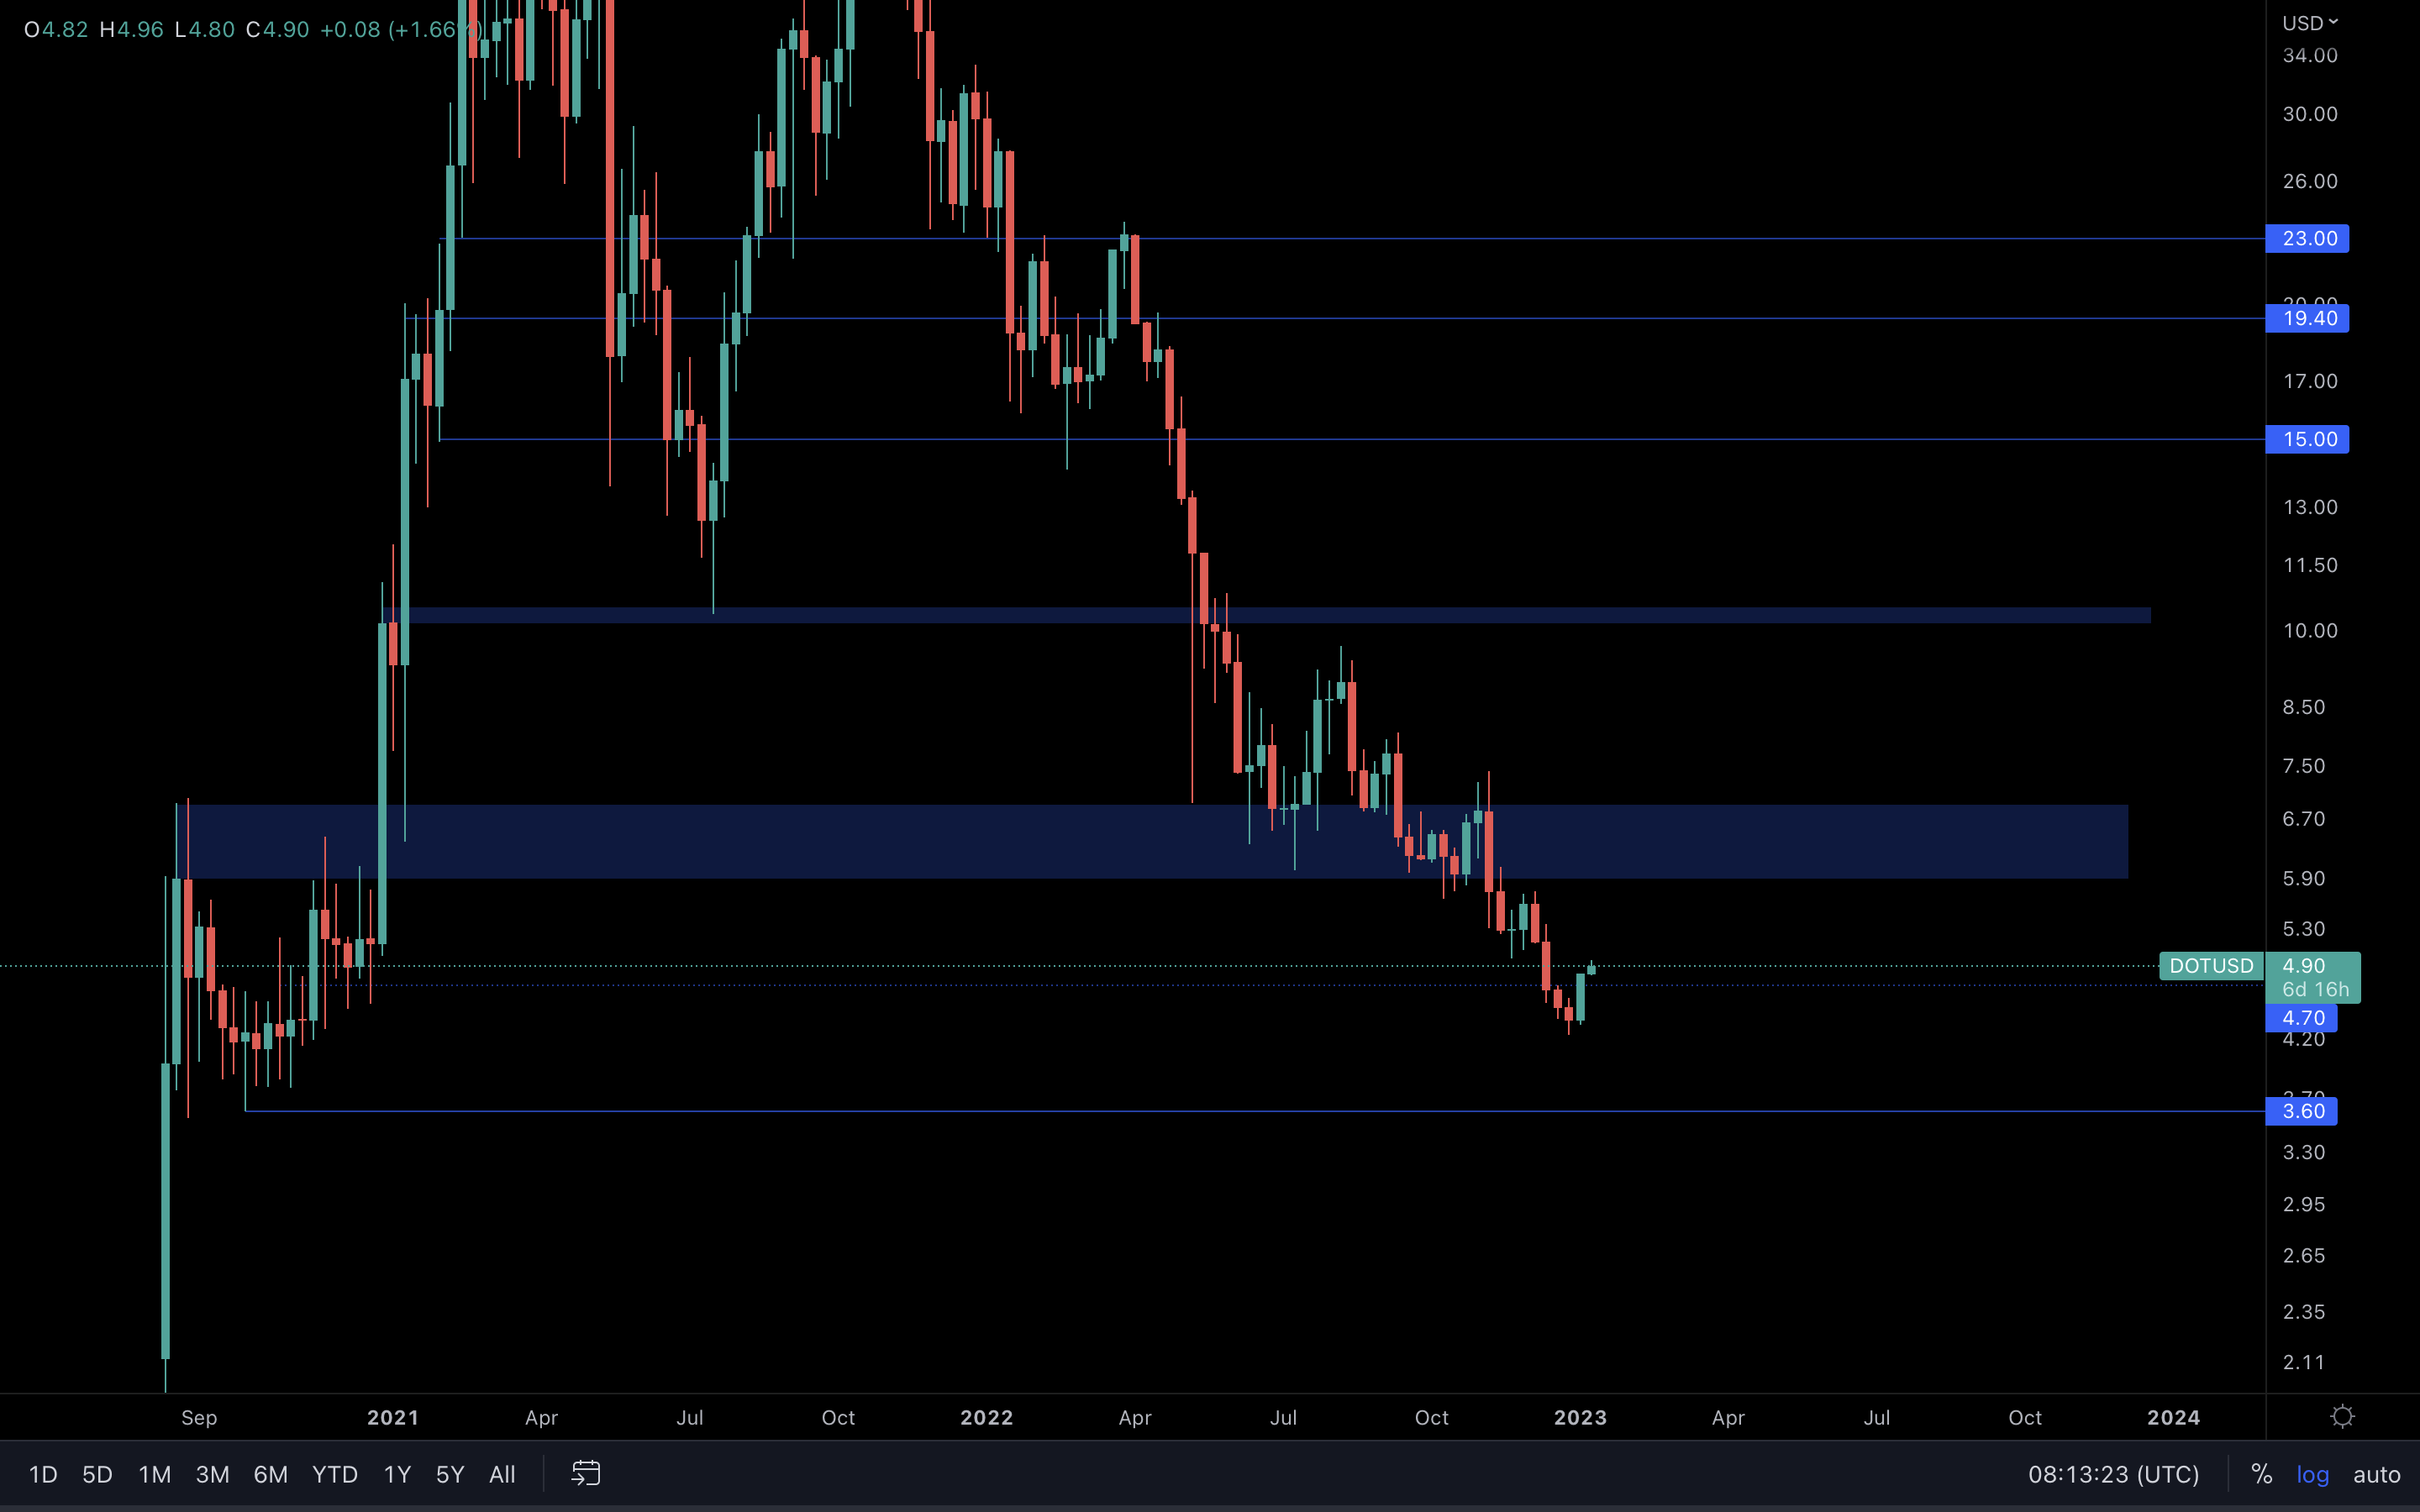
Full-bodied weekly closure above support - DOT saved its ass this time. With the majors’ help, DOT was able to close above $4.70, invalidating a move to $3.60.
The overall trend is still bearish, with lower highs and lower lows formed on a constant basis, so we’re definitely expecting $3.60 to be tested at some point in the future. However, in the short-term, we could see DOT rise to the $6 - $7 resistance area.
SYN | Synapse
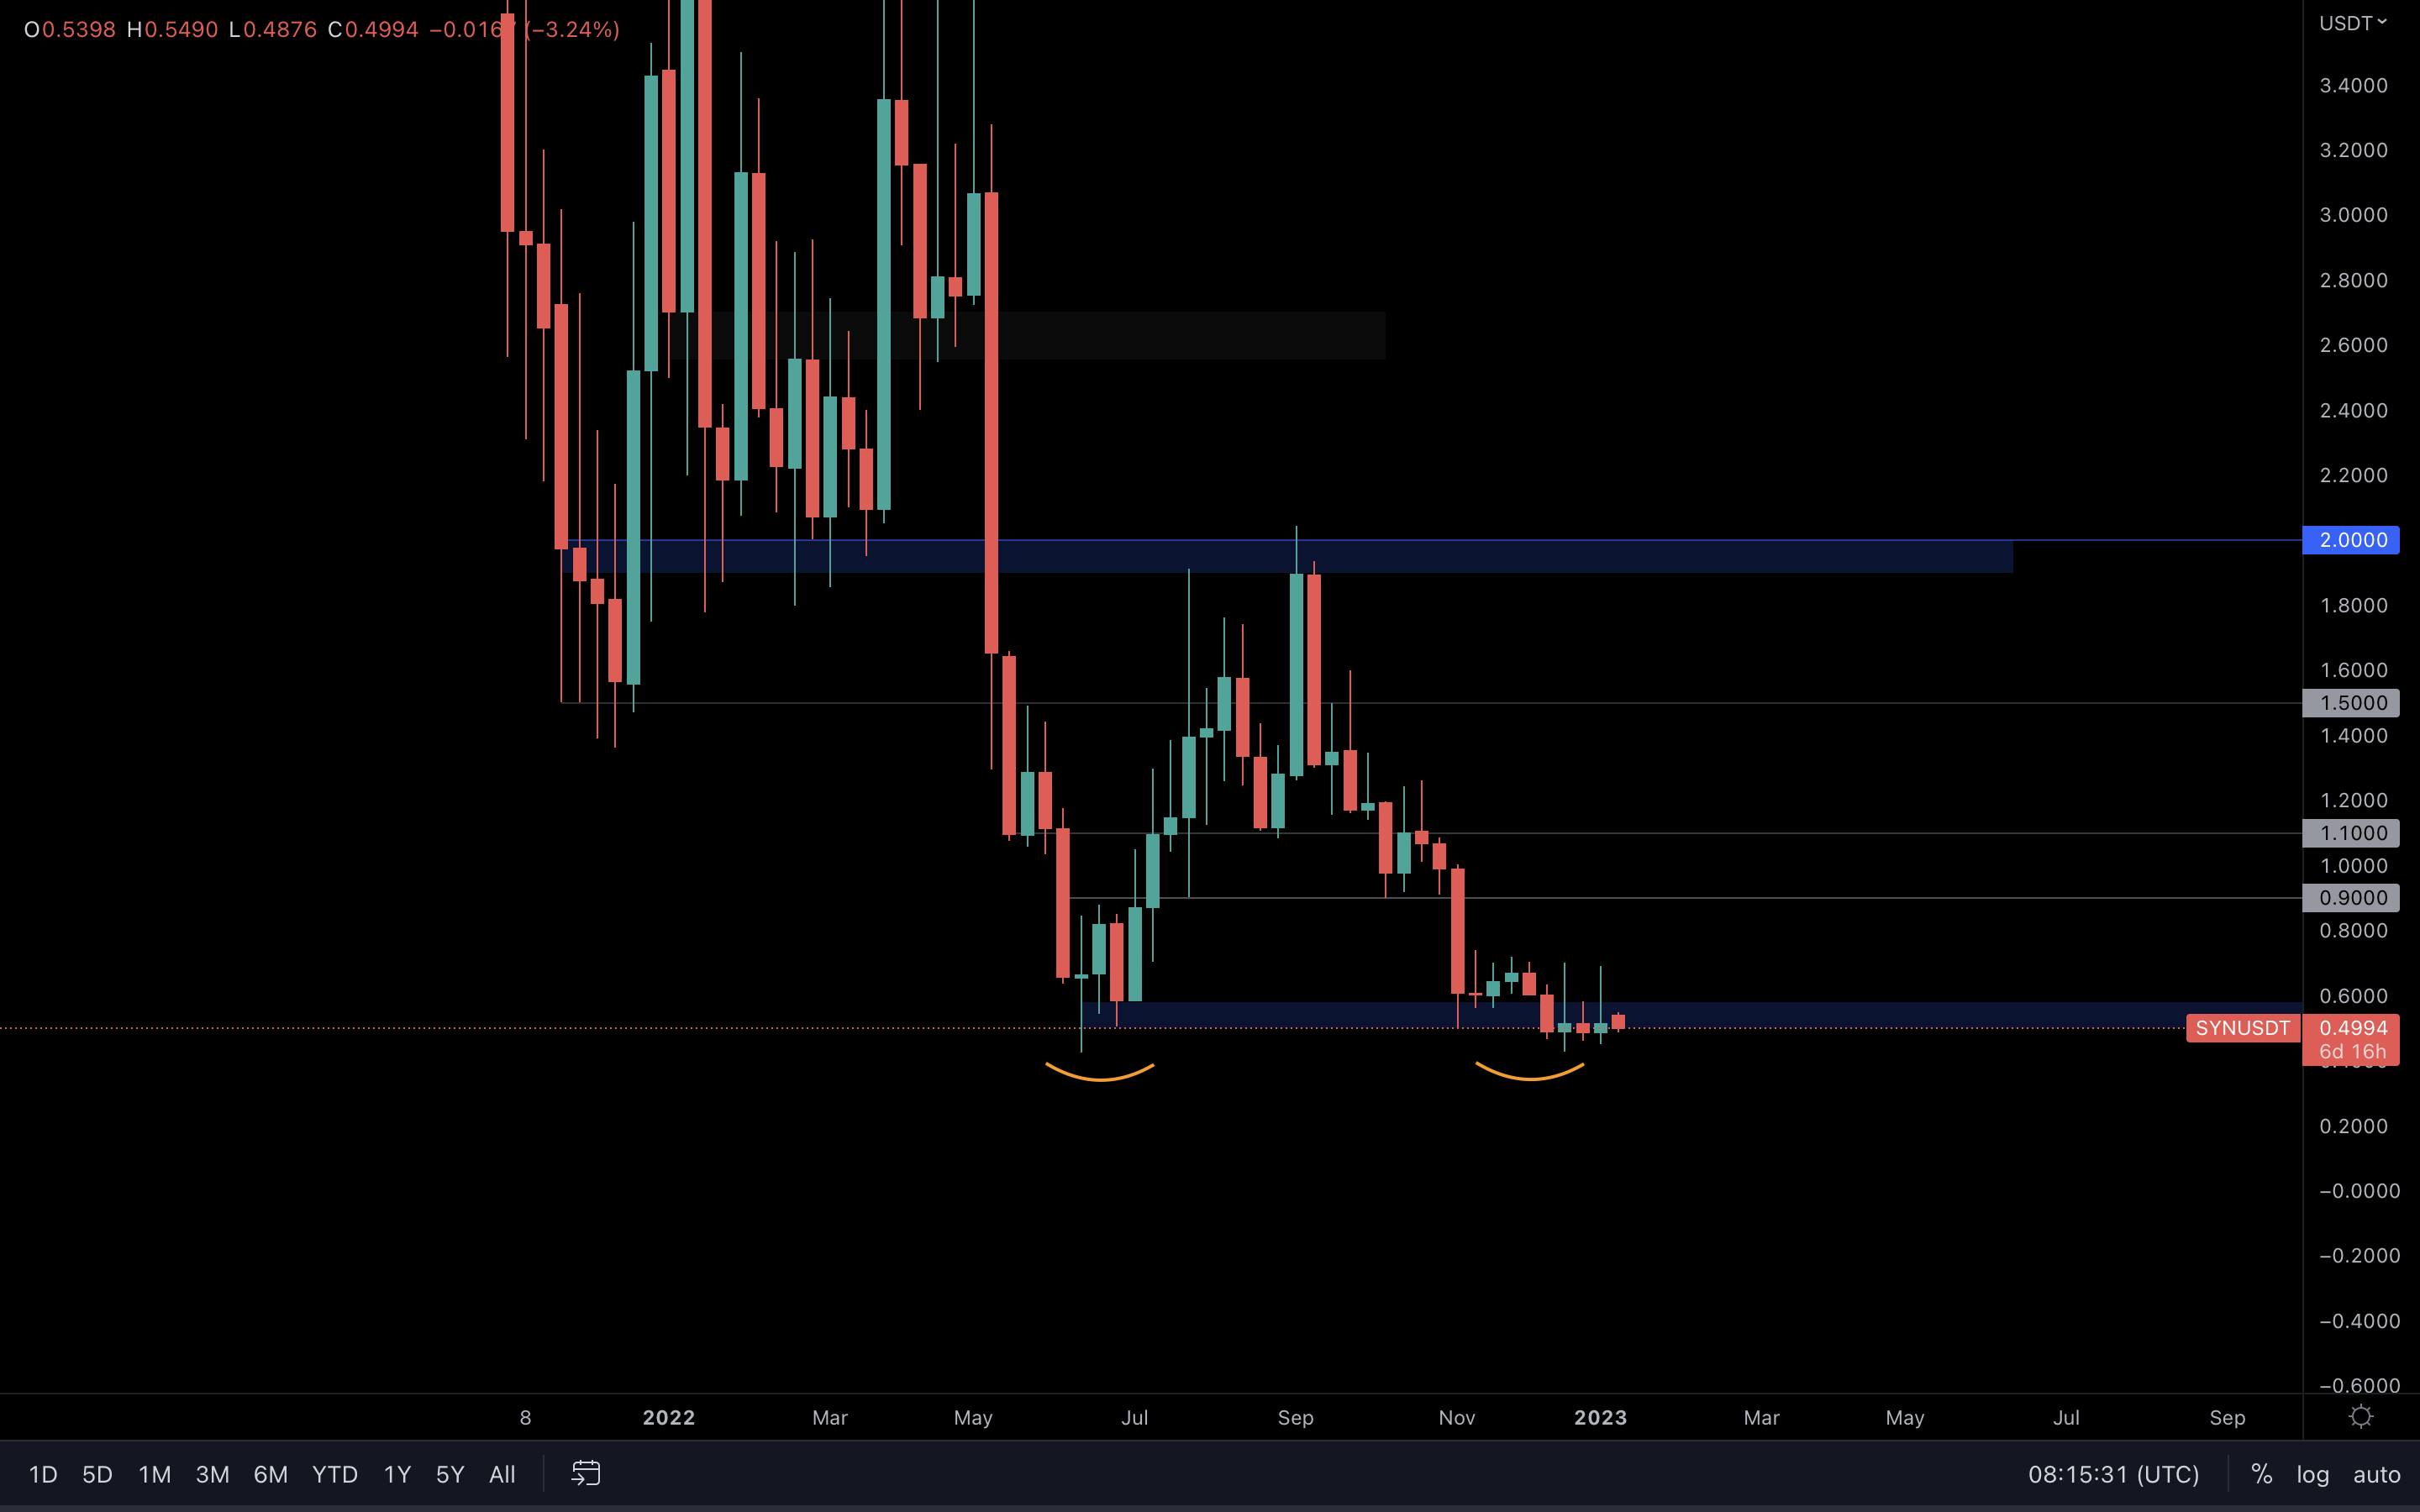
As long as SYN doesn’t drop under its June low (left orange mark), this chart screams “more upside”. However, we have to take into consideration that the previous weekly closures have formed under resistance - the safest bet here is to wait for a break above the blue box to confirm a future direction.
OP | Optimism
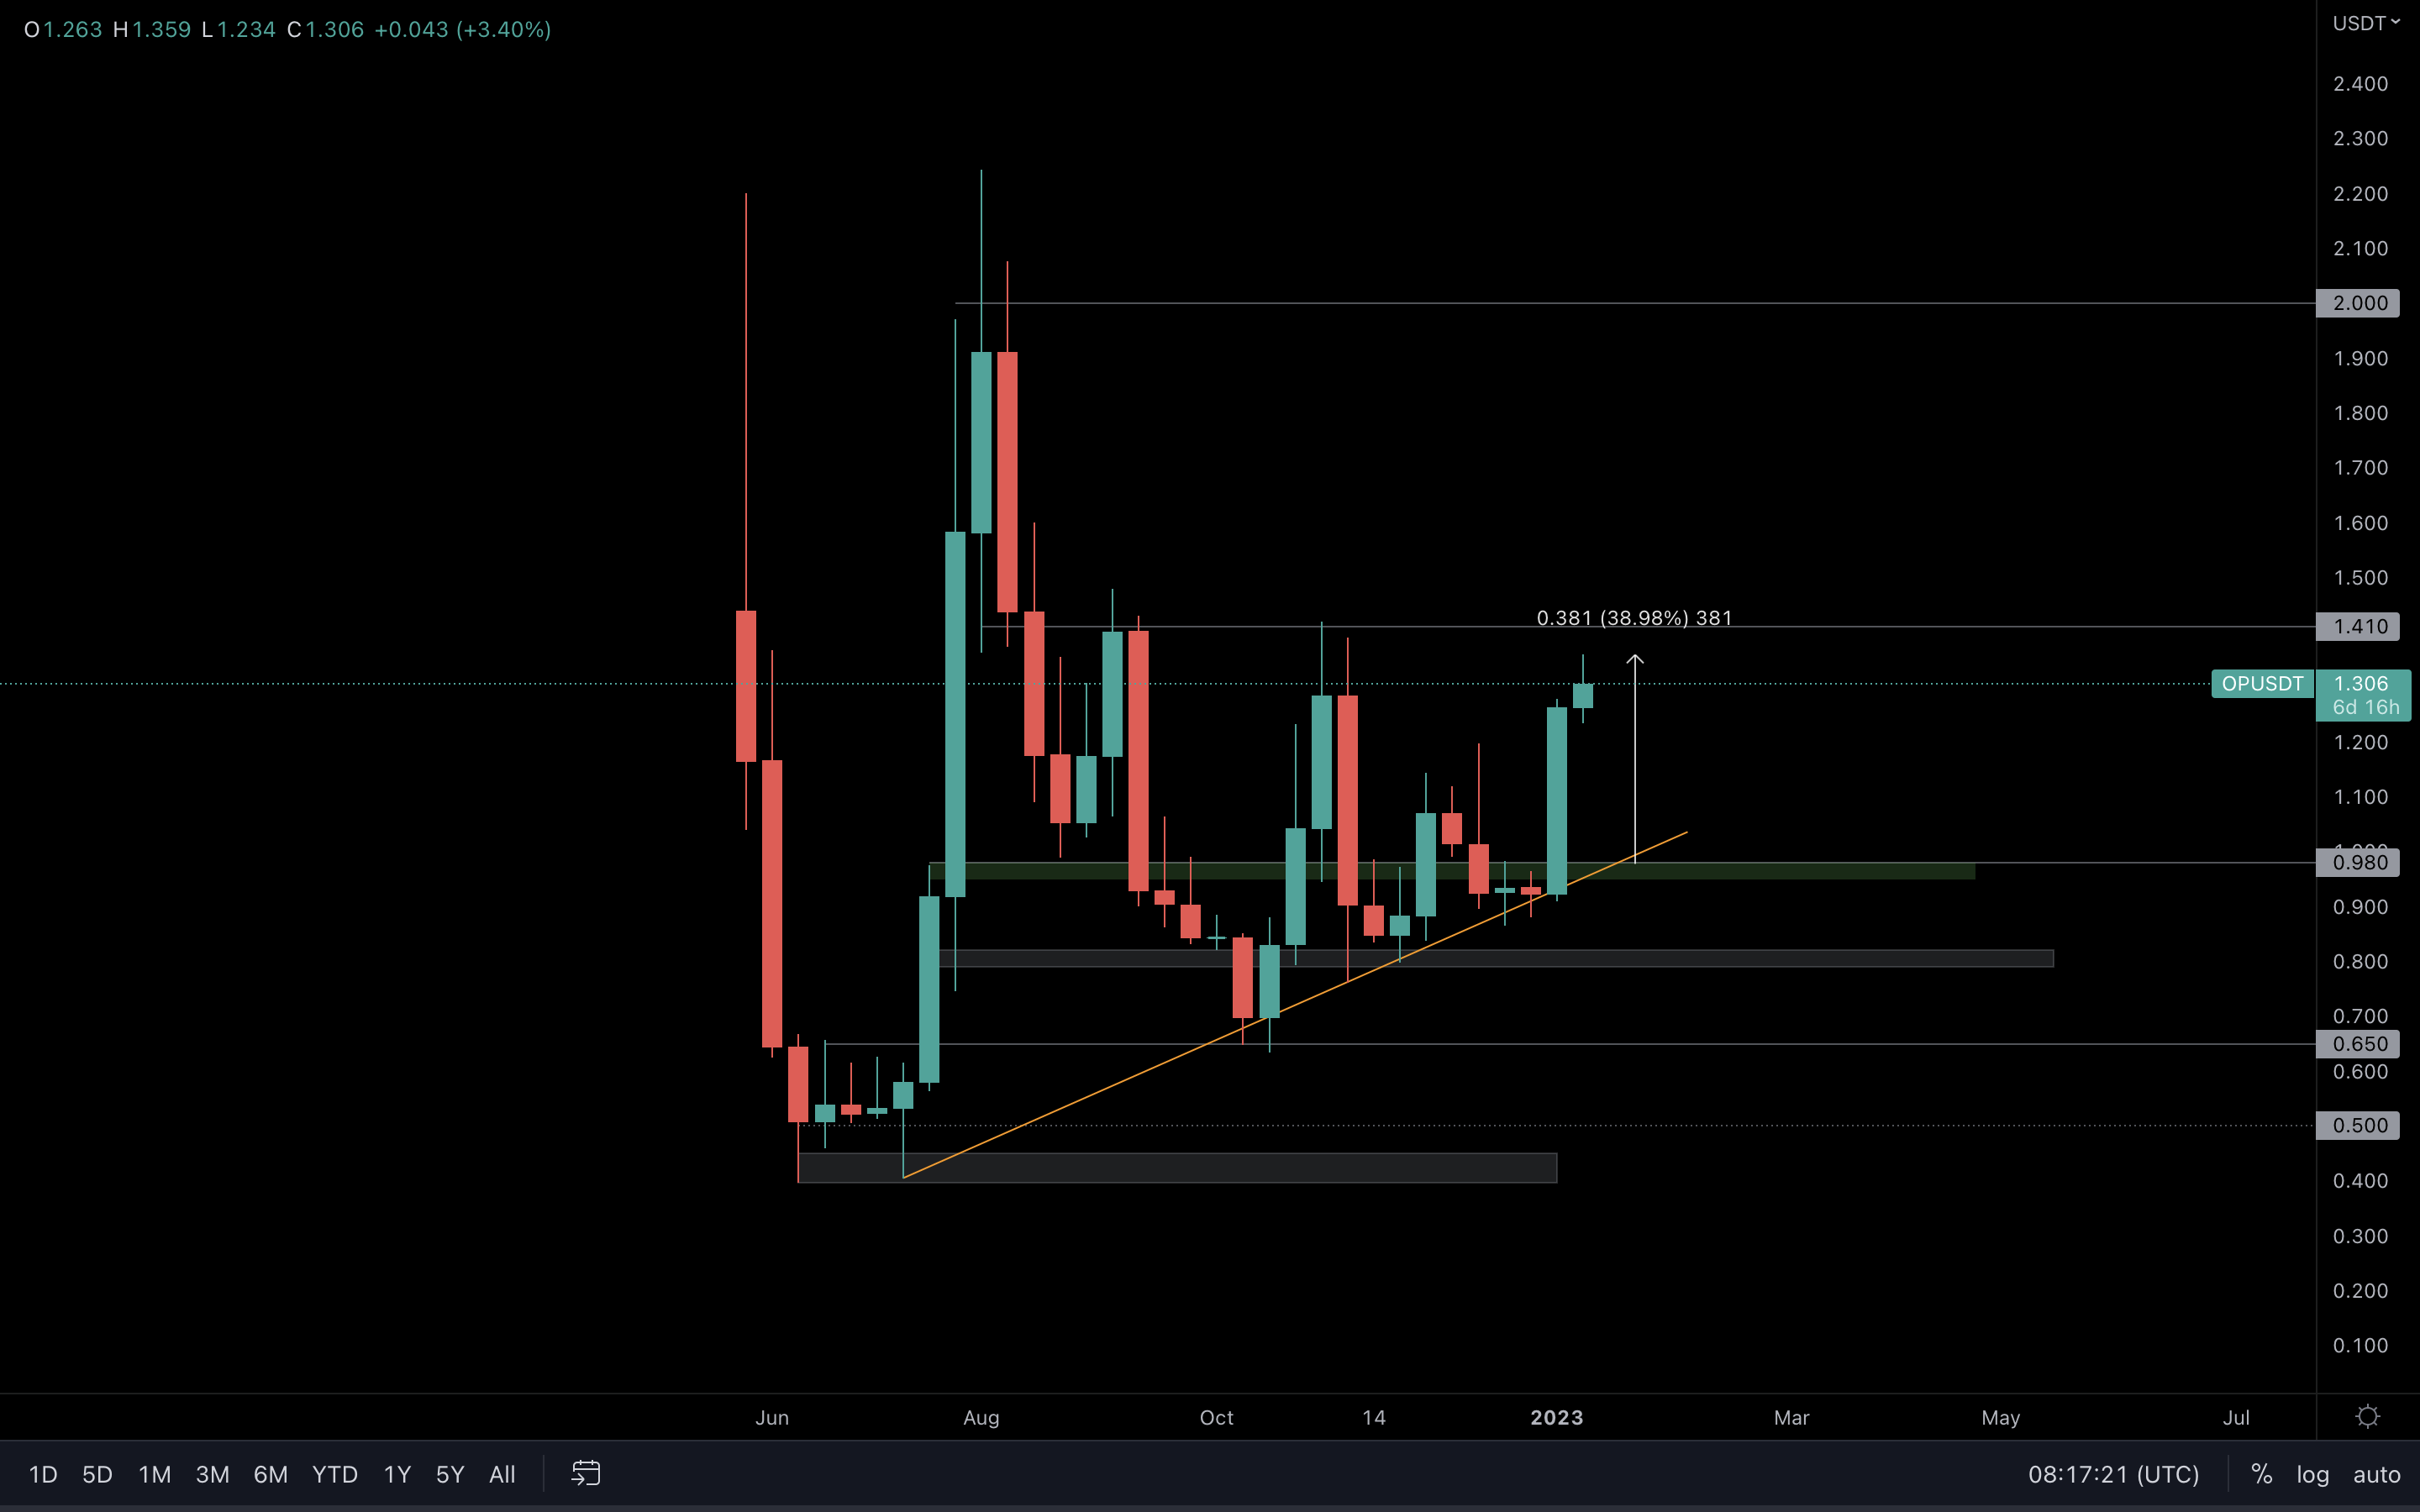
If you’re following our daily analysis inside our Discord, then you already know we nailed this one. OP has risen over 38% after reclaiming $0.98 and is approaching our target of $1.41.
Whether OP can rise even higher than that remains to be seen, but there’s absolutely no point in jumping on this now. The R/R ratio is 💩, and if you haven’t already caught this move, then you should stay away from it.
LDO | Lido DAO
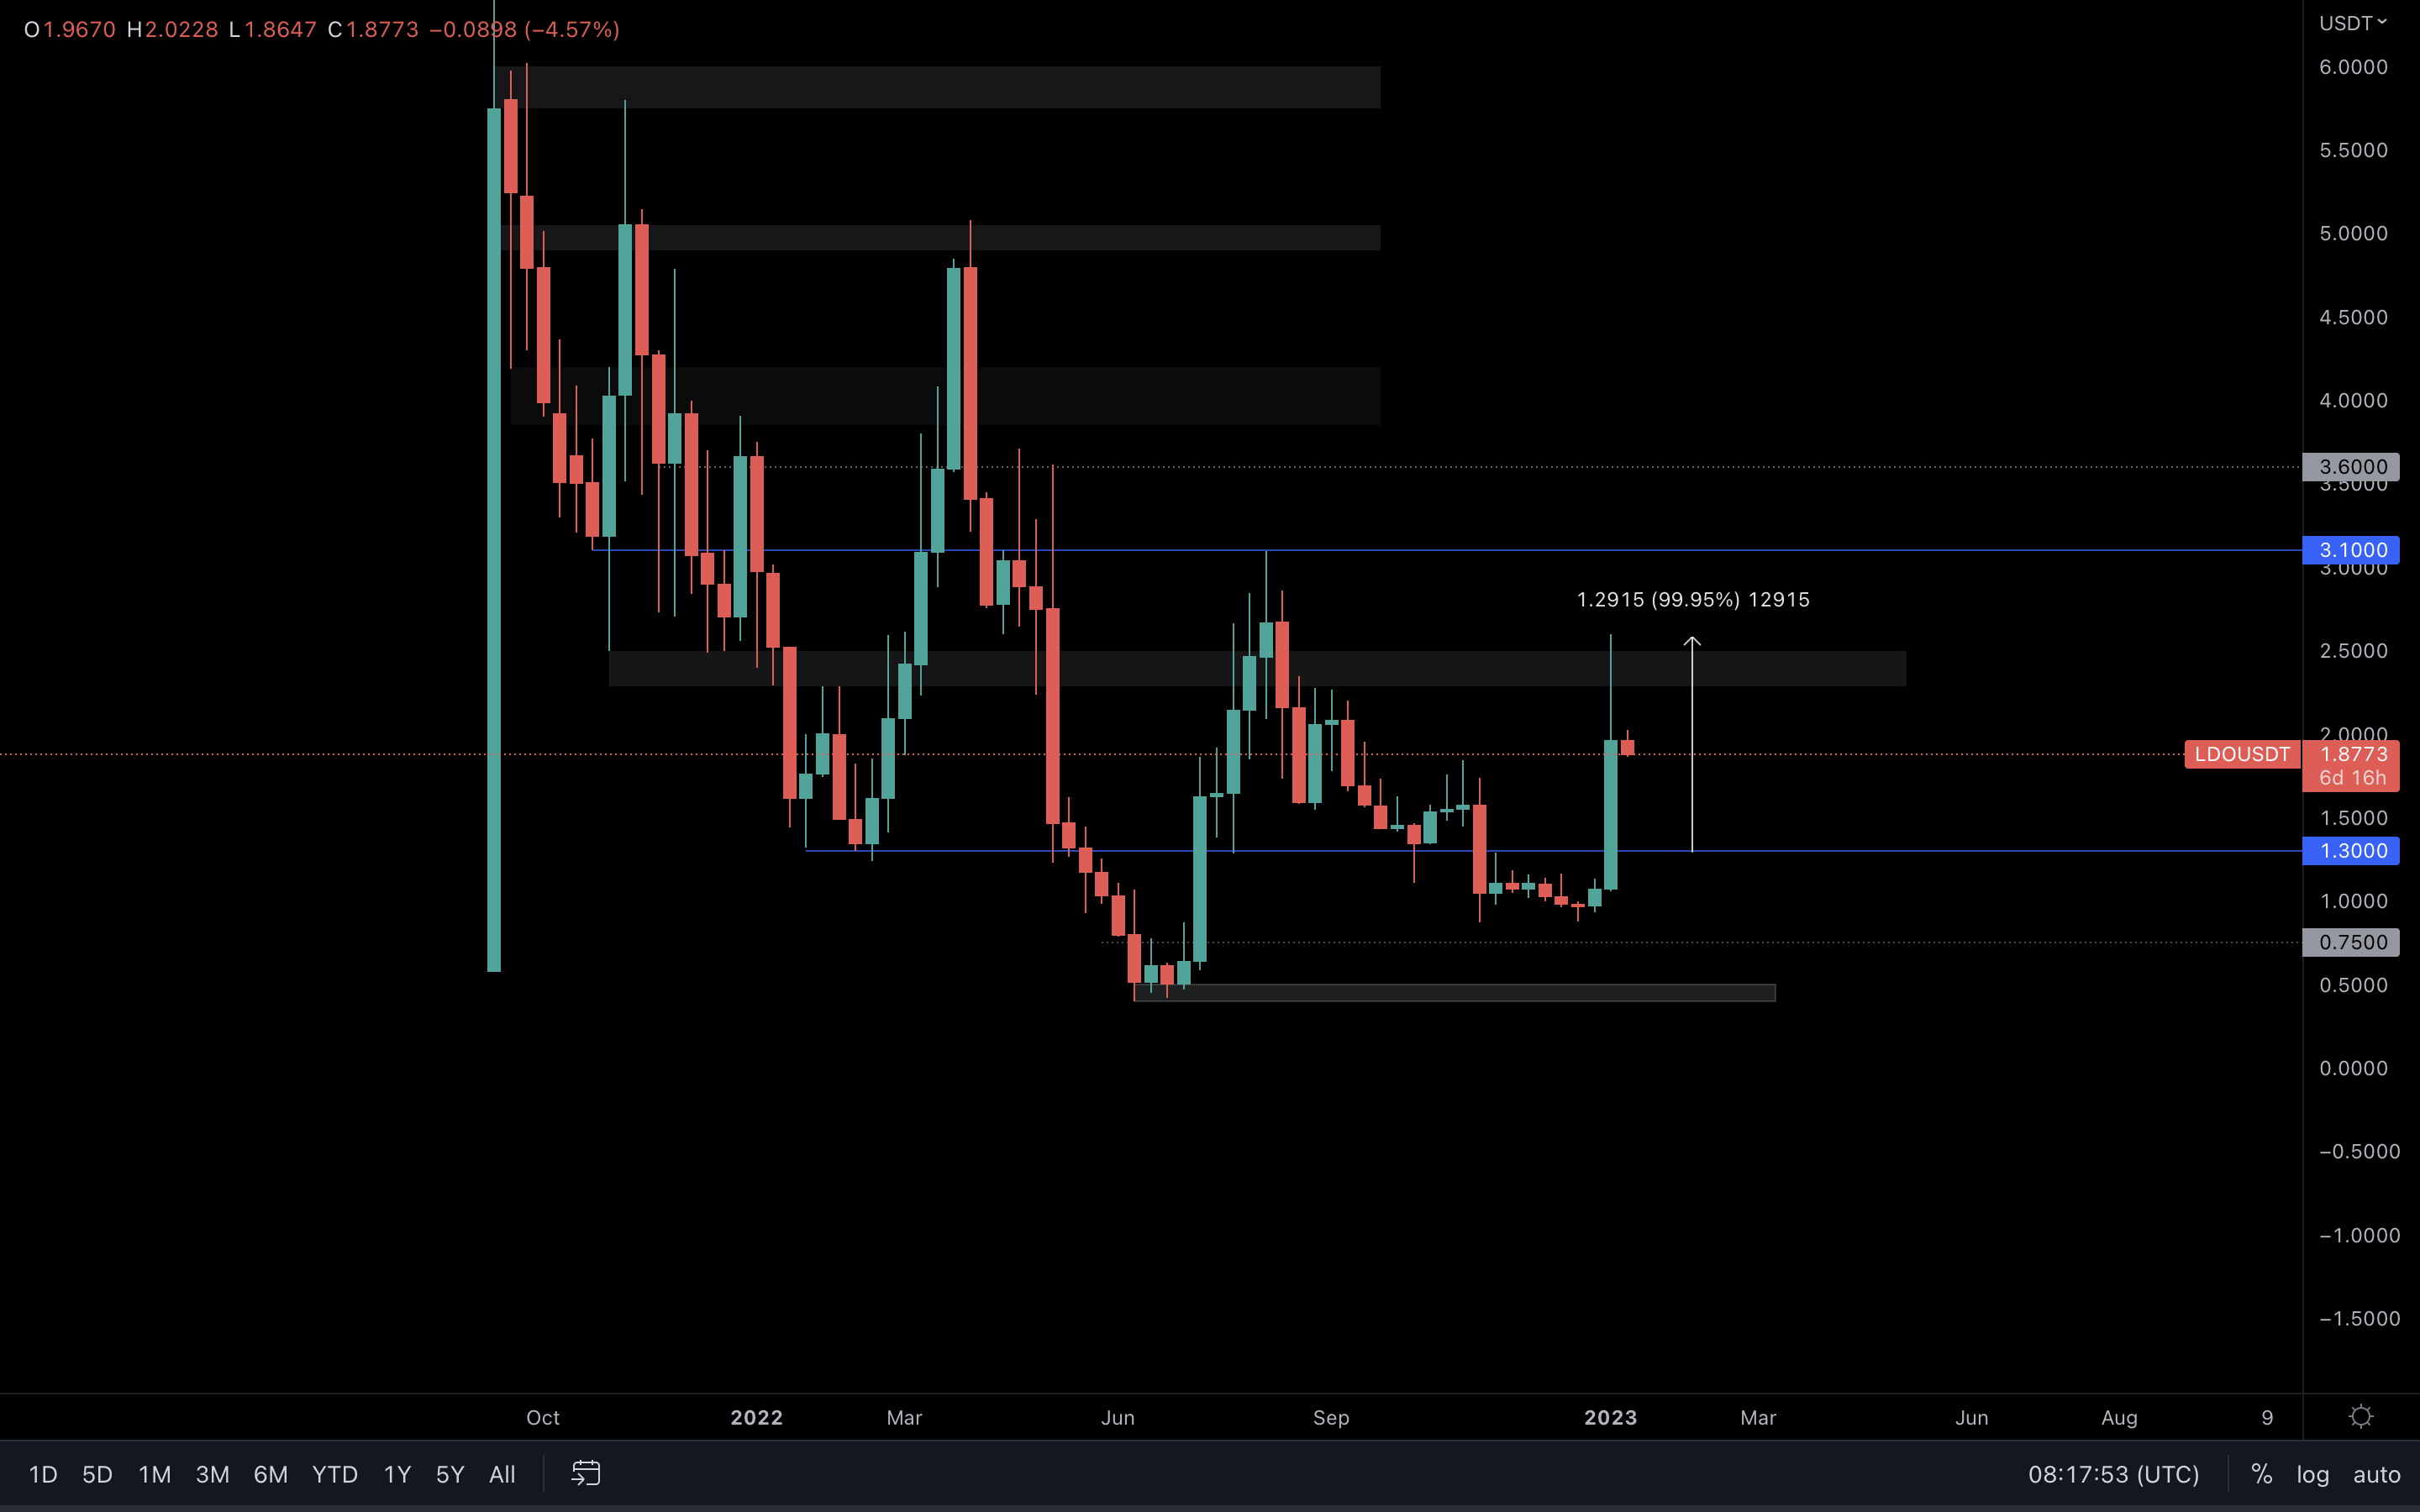
One of the most surprising plays in the last week - and we nailed this one as well. After reclaiming $1.30, LDO has risen by 100% in a matter of three days.
This was another opportunity we spotted and shared with our community, and our target was $1.80 which has been absolutely obliterated.
$1.80 has been reclaimed on the daily timeframe, but we can see a lot of selling pressure at the gray box ($2.25 - $2.50) on the weekly timeframe. As long as LDO stays above $1.80, then a push toward that box is on the cards.
THOR | THORSwap
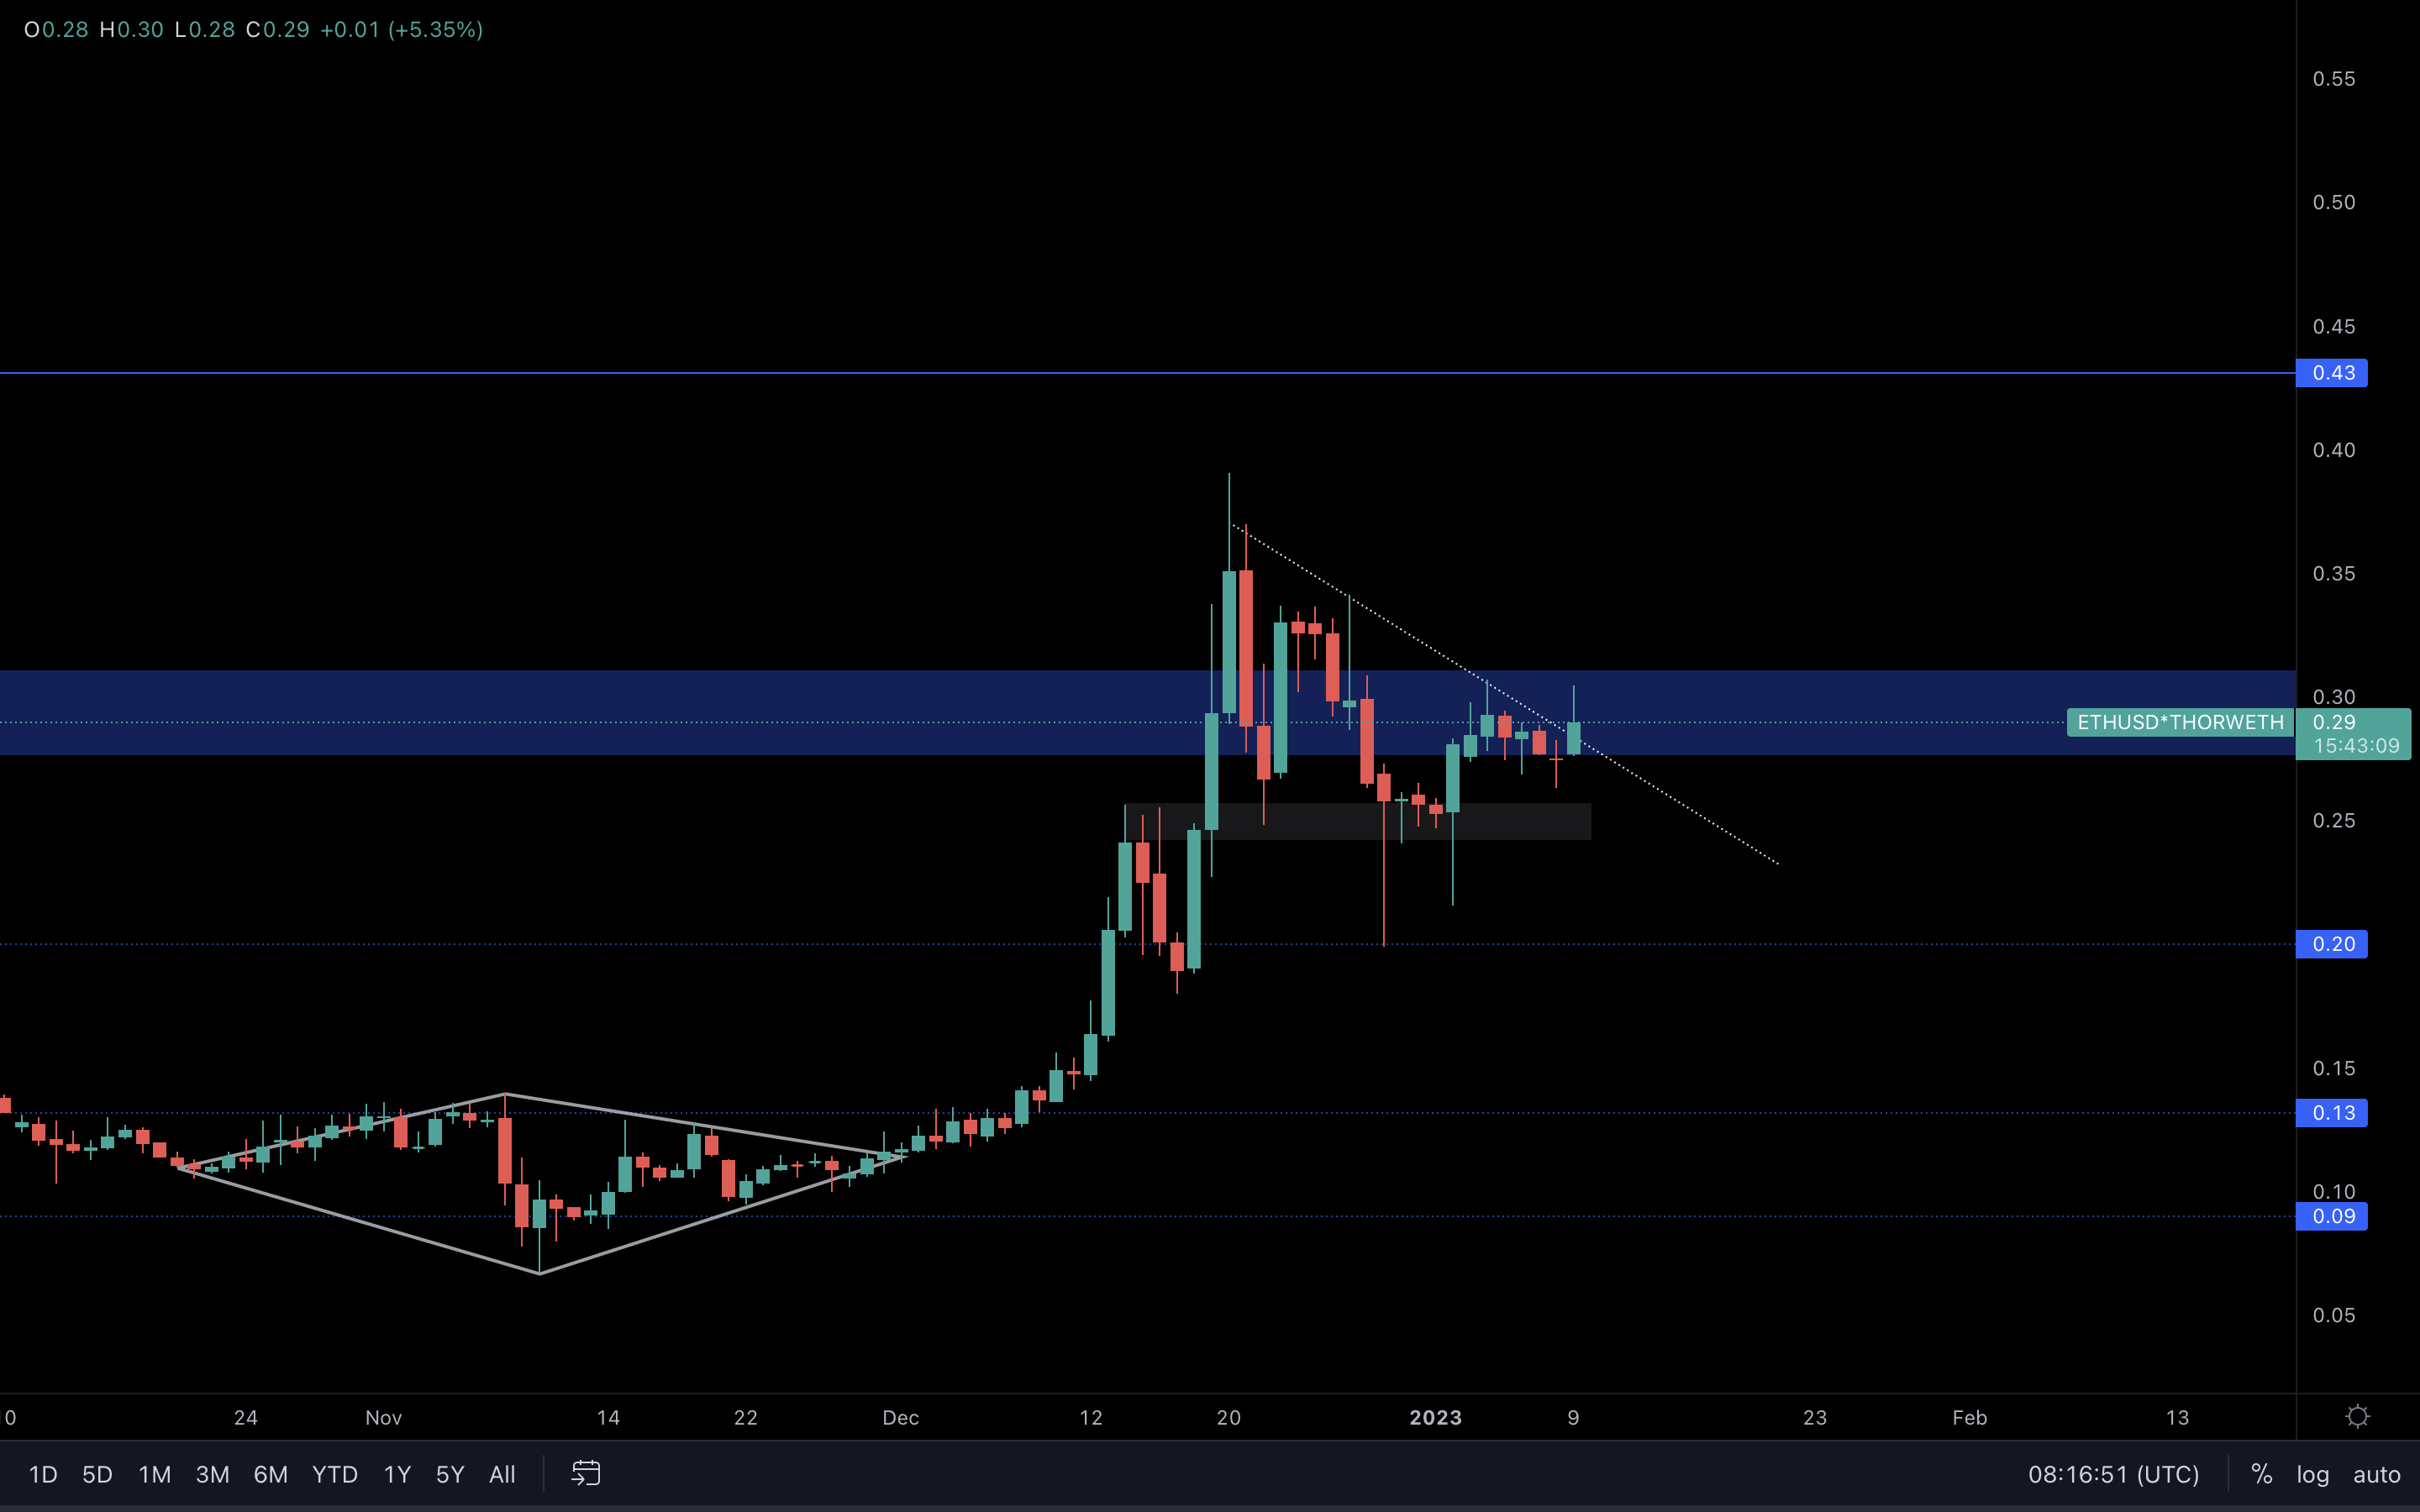
I’ve added the trend line to show you the fact that THOR has been making lower highs on the daily timeframe - and now, we’re seeing a break of that trend line.
THOR has been able to hold itself above $0.28 for the past few days, and based on this potential break of the trend line, we’re likely going to see the asset explode to $0.43 soon.
MINA | Mina Protocol
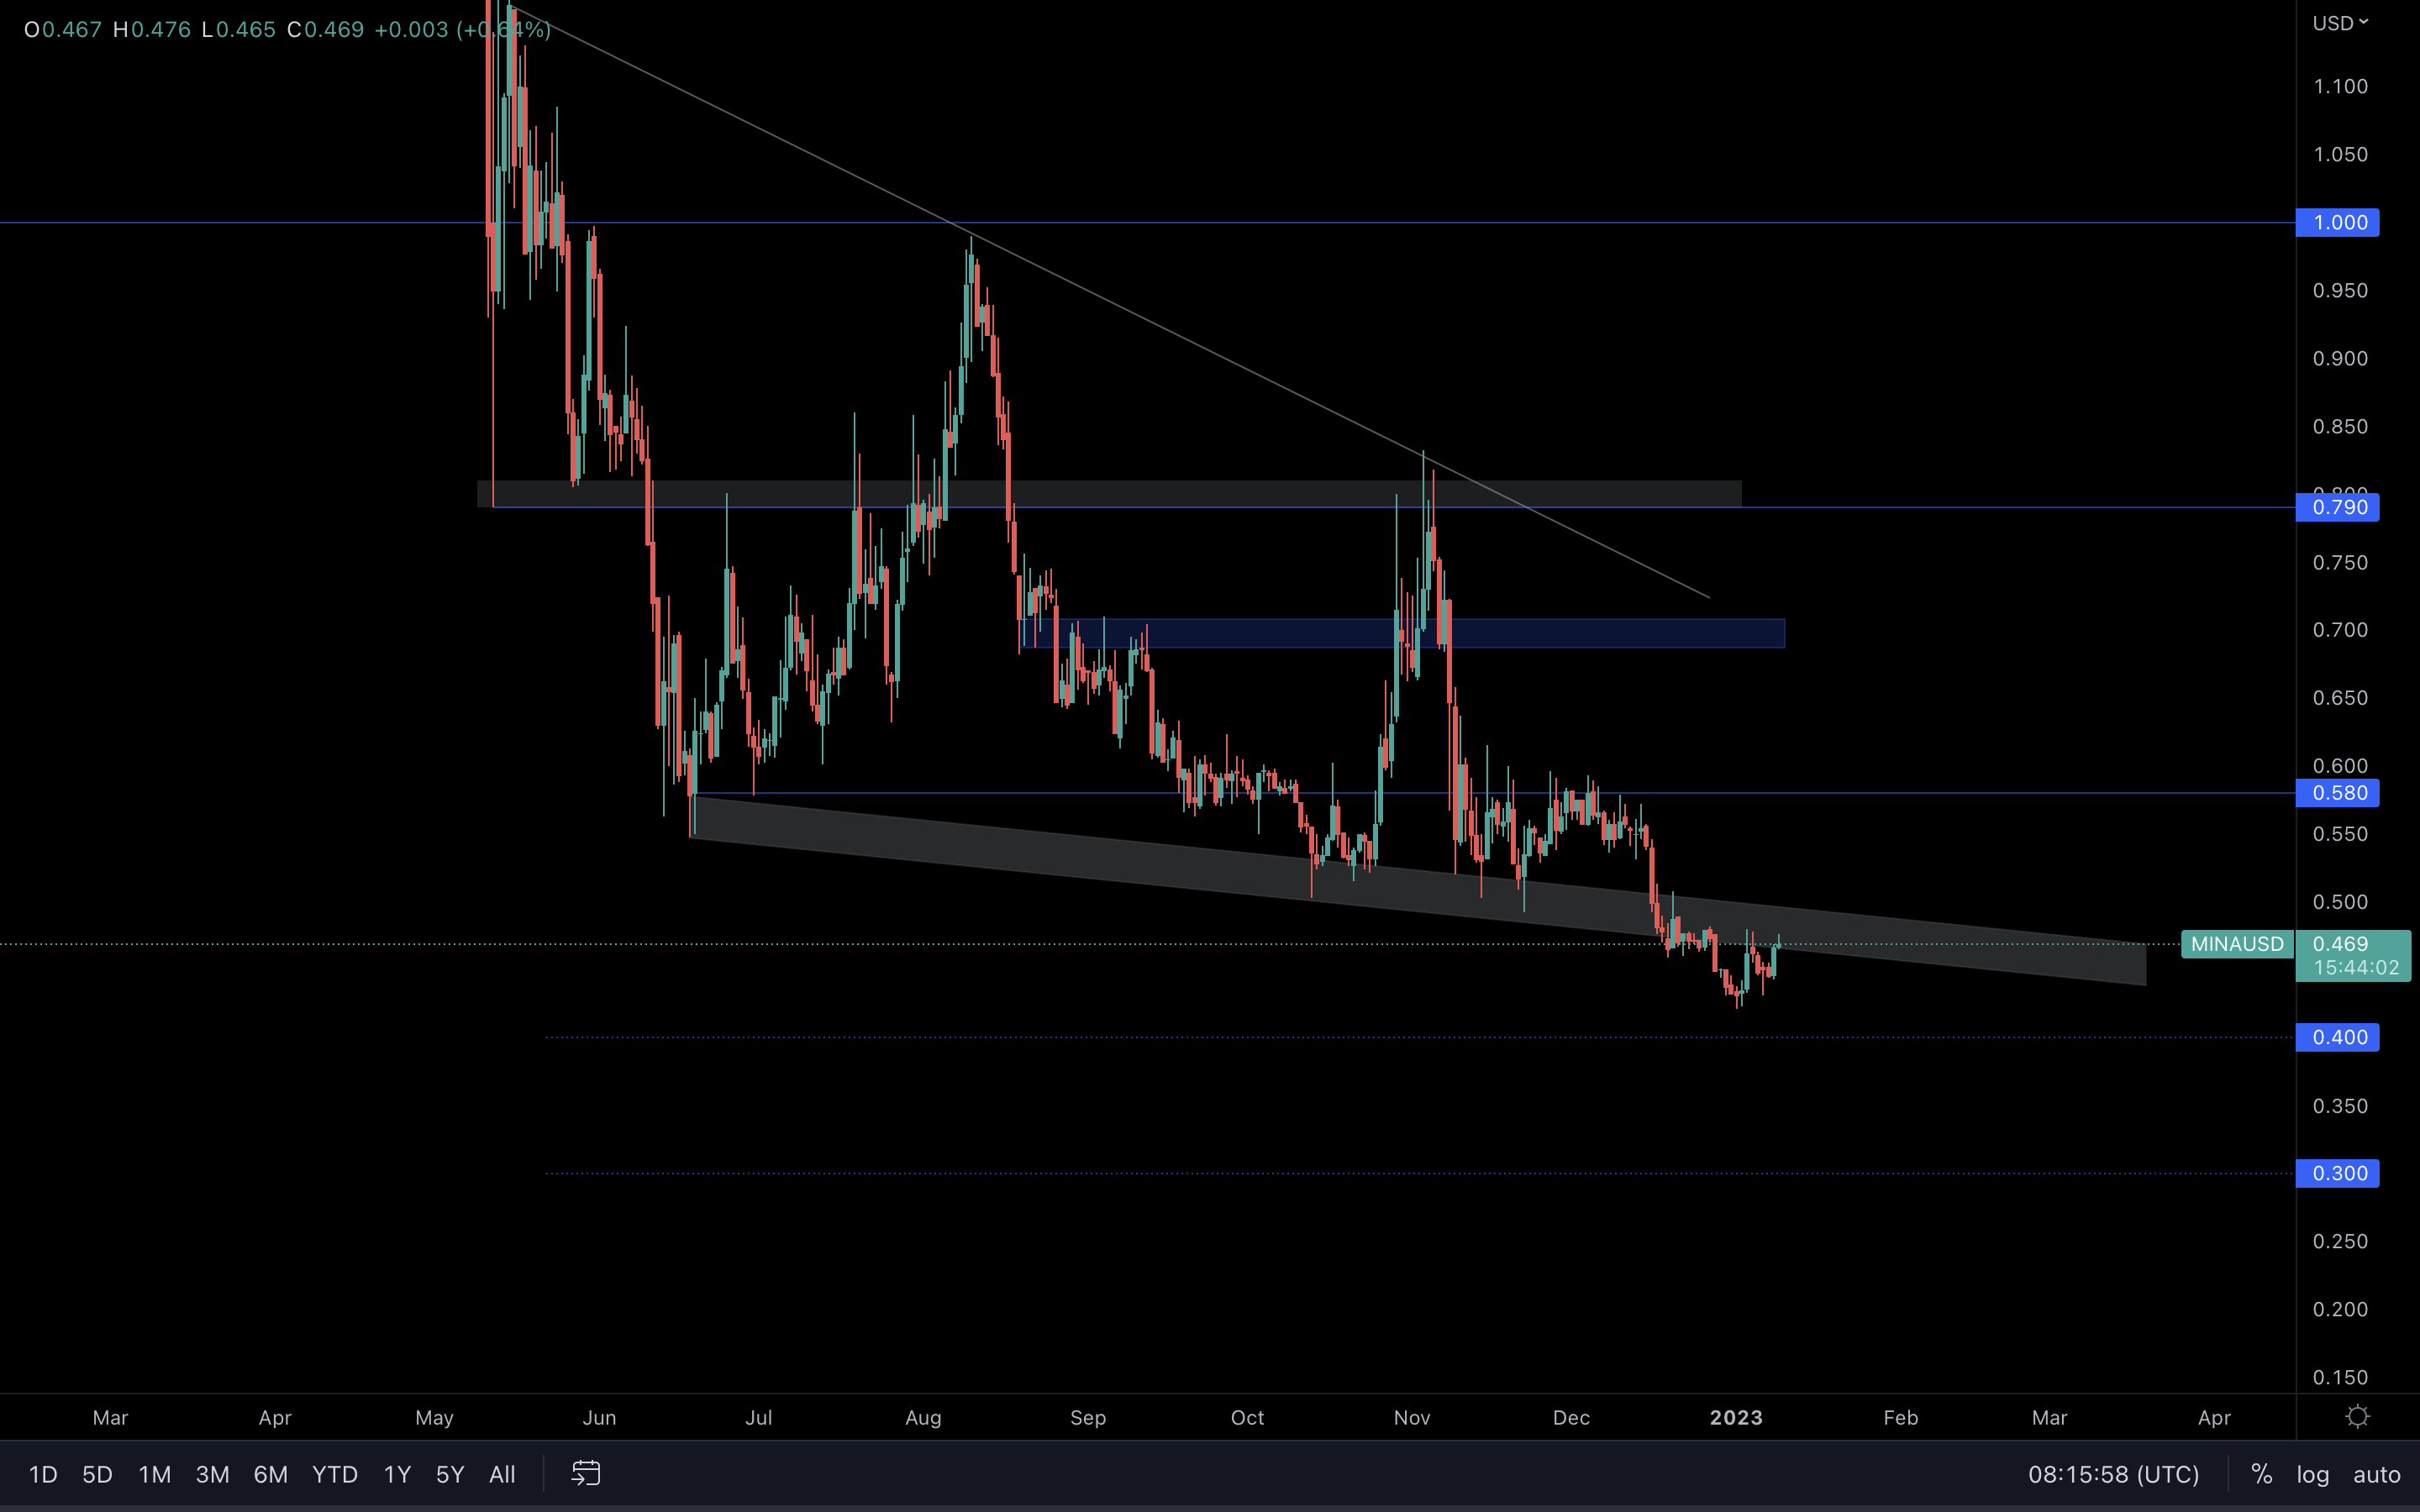
Unless this channel is reclaimed, MINA is at risk of heading into downside price discovery again. The only reason the asset is rising right now is because Bitcoin & Ethereum are rising as well. Keep that in mind before looking at this chart yourselves.
A reclaim of the channel can lead to $0.58, if aided by the majors.
DYDX | dYdX
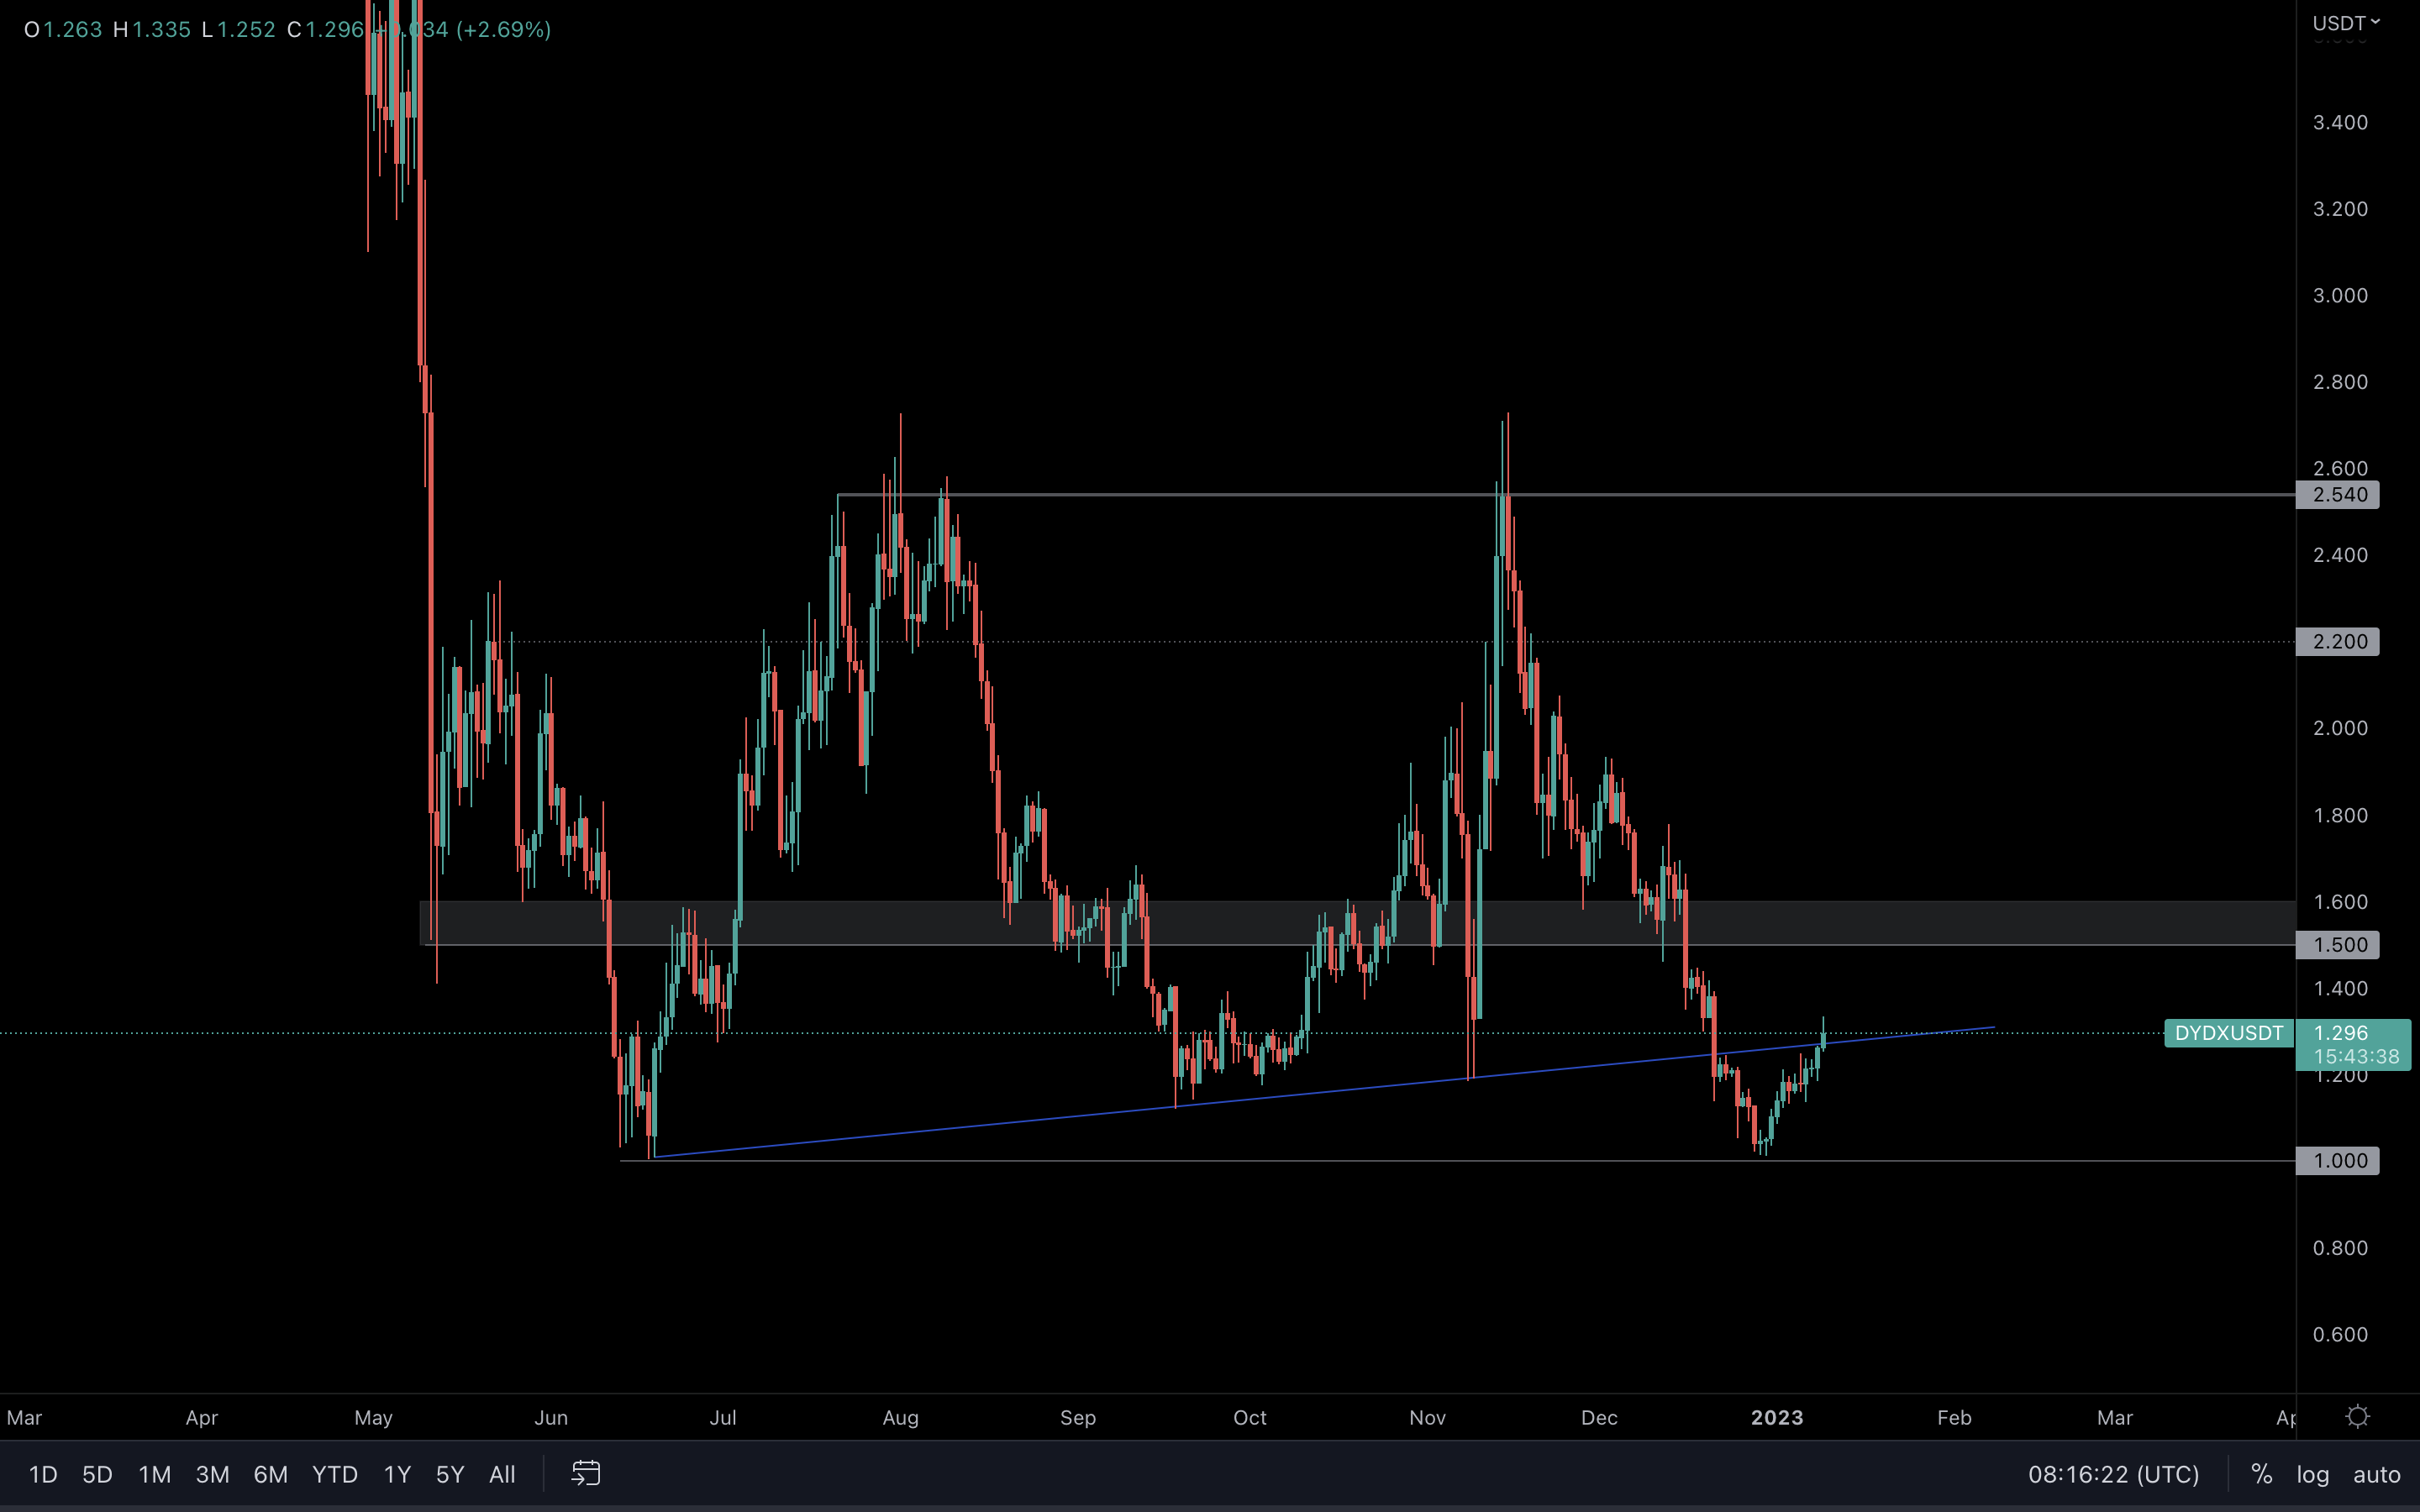
We’re seeing a break of the blue trend line - if reclaimed (daily closure above needed), dYdX will rise to $1.50 soon.
As for the larger timeframe, nothing is changed. dYdX is trading inside of a huge range between $2.50 and $1, and although opportunities can be spotted inside the range, the best ones are if either of those levels are broken.
Summary
We can’t forget the fact that the market is trading at 2017-2018 all-time high levels. We believe the market has either bottomed or that a bottom is near, because volumes have been diminished, and the price action of most assets is flattened on a daily basis. This is a clear sign we might finally be bottoming.In the meantime, Dollar-Cost Averaging remains your best friend in the current market.
Recommended from Cryptonary


