Save 23% ($351) & Get a Free 1-1 Call with our Team ⏰ : 0d 2h 59m 43s
Trading crypto currently feels like being on a rollercoaster ride as everyone chases frantically after the next big move.
But as the dust settles, let's dive into the charts and see where the markets may be headed and what trading opportunities may surface.
As usual, we start with a short video in which we discuss BTC’s key technical levels to set the stage for what’s happening across the majors today.
And somewhere in today’s report, there’s another video in which we talk about a HOT trading opportunity that you can’t afford to miss.
TLDR
- BTC is hovering near support and eyeing inflation data for its next move.
- ETH is still looking weak and struggling to hold support.
- SOL broke a key level, and now, more downside is possible.
- DOT is oversold, and it presents a long opportunity.
- RUNE plummets through supports; this one is at risk.
Disclaimer: Not financial or investment advice. You are responsible for any capital-related decisions you make, and only you are accountable for the results. “One Glance” by Cryptonary sometimes uses the RR trading tool to help you quickly understand our analysis. They are not signals, and they are not financial advice. Any capital-related decision you make is your responsibility and yours only.
BTC | Bitcoin
While markets keep a close eye on the conflict in the Middle East, the focus of today shifts to the inflation data.The expectation is that today’s inflation data will come in at 3.6% YoY, a decrease from last month’s reading of 3.7% YoY. The key to today is to see inflation MoM come in at 0.3-0.4%, which will be a significant decrease on last month’s 0.6%. An upside surprise (say 0.6-0.7%) would likely see risk assets move lower.
Technical Analysis
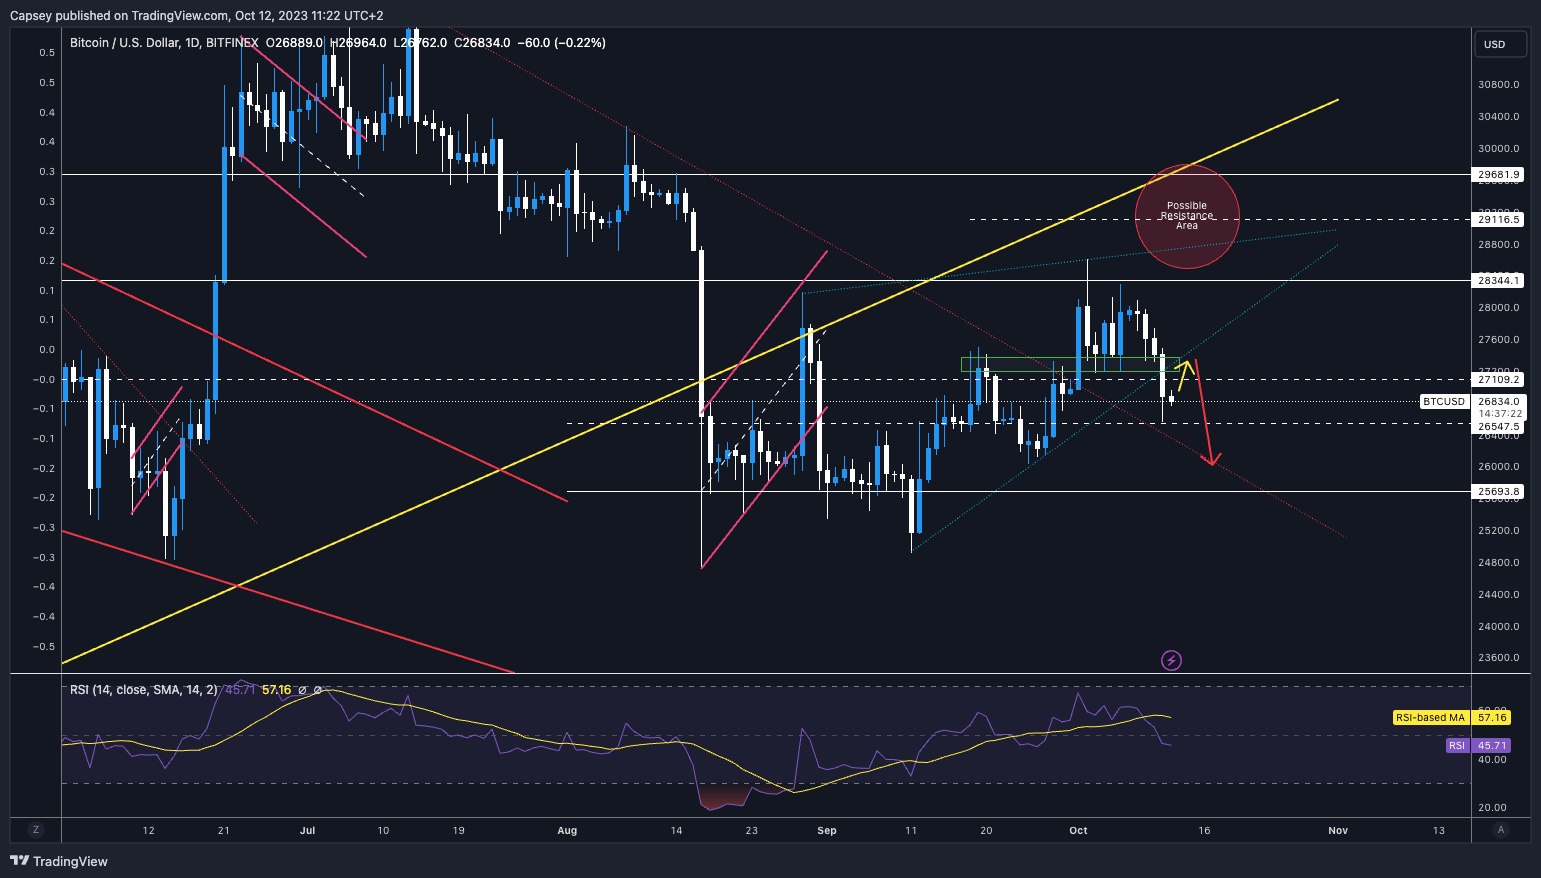
Bitcoin broke down from its wedge pattern and tested the horizontal support at $26,500, where initially some buyers stepped in. Price is now out of the local uptrend (bottom border of the wedge).Over the next few days, we could expect to see BTC’s price try to retest the $27,300 level, which would be the underside of the local uptrend line (and now potentially resistance) and the horizontal level of $27,300, which may also act as resistance. If we get the move up to this level ($27,300), we believe Bitcoin may be rejected from this level, and a short-term trading opportunity may be on the cards. This would be a short trade from the $27,300 level with a near-term profit-taking target of $26,200.
RSI & funding rates
The RSI is putting in a lower low while the price is putting in a higher low; this is a hidden bullish divergence and could help BTC move back to $27,300. The funding rate is positive but only just, so this is mixed here; therefore, there’s not loads for us to go off. Technical analysis overrides the market mechanisms today.Conclusion on trading BTC
Softer inflation data is expected today, so the surprise to markets will likely be if the data comes in hotter (higher) than expected, and this may see risk assets sell off.If Bitcoin can move higher to the $27,300 level and begins to see resistance into that level on the smaller timeframes, then this may open the door to a further move down to $26,200.
Action
- The risks today are in the Inflation data. If the numbers come in around consensus, then this may help the S&P continue higher, and Bitcoin may be able to begin finding some support. Risk assets will likely move lower if the number is hotter than the consensus.
- If BTC can move up to $27,300 and begins to find resistance there (watch the smaller timeframes for this), this may be an opportunity to short Bitcoin from $27,300 with a target of $26,200.
- If the opportunity doesn’t present itself – for instance, if Bitcoin just moves lower, we will look to begin DCA’ing sub $24,000.
ETH | Ethereum
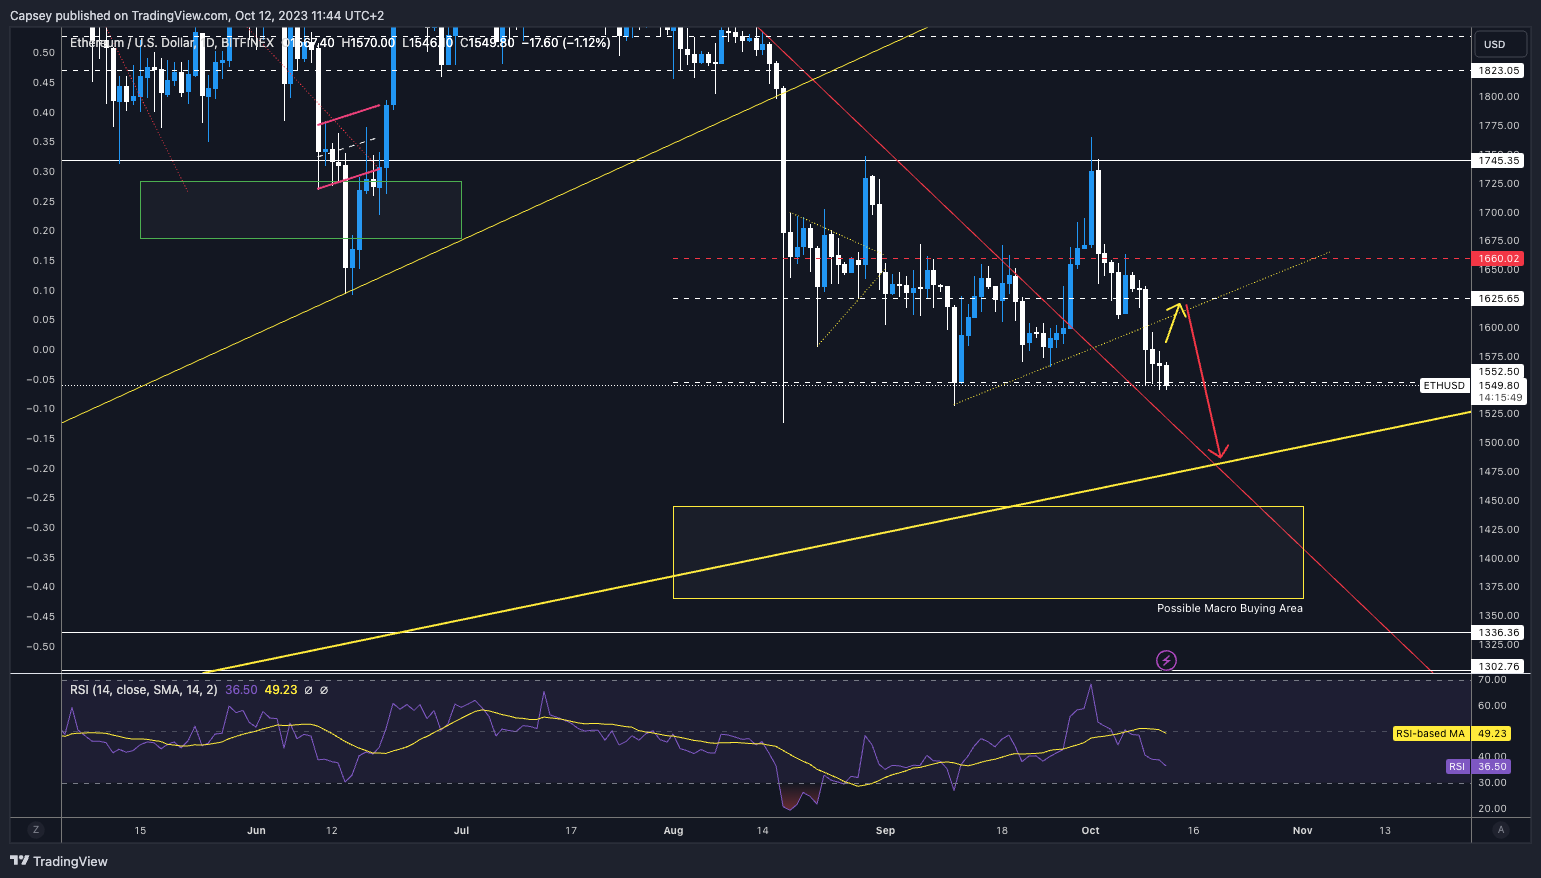
ETH is still looking super weak here. We felt that due to the horizontal support of $1,550 holding over the last few days, with some buyers stepping in at this level, ETH may be able to get a small relief bounce. So far, this hasn’t followed through.Technical analysis
ETH is really battling at the horizontal support at $1,550. The fact we haven’t seen the price move higher from here (i.e. enough buyers stepping in to give ETH a small relief rally) suggests that the support is weak.If the $1,550 horizontal support is lost, the next major area and an area where we believe will be strong support is the main uptrend line at $1,480.
RSI and funding rates
The RSI is at 36, so there is room to go lower here. If we get a lower low in price (daily candle close), then this would create a bullish divergence on the daily, although it isn’t a super clean one.Regarding the funding rates, it’s the same as BTC. It is relatively positive, which shows a mixture in the market positioning. There’s not too much information to take from this.
Conclusion on trading ETH
We still think ETH still looks weak here, so we’re not looking to place any trades on this. We’re mostly watching ETH to see if it can close above $1,550, try hammering that area out as support, and then rebound from there.Action
- We recommend doing nothing on ETH. BTC is the more exciting play for a trade if it can get back to $27,300.
- We remain excited to begin DCA’ing into ETH if it reaches lower price levels. Our first target of interest is the $1,400 level.
SOL | Solana
We were looking for SOL to rebound from the local area of $21.86 to the $23 - $24 area, but unfortunately, it has broken down from $21.86.Technical analysis
SOL is now moving into and testing another major horizontal support at $21.18 and the broadening wedge’s bottom border. We feel that this area could be a good enough support to generate that relief bounce we had previously expected. But, overall, the market looks weak, and SOL is not exhausted enough to the downside that would make us feel comfortable in taking a long position. Essentially, this could have more downside.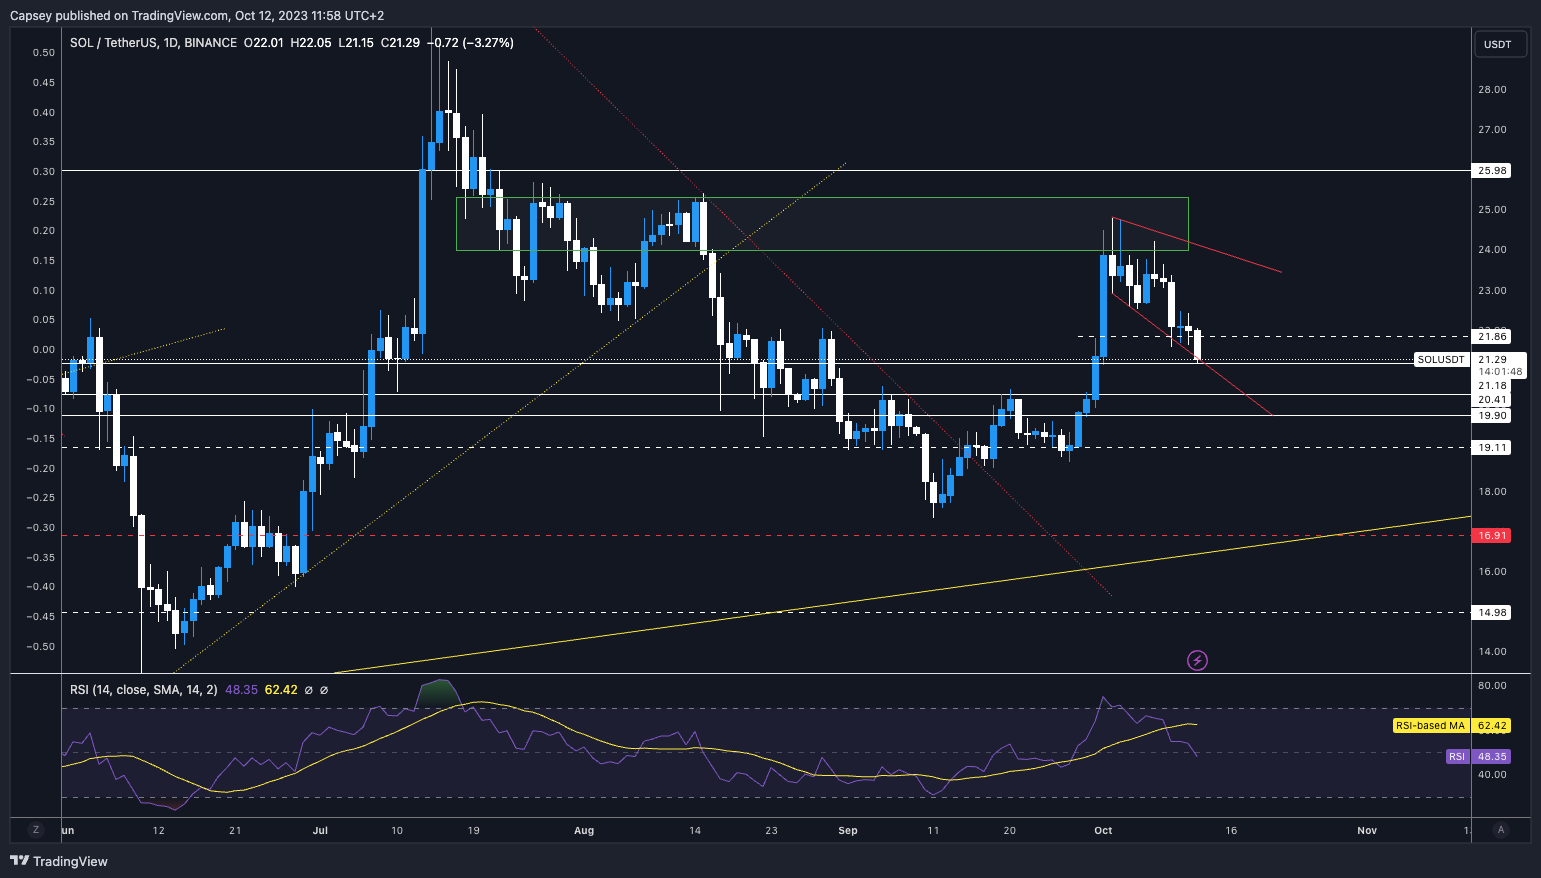
RSI and funding rates
The RSI is at 48, which is the middle ground and why we think SOL could be open to more downsides. Again, 48 is middle territory, nowhere near exhausted enough to the downside, despite the recent move lower. There are no divergences or hidden divergences here, either.The funding rate for SOL is very mixed and likely to remain mixed as the market moves and chops traders out of their positions.
Conclusion on trading SOL
Steering clear of SOL for now. The focus is on BTC and another ALT play that I like. SOL’s RSI suggests there may be more downside here despite SOL falling 13% in the last week or so.Action
- Another asset on which we’re just watching from the sidelines. The opportunities are elsewhere.
DOT | Polkadot
This is the alts opportunity we've spotted for a potential trade.
Technical analysis
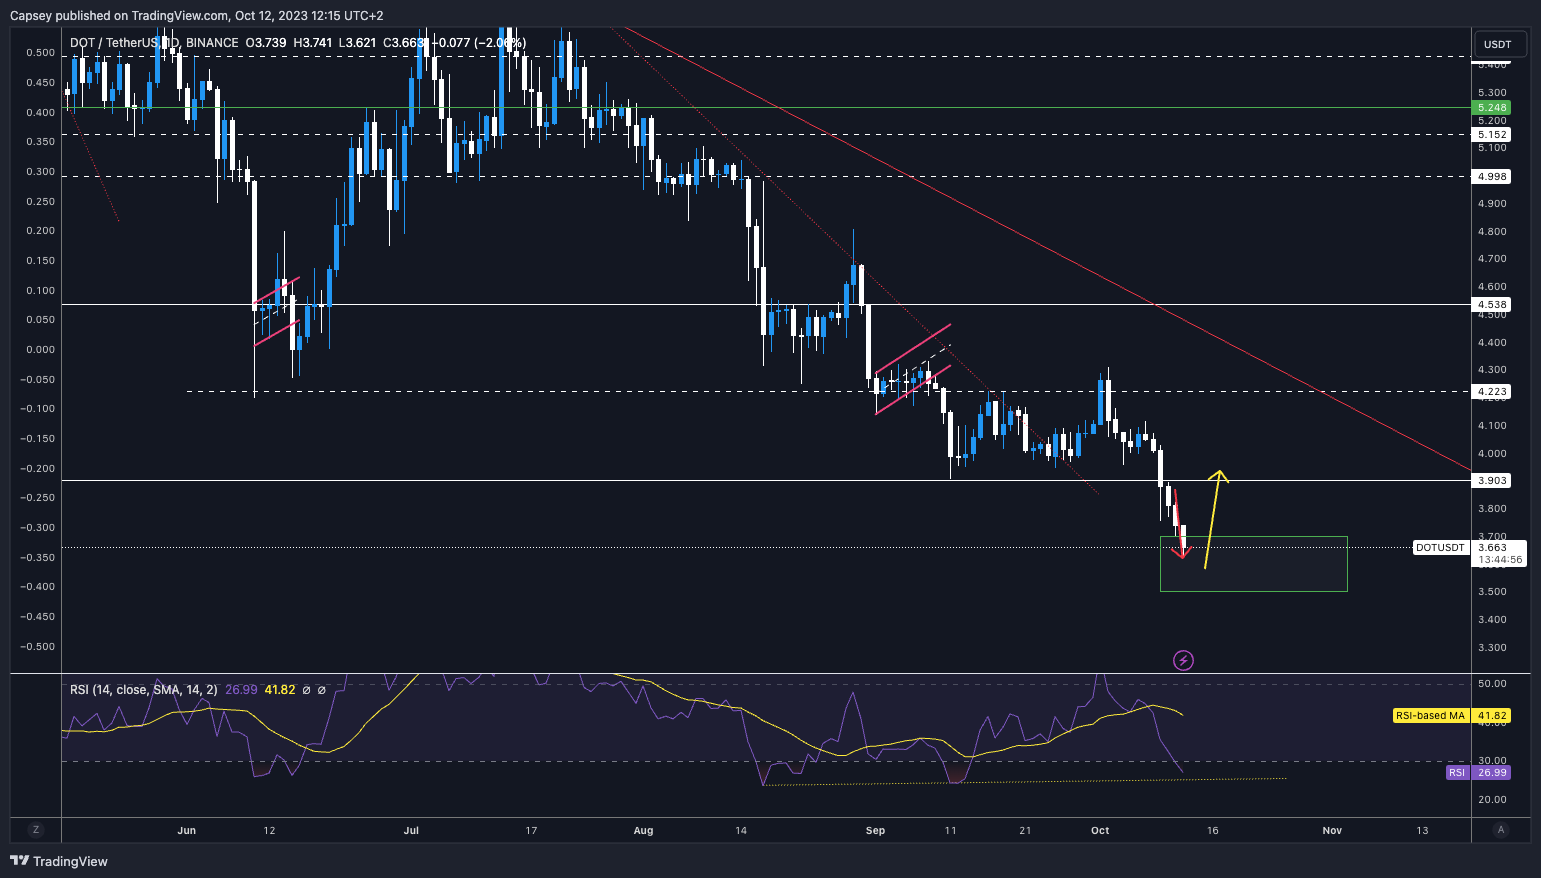
Two days ago, we updated you guys, suggesting that if DOT did break and close below its horizontal support of $3.90, then this would open the door to a further move lower, where we identified a possible landing zone of the green box.We’re now well into that green box. This is somewhat price discovery to the downside, so we must be careful here, even though this also provides good opportunities.
RSI and funding rates
The RSI is at 27, in oversold territory, and it’s putting in a higher low while the price is putting in a lower low – this is a clear bullish divergence.The funding rate is very negative, so there are a lot of shorts here, and they are potentially vulnerable to a short squeeze. Long story short, many factors have aligned to present us with a trade opportunity here.
Conclusion on trading DOT
We like DOT here for a trade, a potential long position. The main risk to the trade is if Bitcoin sells off considerably.Action
- Long/Buy orders could be placed between $3.52 to $3.65 with a Stop Loss of $3.37.
- The upside target for this trade would be $3.90.
RUNE | THORChain
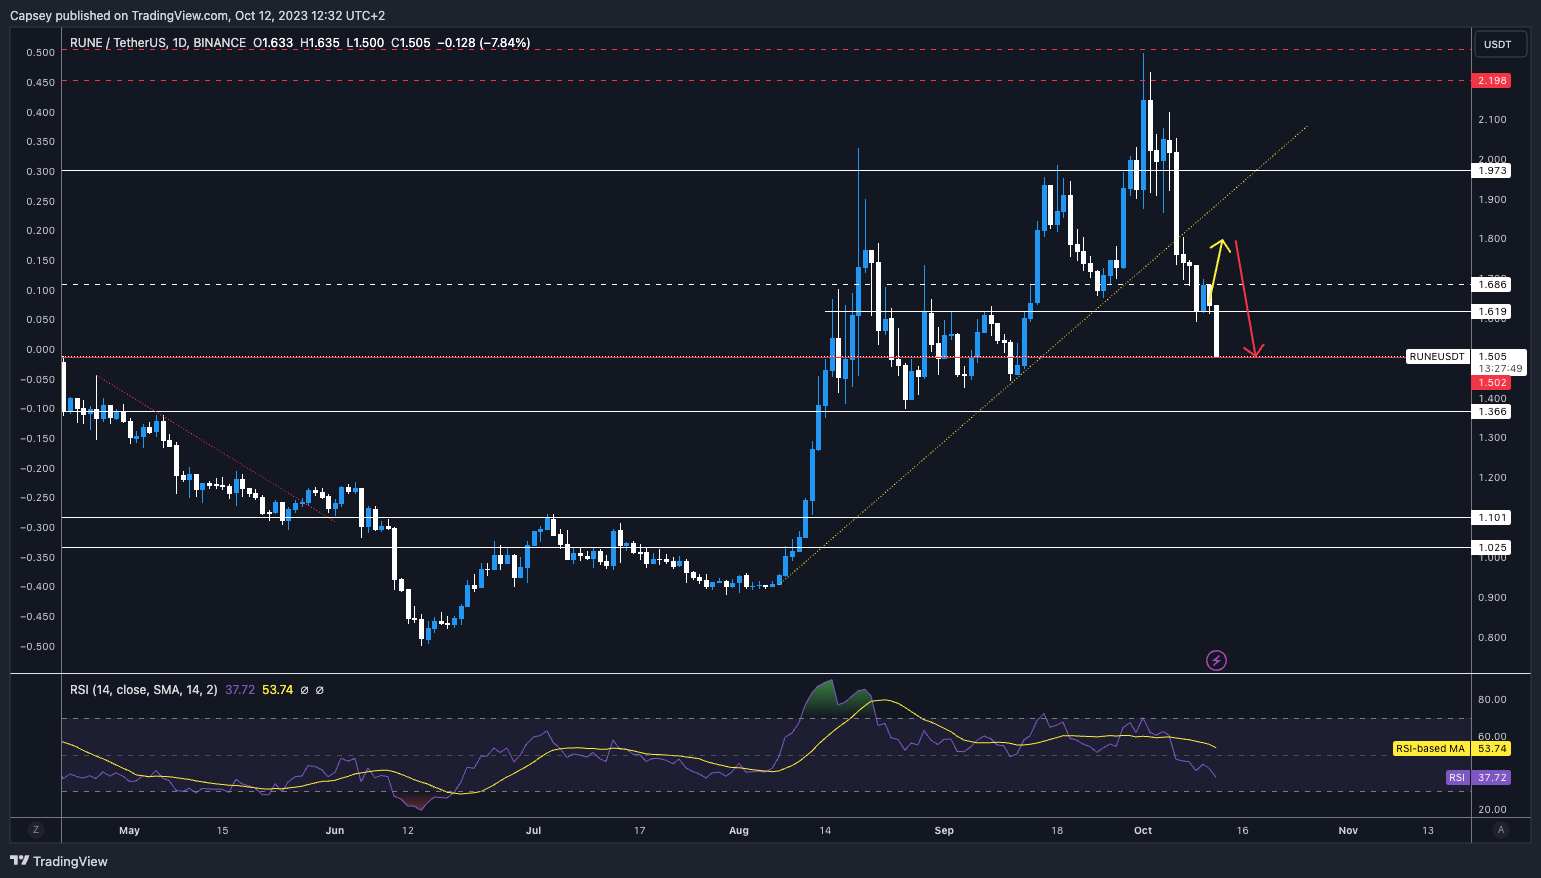
RUNE could not hold the $1.61 horizontal support and has now broken down to the more major support of $1.51. We exercised caution when RUNE was at $2.00 just a week ago, and now we see the price down to $1.51, a 25% decline.Technical analysis
We felt RUNE could get a small bounce from the $1.61 level, but unfortunately, this didn’t materialise. Ultimately, though, our final target for the move was the $1.51 level, which is where we now find ourselves.If $1.51 doesn’t hold as support, then the next level is $1.36, which needs to hold. Otherwise, this will open the door to $1.10. At this point, RUNE bag holders will be down 45% from when we said to take some risk off the table at $2.00. RUNE has shown real weakness here, and ultimately, this is a bit of a falling knife.
RSI and funding rates
With the RSI at 37, there is more room for this to go lower, but the expectation is that a bounce comes at some point, although we don’t advise trying to be a hero and calling it.The funding rate is positive at 0.01%, so this is now a healthy dynamic again, with longs dominating the market.
Conclusion on trading RUNE
We feel that RUNE can bounce from $1.51 as long as Bitcoin can hold up at current levels. However, we’re not confident enough to buy/long RUNE here.Action
- The time to reduce exposure was at $2.00 when we called it.
- Rather than sell here, we’d wait for some relief bounce before trimming our position.
Cryptonary’s take
And that wraps up our analysis on today’s BTC, ETH, SOL, DOT and RUNE.The past week has illustrated just how quickly crypto sentiment can shift.
Key support levels have been tested across top names like Bitcoin, Ethereum and Solana.
But amidst the carnage, you can find opportunity. As we analysed, Polkadot presents an intriguing setup here. With the asset oversold, putting in bullish RSI divergence, and funding rates extremely negative, the stars have aligned for a potential DOT relief rally.
Broadly speaking, with markets betting on softer inflation data, be ready for swift moves if the numbers surprise. And while the crypto market is directionless in the interim, volatility is our friend, and we will be ready to pounce when opportunities arise.
Cryptonary OUT!
Recommended from Cryptonary


