Save 23% ($351) & Get a Free 1-1 Call with our Team ⏰ : 0d 2h 59m 43s
INJ, SHIB, and PENDLE defend critical levels
As market corrections settle, Pendle, Injective, and Shiba Inu are showing resilience at key support levels. Pendle tests $5.7 resistance, Injective consolidates above $20.64, and Shiba Inu holds firm at $0.0000215.

Let’s explore what’s driving their next potential moves.
Disclaimer: This is not financial or investment advice. You are responsible for any capital-related decisions you make, and only you are accountable for the results.
Pendle (PENDLE):
Overview
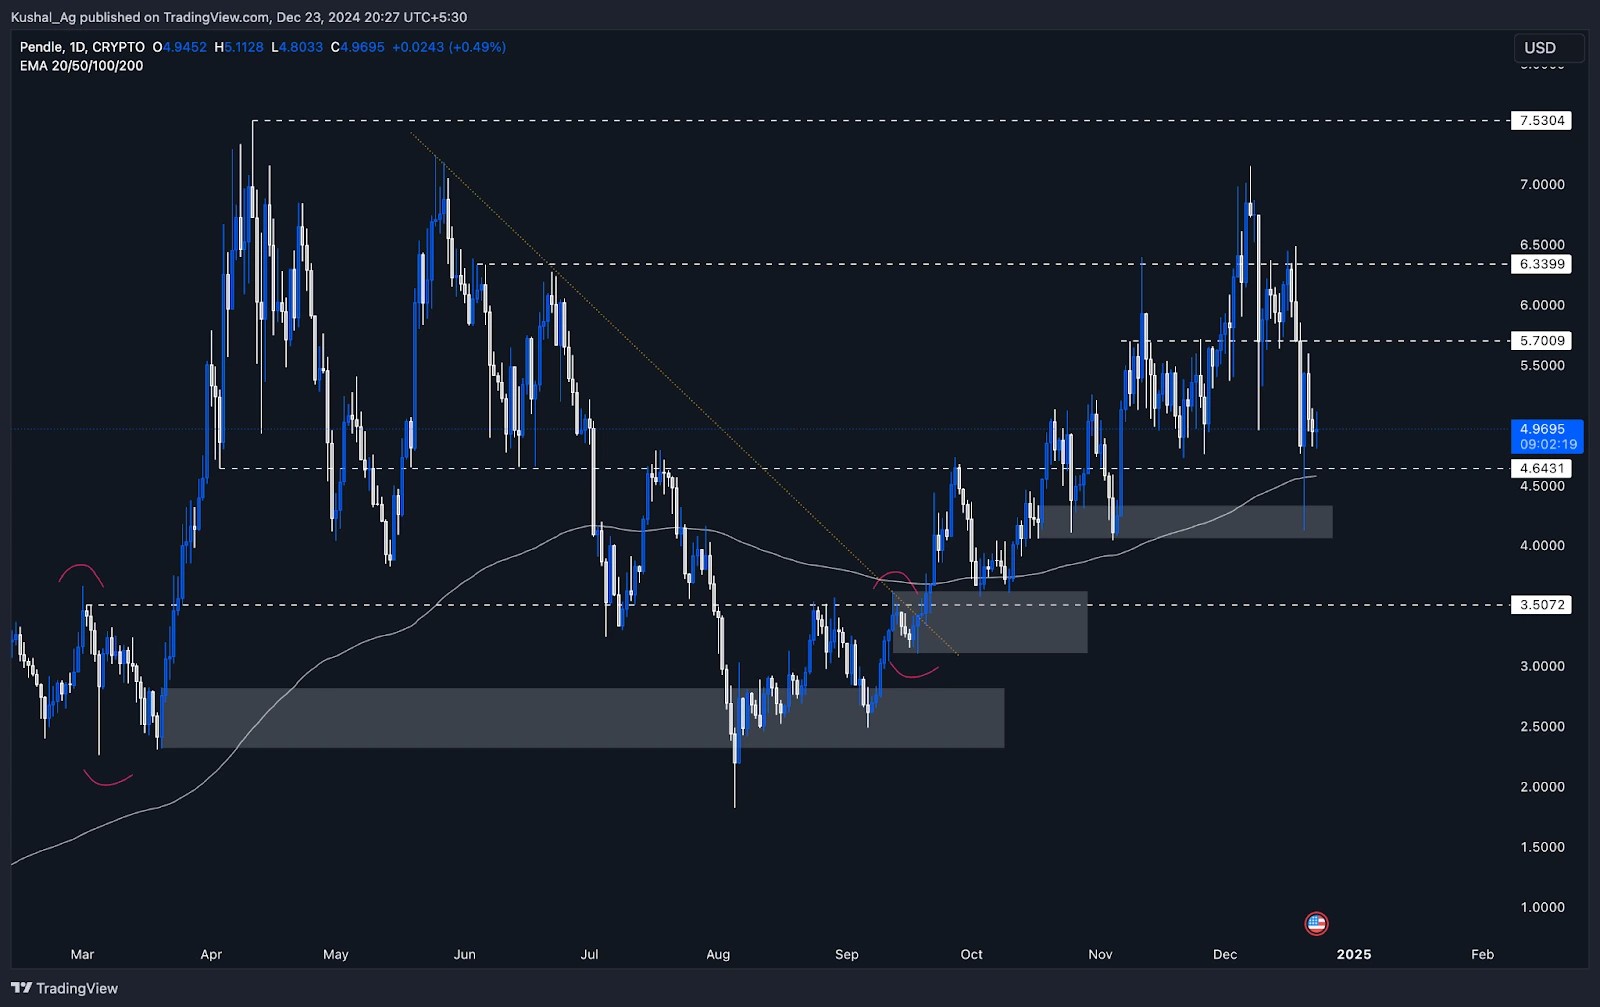
Pendle ($PENDLE) has experienced a significant retracement following the recent market-wide shakeout. After making a local high of $7.14 on December 7th, the asset pulled back sharply by approximately 42.27%, reaching a low of $4.129.Despite this correction, $PENDLE has shown strength by holding key support levels, including the $4.64 region and the 200 EMA on the daily time frame, which is currently at $4.576. This indicates that buyers are stepping in to defend critical levels, reinforcing the asset's bullish structure.
Currently, $PENDLE is trading at $4.93, consolidating after the recent shakeout, and is well-positioned for its next move.
Analysis
On the daily time frame, $PENDLE has demonstrated its ability to maintain structure despite the broader market volatility. Here are the key observations:- Support levels:
- $4.64: This level has proven to be a solid support, holding firm during the recent retracement.
- 200 EMA at $4.576: The 200 EMA aligns with the $4.64 support, providing additional confluence and making this area a key zone for buyers.
- $3.5: This is a larger structural support level for $PENDLE in case of another major shakeout.
- Resistance levels:
- $5.7: Immediate resistance level, which has capped recent attempts to move higher.
- $6.33: The next resistance zone on the upside, followed by the $7.14 local high.
- $7.53: The all-time high for $PENDLE, lying just above the recent local high.
- Price action:$PENDLE reversed strongly from the $4.129 low, where it wicked down during the shakeout, showing a quick recovery back above the $4.64 region. This demonstrates strong buyer interest at lower levels and the likelihood of consolidation between $4.64 and $5.7 in the short term.
Cryptonary's take
Despite the recent shakeout, Pendle ($PENDLE) has held up well, maintaining key supports and respecting its bullish structure on the daily time frame. The $4.64 support level and the 200 EMA at $4.576 are critical areas that reinforce the asset's resilience, while the sharp reversal from $4.129 highlights strong demand at lower levels.For now, $PENDLE is likely to range between $4.64 and $5.7, with a breakout above $5.7 opening the path to $6.33 and potentially $7.14, the recent local high. On the downside, breaking below $4.64 could lead to further retracement toward $3.5, though this scenario appears less likely given the strong support already demonstrated.
$PENDLE continues to look solid, and its ability to consolidate above critical levels will determine its medium-term trajectory. This is a good time to monitor the asset as it positions itself for potential moves higher.
Injective (INJ):
Overview
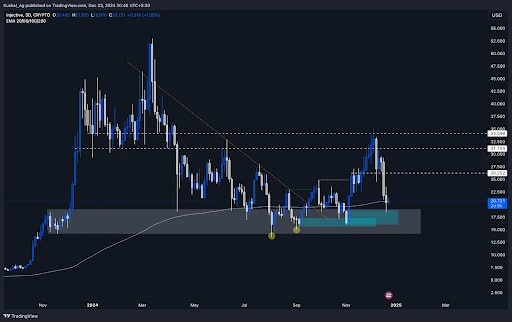
Injective ($INJ) has retraced significantly from its local high of $35.12, recorded on December 5th, pulling back by approximately 47.57% to a low of $18.491. The asset has returned to its 3D time frame demand zone, a key accumulation area marked by a blue box, which spans between $18.85 and $16.00. The previous 3D timeframe demand zone facilitated a substantial 120% rally in early November, making it a significant confluence to look out for.Currently, $INJ is trading at $20.612, just above the 3D time frame 200 EMA, which is situated at $20.64. Holding above this level reinforces the bullish structure of the asset and positions it for potential recovery.
Analysis
- Support zones:
- The 3D demand zone ($18.85 to $16.00) has consistently acted as a solid accumulation base for $INJ. This zone is being tested after the recent market-wide retracement, providing a critical area for buyers to step in.
- The 3D 200 EMA, currently trading at $20.64, is providing additional support, reinforcing the importance of the current price range.
- Previous price action:
- In early November, $INJ bounced from a similar demand zone, rallying 120% from $15.96 to $35.3. A similar reaction could unfold if buyers regain control in this area.
- Resistance levels:
- The first resistance lies at $26.25, which marks a critical level for $INJ to reclaim signal strength.
- Further resistances are positioned at $31.1 and $34, with the latter being the level where $INJ faced rejection in early December.
- Current setup: The Injective is consolidating above the 3D demand zone and the 200 EMA, signalling a potential base formation. If the asset can hold these levels, it sets the stage for a recovery rally toward key resistances.
Cryptonary's take
Injective ($INJ) is currently in a pivotal zone, trading within its 3D demand zone and just above the 3D 200 EMA. This setup presents a favourable risk-reward opportunity for accumulation, particularly for traders and investors looking to capitalize on discounted prices.On the upside, reclaiming $26.25 as support would be the first signal of bullish continuation, with potential moves toward $31.1 and $34. However, failing to hold the $18.85 - $16.00 demand zone could lead to further downside, although this appears less likely given the current technical confluence.
$INJ remains one of the more robust altcoins, showing consistent reactions from its demand zones and maintaining key levels despite market volatility. For now, its ability to sustain above the 3D 200 EMA will be crucial in determining its short-to-medium-term trajectory.
Shiba Inu (SHIB):
Overview
Shiba Inu ($SHIB), one of the most prominent meme coins, has retraced alongside the broader meme coin sector. After reaching a local high of $0.000033 on December 8th, $SHIB experienced a significant 44.59% pullback, making a low of $0.0000185.Currently trading at $0.000022, Shiba Inu has shown strength by holding key support levels and reacting strongly from its technical zones. The asset has maintained its structure despite breaking the yellow uptrend trendline on the downside, and it remains positioned for a potential recovery if it consolidates above critical levels.
Analysis
On the daily timeframe, $SHIB's pullback has tested and held critical levels, reinforcing its bullish structure:Support levels
- $0.0000215: This key support zone, mentioned in previous analyses, has held strongly during the recent retracement.
- 200 EMA (Daily): Currently trading at $0.00002, the 200 EMA acted as dynamic support during the pullback, further solidifying the $0.0000215 area as a local bottom.
- $0.0000176: A strong lower support zone in case of another broader market correction, though this scenario seems unlikely given the current strength.
Resistance levels
- $0.0000238: The first immediate resistance on the upside.
- $0.0000284: The next significant resistance zone, marking a key level for further bullish continuation.
- $0.0000328: The top-side resistance, which acted as the rejection zone during the previous rally. Breaking this level could unlock higher targets.
Potential scenarios
If $SHIB consolidates between $0.0000215 and $0.0000238, it could build momentum to reclaim the yellow uptrend trendline, which could act as minor resistance initially. A breakback above this trendline and $0.0000328 would signal a bullish continuation, potentially revisiting the March 2024 high of $0.0000454.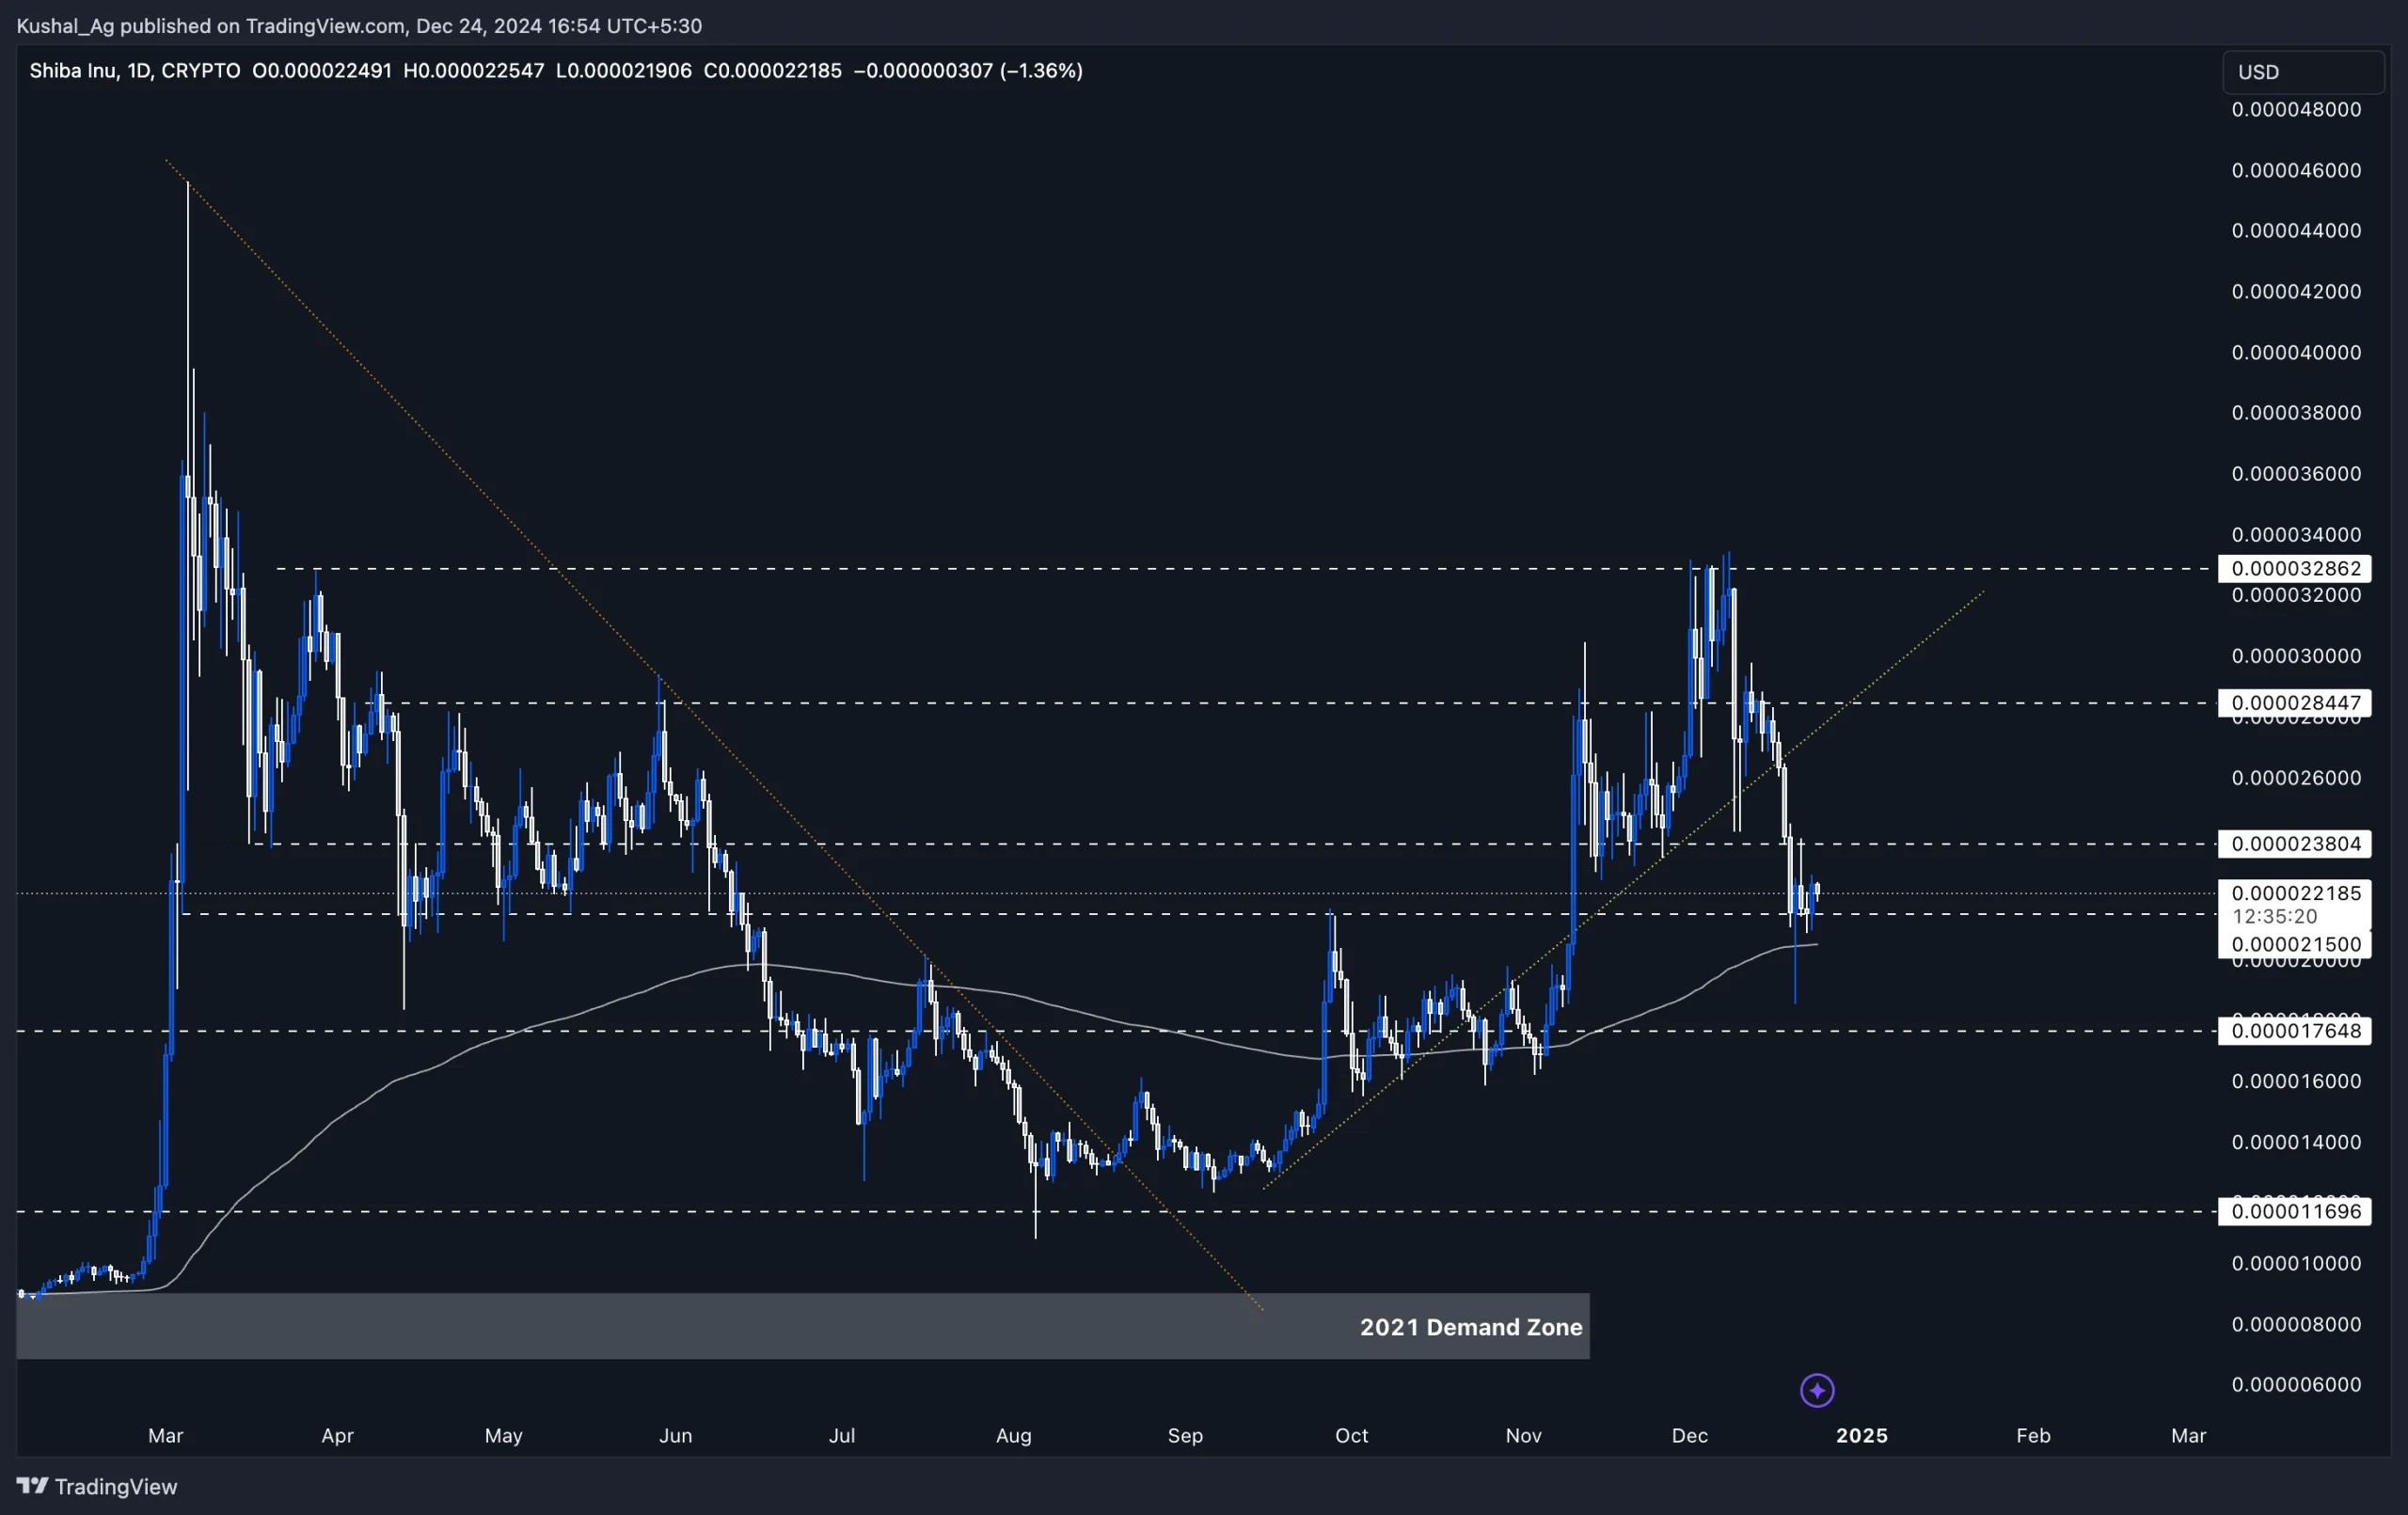
Cryptonary's take
Shiba Inu ($SHIB) has demonstrated strength by maintaining support at $0.0000215 and reacting strongly from the 200 EMA. Despite the break below the yellow uptrend trendline, the structure remains intact, and the asset looks poised for consolidation and potential recovery. Holding above the $0.0000215 level and staying above the 200 EMA are critical for $SHIB's bullish case.Breaking above $0.0000238 could pave the way for further upside, with $0.0000284 and $0.0000328 acting as key hurdles. Should these levels be reclaimed, a move toward the March 2024 high of $0.0000454 could be on the horizon.
For now, $SHIB looks solid technically, with its current setup offering favourable opportunities for bullish continuation.
Recommended from Cryptonary


