Disclaimer: This is not financial or investment advice. You are responsible for any capital-related decisions you make, and only you are accountable for the results.
INJ:
Overview:
Injective Protocol (INJ) has been a standout performer in the altcoin market since its launch in October 2021. INJ has maintained a strong bullish structure across both weekly and daily timeframes, consistently showing strength through its higher highs and higher lows pattern.
Currently trading at $19.50, INJ has been steady despite broader market fluctuations. With recent price movements breaking key resistance levels and maintaining critical support, INJ is positioned for a potential continuation of its bullish run as the wider cryptocurrency market trends upward.
Weekly time frame analysis
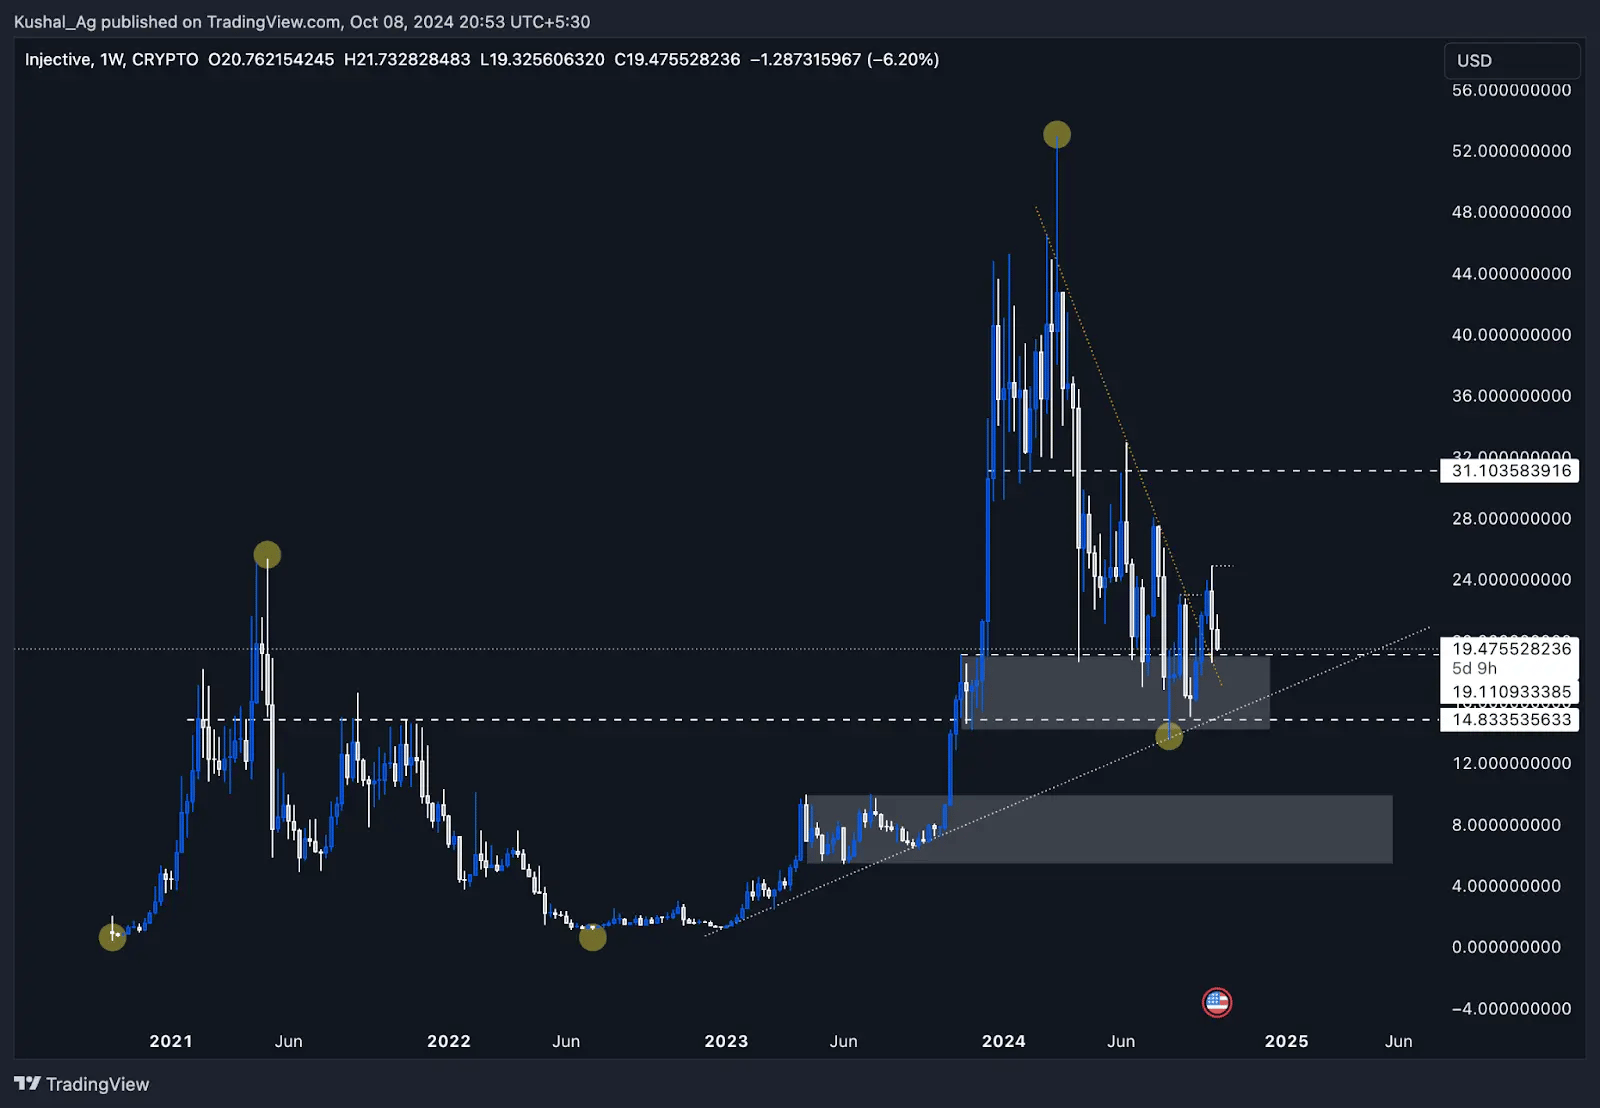
Since its inception, INJ has demonstrated significant strength, maintaining a bullish structure despite corrections. After reaching an all-time high of $52.9 in March 2024, it retraced to the $19.50 range, where it is now trading within the weekly demand zone between $14.2 and $19.1.
Price recently tested the $14.8 support zone, a historically important level that now acts as support after serving as resistance in 2021.
Key observations:
- Higher highs & lows: The yellow dots on the chart represent INJ's pattern of higher highs and higher lows, continuing the bullish structure on the weekly time frame.
- Strong demand zone: The price is holding above the $14.2 - $19.1 demand zone, which has consistently attracted buying pressure.
- White dotted trendline: The uptrend maintained by the white dotted line continues to support price action. As long as this trendline remains unbroken, INJ's bullish structure in the weekly time frame will be preserved.
- Next support levels: If the demand zone fails, the next support zones are between $9.94 and $5.41, though this seems unlikely given the current bullish market momentum.
Daily time frame analysis
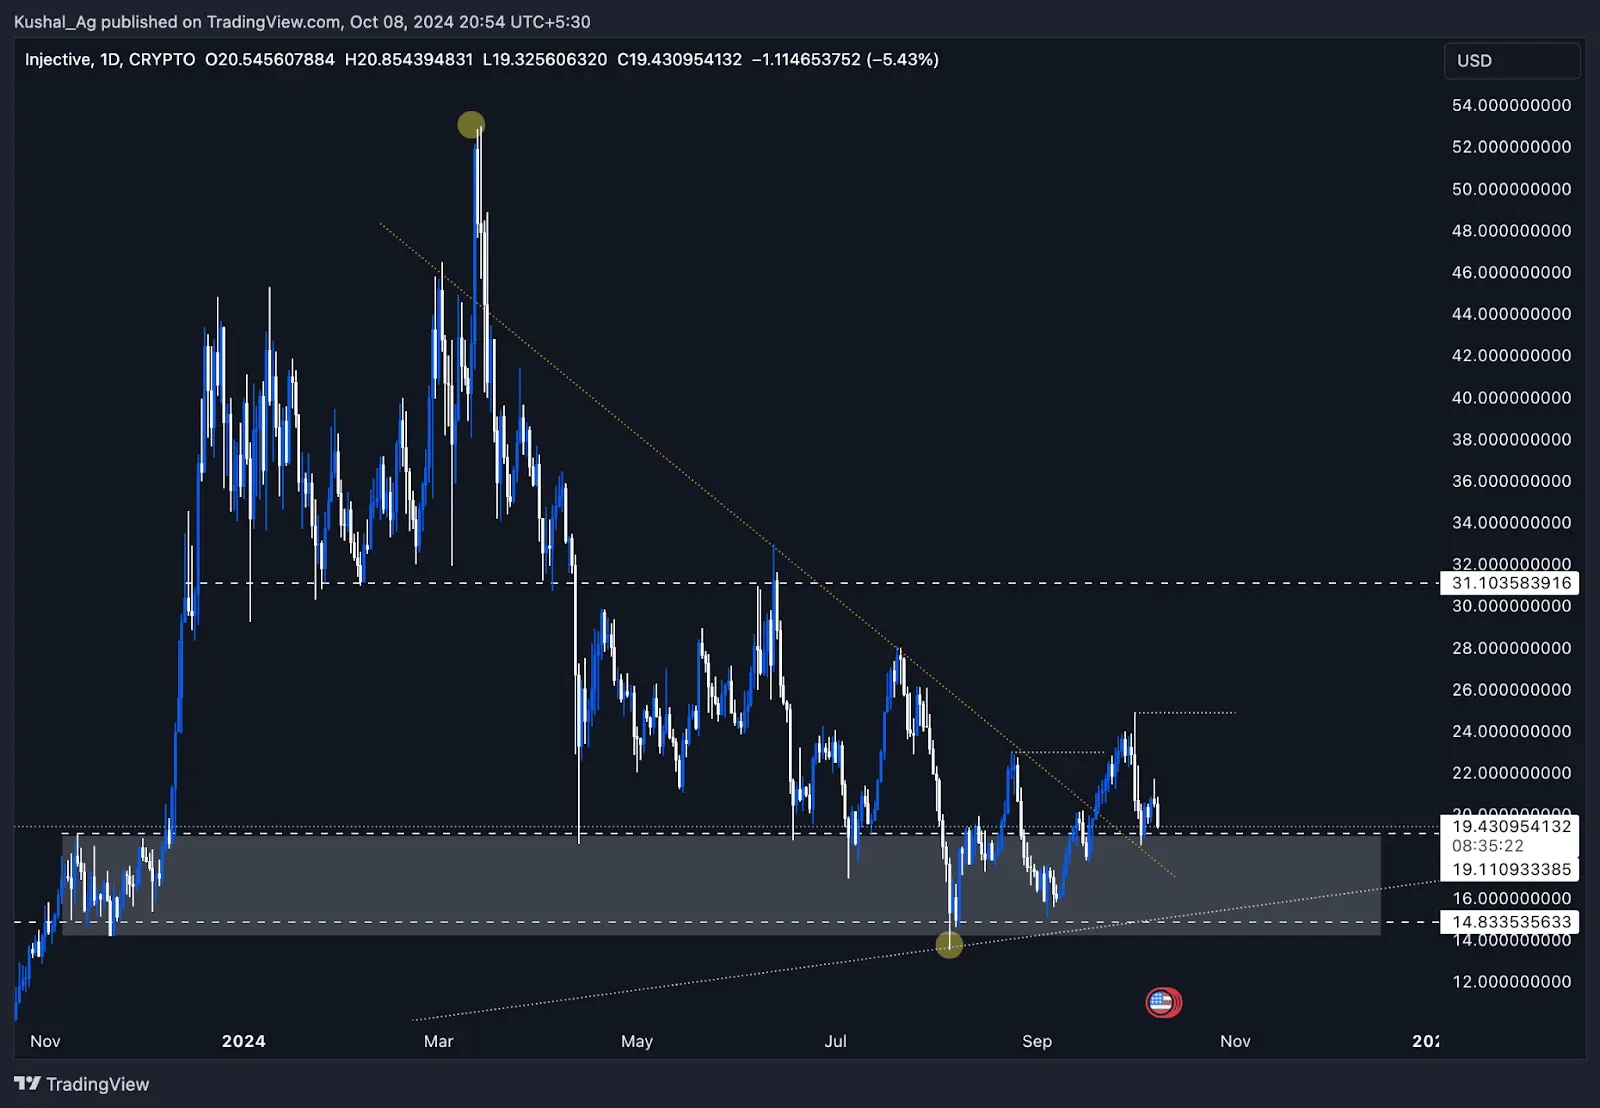
On the daily chart, INJ recently broke out from a downtrend trendline in late September 2024, marked by the orange dotted line. This breakout has led to a significant bullish swing as INJ also broke an intermediate structure on the upside, further adding confluence to the breakout.
Current market outlook
- Breakout Retest: After breaking out from the downtrend, INJ has returned to the breakout range for a retest, which is a healthy sign of consolidation before another move-up. The price should hold above the weekly demand zone at around $19.1 for the bullish trend to continue.
- Resistance Levels: On the upside, $24.8 is the immediate resistance, followed by $31 as the next major level to break.
- Support Levels: On the downside, $14.8 remains a key support level, which has held firm in recent pullbacks.
Potential accumulation zones
- The $19.1 area and weekly demand zone offer good opportunities for accumulation for long-term investors. If the price holds above this zone, INJ is well-positioned to rally toward $24.8 and eventually aim for the $31 resistance.
- In the event of a bearish retracement, bids can be placed around the $14.8 level, which has proven to be a strong historical support zone.
Cryptonary's take
Injective Protocol (INJ) continues to show some strength on both the weekly and daily timeframes, with a solid market structure and bullish indicators across multiple key levels. The breakout from the downtrend on the daily chart, combined with price holding above the weekly demand zone, points toward a potential rally in the near term.
However, it's essential to remain cautious of any downside risk. The $14.8 support level will be critical in determining whether the bullish trend continues or a deeper retracement occurs. With the wider market turning bullish and Bitcoin breaking through significant resistance zones, INJ is in a favourable position to capitalize on this momentum, targeting $24.8, $31, and potentially higher levels in the coming weeks.
PEPE:
Overview
The broader
meme coin sector continues to ride a wave of speculation and enthusiasm, with $PEPE standing out as one of the prominent players in this space. As the broader market begins to heat up, meme coins like $PEPE are gaining momentum once again.
A key technical development on the daily chart shows $PEPE making a bullish shift in structure, which could lead to significant upside potential in the near term. This analysis will focus on $PEPE's performance across the daily and 4-hour timeframes, where crucial price levels and trendline breaks are shaping the next big move.
Daily timeframe analysis
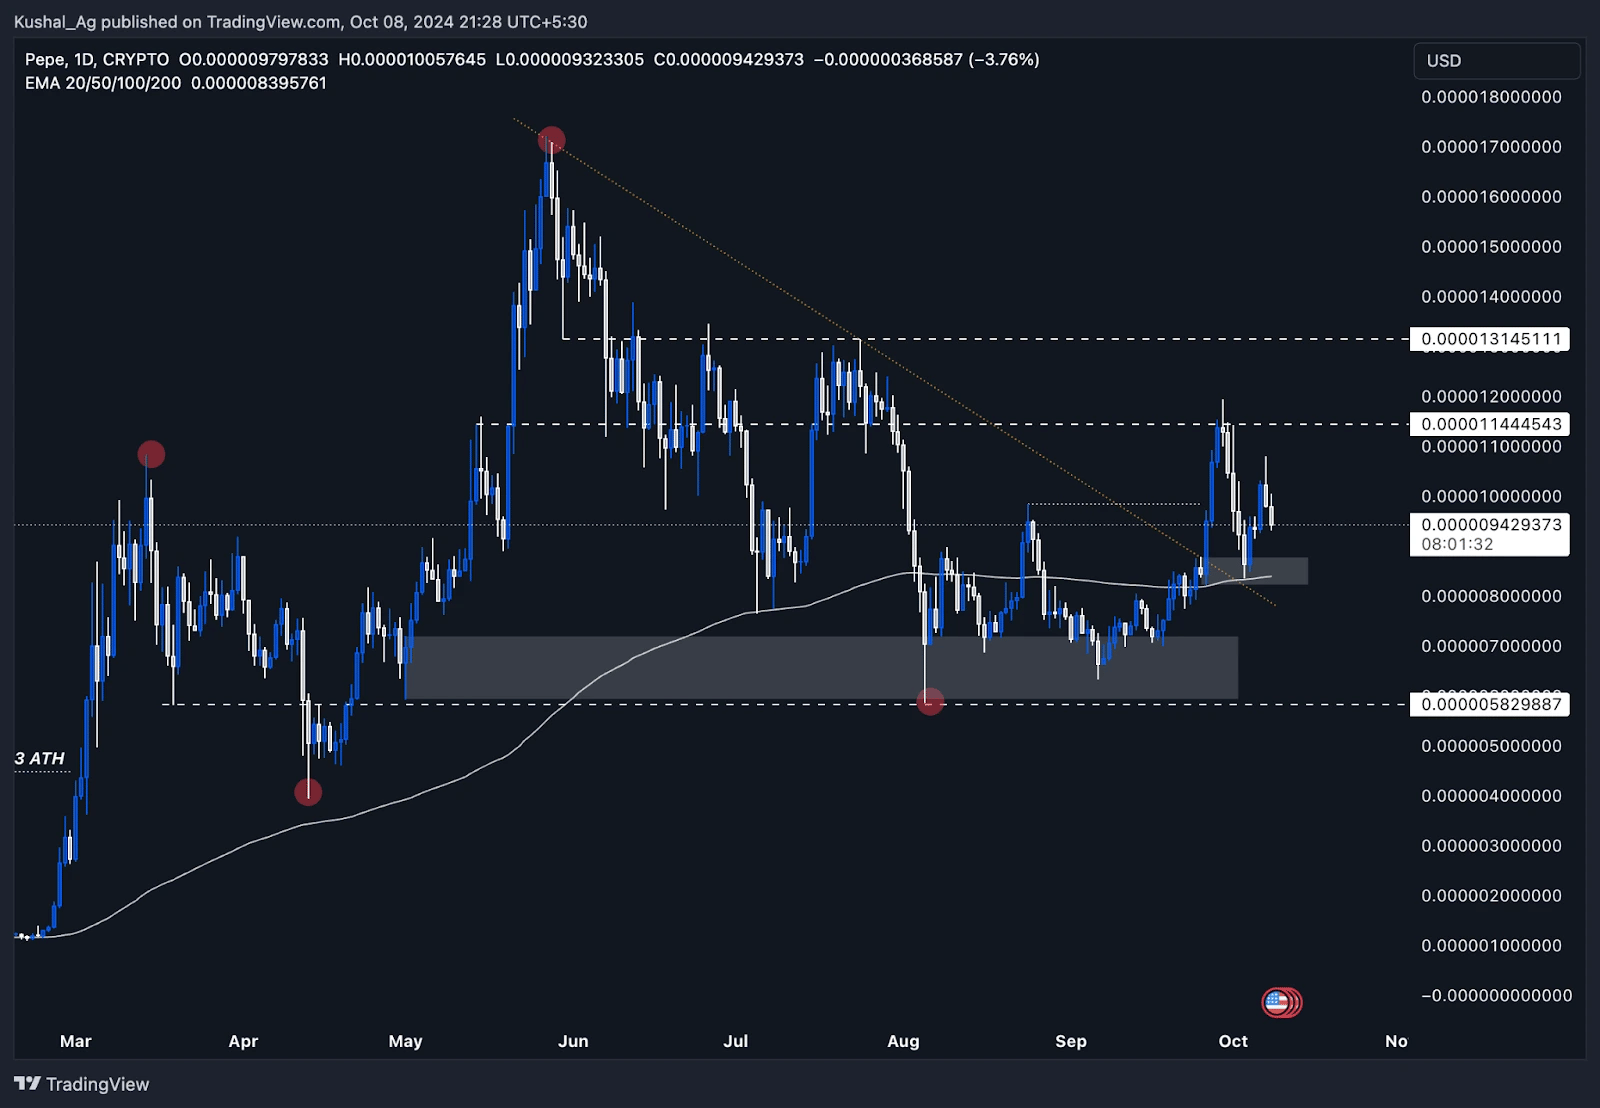
Recently, $PEPE broke out from its downtrend trendline in late September, as denoted by the orange dotted line on the chart. This breakout was accompanied by a strong 35%+ swing to the upside, highlighting renewed momentum within the asset. However, despite this bullish move, the price faced resistance around the $0.000011 level, which it failed to close above, marking a key level to watch going forward.
Currently, $PEPE is showing solid support around the $0.0000085 area, a level confluenced by the 200 EMA and a strong daily demand zone. The 200 EMA has proven to be a significant technical indicator, holding the price up and serving as a base for potential future rallies. This daily demand zone still remains intact, providing a crucial layer of support that could serve as a springboard for the next leg up.
Key levels:
- Support: $0.0000085 (200 EMA)
- Resistance: $0.000011 (short-term resistance), $0.000013 (next major resistance)
If $PEPE can flip the $0.000011 resistance into support, a continuation of the upward movement could target the $0.000013 level. From there, if the wider market conditions remain favourable, $PEPE has the potential to test its all-time high (ATH) and push into price discovery mode.
4-Hour timeframe analysis
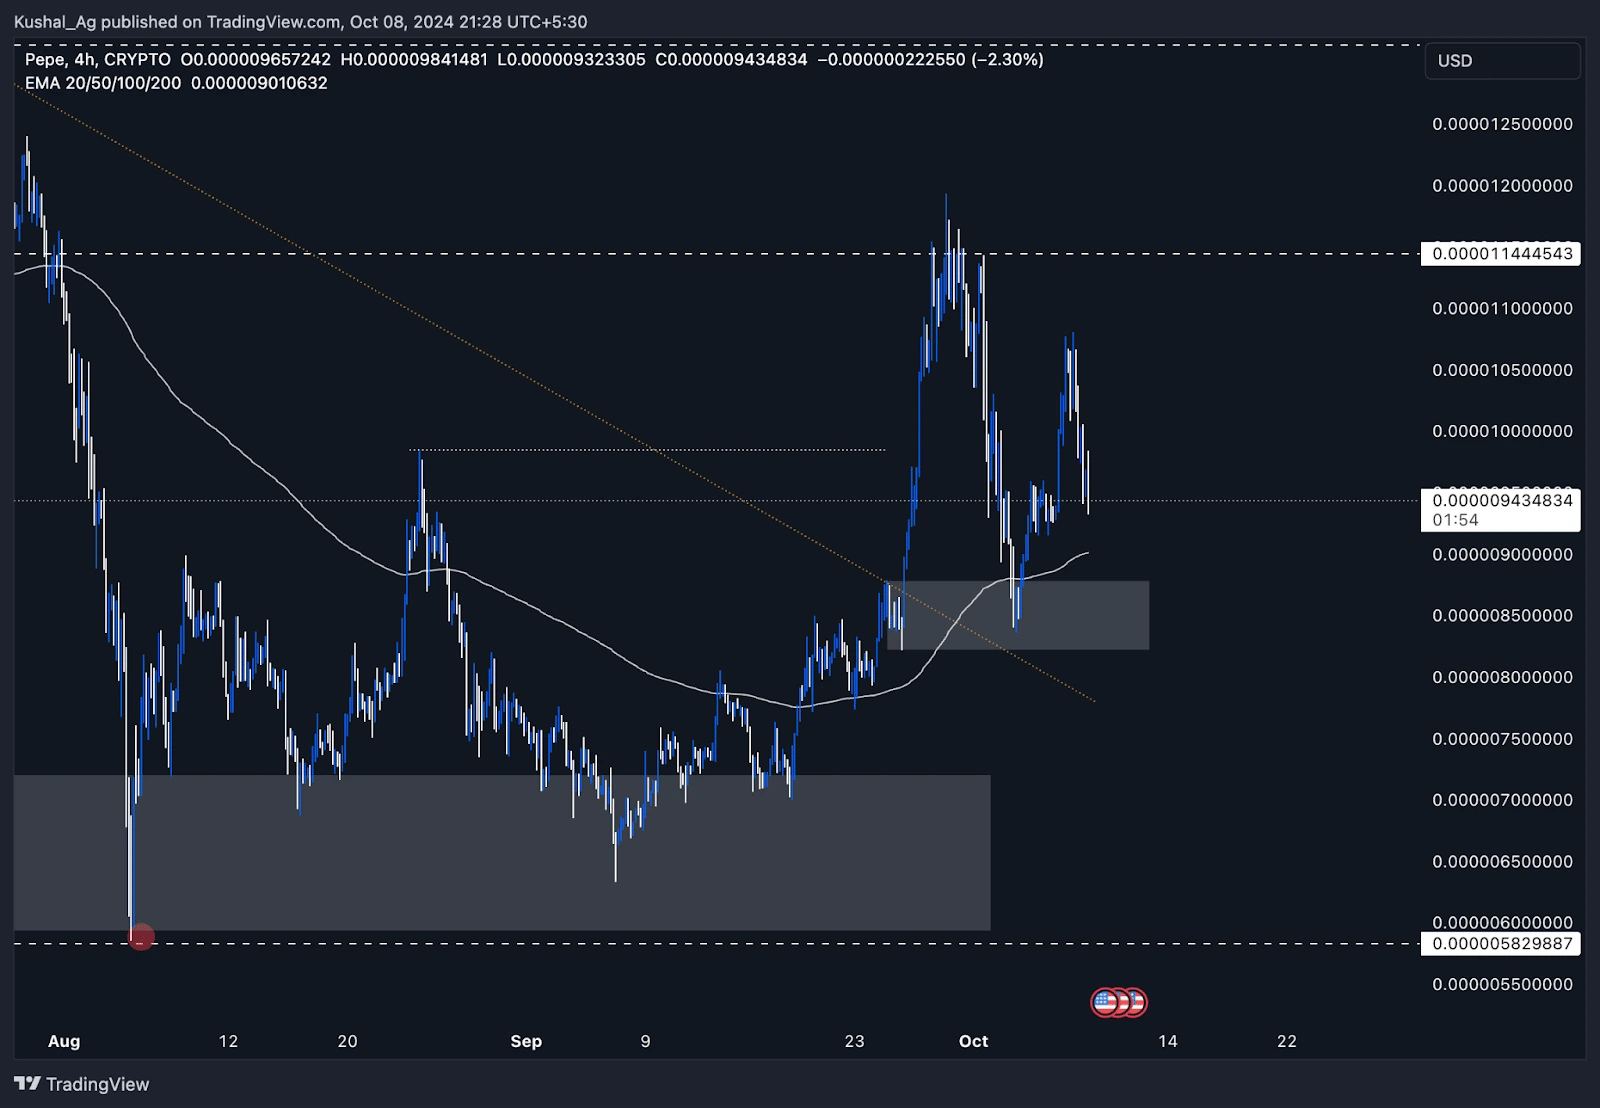
On the 4-hour chart, $PEPE has been consolidating between the $0.0000082 and $0.0000088 range, which also aligns with the 200 EMA on this timeframe.
During its breakout from the trendline in September, $PEPE printed an impulsive move, breaking previous swing highs, thus confirming a bullish structure on this lower timeframe. Price is currently retesting the 4-hour demand zone created in this breakout, which is marked by the grey box.
This demand zone (0.0000082 - 0.0000088) is a strong area where buyers previously stepped in, and it could serve as a key accumulation zone for long-term holders looking to capitalise on the recent pullback. Price has already tested the 200 EMA on this timeframe, and the confluence of the demand zone with this technical indicator gives this setup a favourable risk/reward ratio for long entries.
If the price can successfully hold above this demand zone and break past the immediate resistance at $0.000011, the next targets would be the $0.000013 resistance and the ATH beyond that.
Key levels:
- Support: $0.0000082 - $0.0000088 (4H demand zone)
- Resistance: $0.000011 (short-term resistance), $0.000013 (next major resistance)
Cryptonary's take
$PEPE is showing significant strength across both daily and 4-hour timeframes, positioning itself as a
meme coin to watch in the near term. With the recent breakouts from key trendlines, support zones holding strong, and positive confluence between multiple technical indicators, $PEPE could see a substantial upside if it manages to break above the $0.000011 and $0.000013 resistances.
That said, the inherent volatility of meme coins like $PEPE should not be underestimated. Investors need to proceed with caution, as these assets can experience sharp market corrections just as easily as they rally.
PARCL:
Market Context
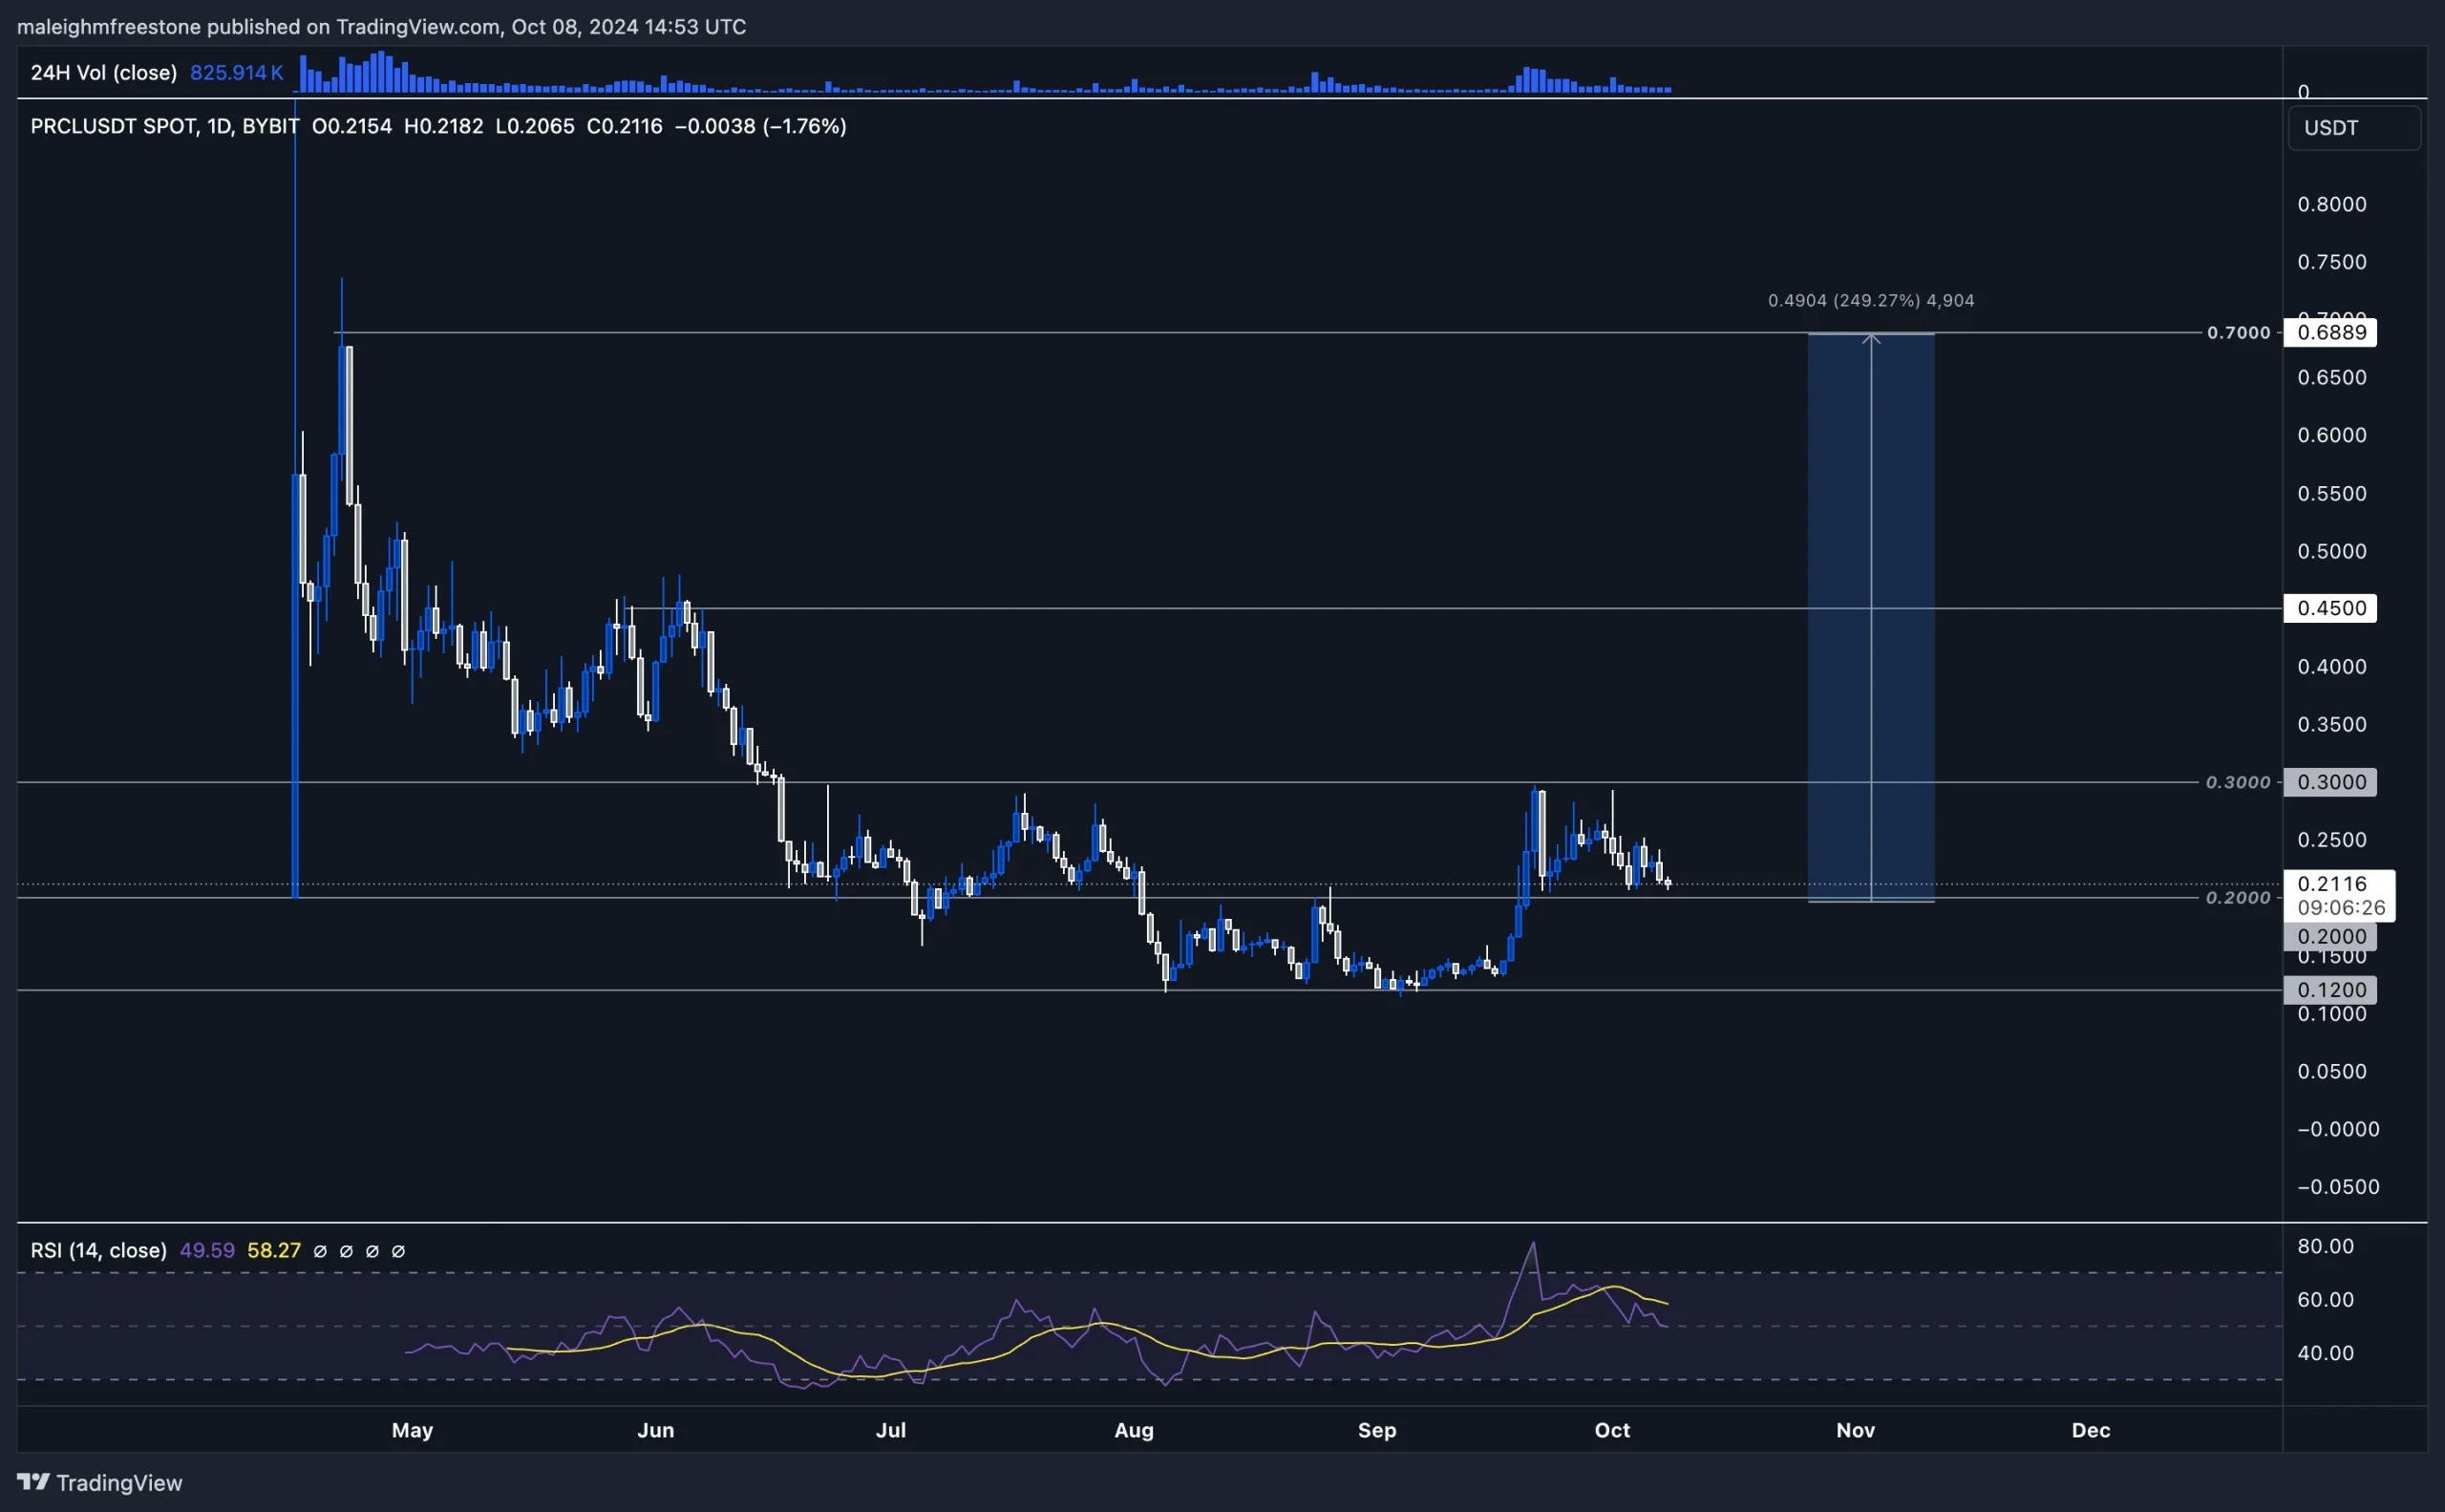
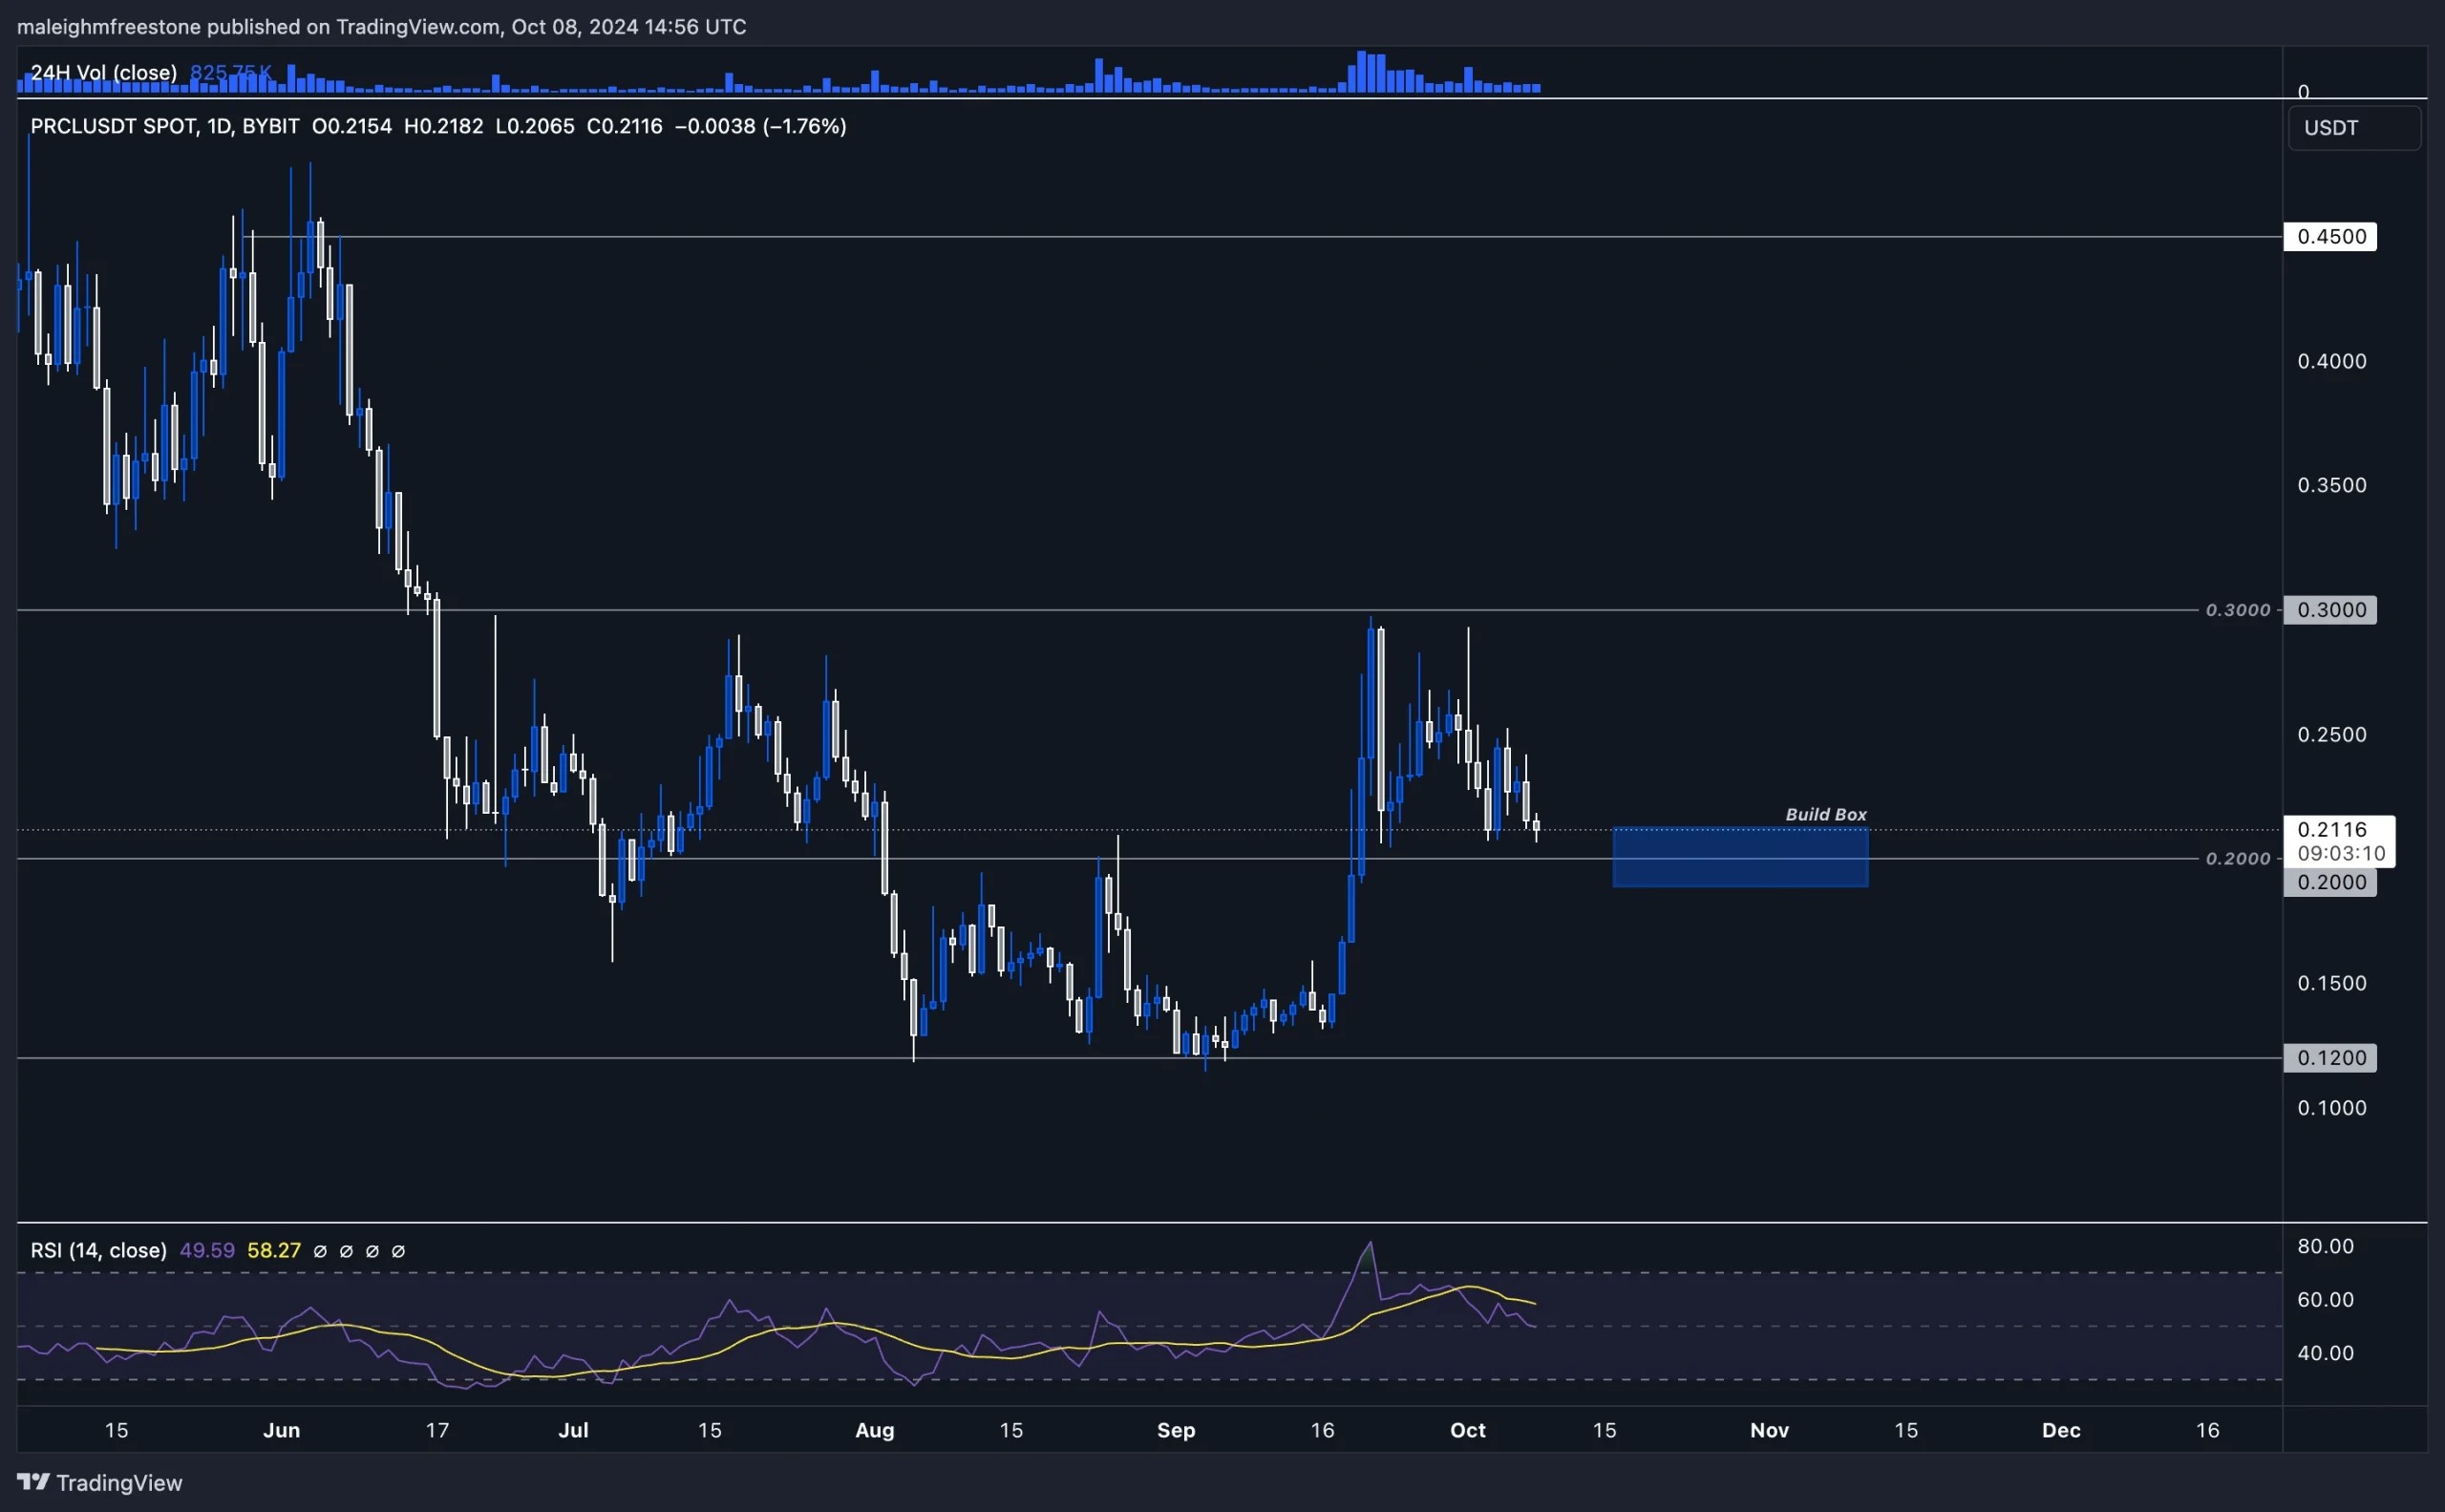
Parcl is an interesting asset. It initially entered the market as sentiment began to shift lower, which didn’t give it the best start. However, we’ve seen a lot of buying interest around the 0.12 price point, which is positive. Once demand picked up across the market, Parcel began trading higher, forming resistance on Monday, August 26th.
During this time, we saw some selling pressure, with the RSI ticking up slightly before the price sold off to the key psychological level of 0.2. This level has been significant historically. We used 0.2 as support, saw deviations around it, and then formed an inverted head and shoulders pattern between June 17th and July 31st. After that, the price sold off again and used 0.2 as resistance twice—once in early August and again at the end of the month.
On September 19th, we had a daily wick through this level, which failed to close above, but then we finally broke above it, with the price now using 0.2 as support. This is important because we’re seeing selling pressure into the level, but the breakout indicates a short-term shift in sentiment. The next key level to watch to the upside is 0.3.
We’re working with clear psychological numbers here, making it a key range for positioning. If we break above 0.3, the next target would be 0.45, which has shown liquidity from previous swing highs in June. Once 0.3 is cleared, we can anticipate the price to push toward 0.45.
Playbook
Key levels
- Support: 0.2
- Resistance: 0.3, 0.45, and 0.7 (Mid-term)
Accumulating plan
Currently, Parcl is range-bound between 0.2 and 0.3. Accumulating around 0.2 makes sense if you’re looking to build a position. If the asset breaks above 0.3, we should start seeing a move toward the next key range of 0.45. The ultimate checkpoint for bullish momentum is breaking above 0.45, which would open the door to testing higher levels like 0.7, where we can target all-time highs.
Risk management
The 0.2 level is key for accumulation. If the price fails to hold above this range, we’ll need to reassess. A break below 0.2 could signal further downside while maintaining support here gives a solid risk-to-reward setup for targeting higher levels like 0.45 and beyond
Market sentiment
With Parcel breaking out of key resistance and finding support at 0.2, the sentiment is starting to shift positively. While the asset is still in our C-Pro Picks, accumulating in this range offers a strong opportunity, with potential returns of around 250% if we see a move from current levels to 0.7.
Cryptonary’s take
Parcl is at an interesting stage. We’re range-bound between 0.2 and 0.3, and while it’s still early, accumulating around 0.2 provides a solid setup. A breakout above 0.45 would signal bullish momentum, and a move to 0.7 could present a return of 250%. This is definitely one to keep an eye on as we must consider the market condition parcl entered into, and at these prices, it offers a great risk-to-reward ratio spot play even to all-time highs.