Save 23% ($351) & Get a Free 1-1 Call with our Team ⏰ : 0d 2h 59m 43s
Disclaimer: This is not financial or investment advice. You are responsible for any capital-related decisions you make, and only you are accountable for the results.
Injective ($INJ):
Overview
Injective ($INJ) has recently mitigated deep into its 3D time frame demand zone, marked by the blue box in previous reports, ranging between $18.8 and $16. The price wicked down to $17.3, where it found buying interest and is now attempting to bounce.Currently, INJ is trading at $20.4, sitting just below the 3D 200 EMA, which is positioned at $20.78. This key level previously acted as support, but reclaiming it will be crucial for bullish continuation now that it has been lost.
Analysis & key levels
- Support levels:
- $18.8 - $16 (3D Demand Zone): Strong accumulation zone where price reacted positively.
- $17.3: The most recent local low, signalling potential demand in this range.
- Resistance levels:
- $20.78 (3D 200 EMA): Immediate resistance; reclaiming this level is crucial.
- $22.5: Next resistance zone above the 200 EMA.
- $26.25: Major resistance level to break for a higher-time frame bullish structure.
Potential scenarios
- Bullish case: If INJ flips the 200 EMA into support, it could push towards $22.5, and a successful reclaim of that level would open doors to $26.25 in the medium term.
- Bearish case: If INJ fails to reclaim the 200 EMA and breaks below $18.8, it may revisit $16, the lower bound of the demand zone, or even push lower if the weakness persists.

Cryptonary's take
Injective is at a critical point, sitting just below its 3D 200 EMA after a strong reaction from the demand zone. The bounce from $17.3 indicates demand, but a confirmed reclaim of $20.78 will be key for bullish momentum to resume.The broader market conditions will play a role in whether INJ can sustain this recovery or whether another leg down into the $16 region is possible. Holding the demand zone is crucial, and if INJ flips key resistance levels, we could see a trend shift towards $22.5 and beyond.
Tron ($TRX):
Overview
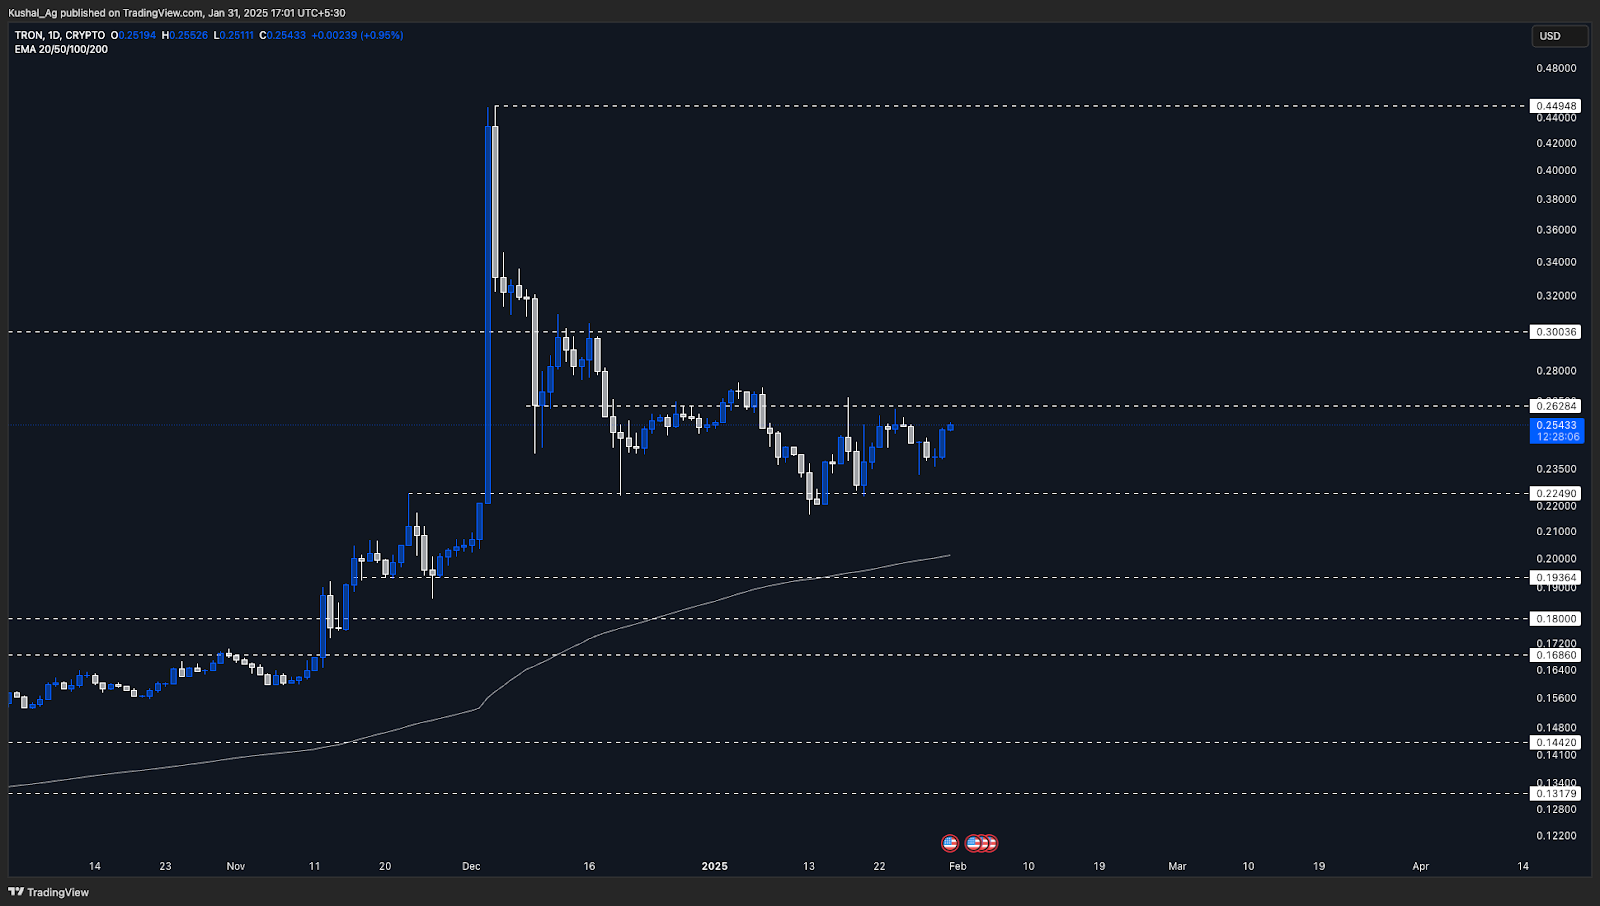
Tron ($TRX) has maintained a strong bullish structure after its massive breakout on December 3, 2024, where it surged from $0.22 to $0.449 in a single day. This move broke above the 2017 all-time high of $0.30, marking a significant technical shift. However, following this rally, TRX retraced and entered a consolidation phase, holding above $0.2249 as support while facing resistance at $0.2628.Currently, TRX is trading at $0.254, and the next breakout direction will likely determine the asset's short to medium-term trajectory.
Analysis & key levels
- Support levels:
- $0.2249 (Bottom of the Current Range): Strong support that has held throughout consolidation.
- $0.2000 (200 EMA on the Daily Time Frame): Dynamic support that could provide a strong bounce.
- $0.1930: Another key historical support, confluences with previous consolidation zones.
- Resistance levels:
- $0.2628 (Range High): Immediate resistance; breaking above this could trigger upside momentum.
- $0.3000 (2017 ATH): A major psychological and technical resistance level.
- $0.4490 (December 2024 ATH): The ultimate breakout level; clearing this could open the door for price discovery.
Potential scenarios
- Bullish case: If TRX holds above $0.2249 and breaks past $0.2628, it could challenge $0.30, and flipping that level into support could send TRX toward its December ATH at $0.449.
- Bearish case: If TRX fails to hold $0.2249 and breaks below, we might see a deeper retracement toward $0.20 (200 EMA) and potentially $0.193. A loss of the 200 EMA could weaken the structure further.
Cryptonary's take
Tron has been showing strong momentum even during broader market pullbacks. This consolidation phase is crucial, as a breakout from the current range will define the next move.If $0.2628 is broken with volume, it could be a signal for further upside continuation, with $0.30 as the next milestone. However, if support at $0.2249 fails, TRX may retest lower levels, presenting a potential accumulation opportunity around the 200 EMA.
SUI:
Market contextSUI is still holding its ground as one of the top assets this cycle despite the overall bearish sentiment in the market. It’s the 14th largest asset by market cap and continues to trade near all-time highs. This shows that even in tough conditions, assets like SUI can find liquidity and volume to push higher.

Performance updates
- SUI’s momentum hasn’t slowed down. The asset’s strong rally has kept it near price discovery territory, making it one of the few assets leading the way while the rest of the market struggles.
- Recent price action keeps proving that SUI has serious demand backing it, especially at key levels.
Key levels to watch
- $3.5 Buy Zone Confirmed: On December 20th, the price wicked into the $3.5–$4 range and bounced hard, forming a bullish hammer candle. This move sent the price 30% higher, confirming strong demand here.
- Reaffirmed Demand: Each retest of $3.5 has brought similar reactions, proving this range is where buyers step in aggressively.
- $4 Holding Strong: $4 has consistently acted as support, and reclaiming this level shows buyers are active and accumulating in this zone.
Updated playbook
- A pullback is natural after such a strong rally, and it’ll likely give another shot at building positions.
Spot accumulation:
- The $3.5–$4 zone remains the key buy box. This range has shown consistent demand, and it’s the best spot to look for entries.
Breakout play:
- If the price breaks and holds above $4.8, it’s a signal for continuation and possibly price discovery.
Risk management:
If $3.4 fails, reassess and watch for where the price stabilises. Stick to levels that show clear buying interest.Cryptonary’s take
SUI’s performance continues to impress. It’s holding key levels like $3.5 and $4 and showing strong buyer interest, even when the broader market looks weak. The $3.5–$4 zone is still a great accumulation area, and a break above $4.8 could open up more upside. For now, staying disciplined and watching these levels is the best approach.
Recommended from Cryptonary


