Save 23% ($351) & Get a Free 1-1 Call with our Team ⏰ : 0d 2h 59m 43s
Is the macro environment shifting in our favour?
The market is heating up, and the winds of change are blowing in our favour. Following the latest inflation data, the crypto landscape is poised for a surge, with Bitcoin leading the charge. But that's not all—the duo of Ethereum and Solana is gearing up for a breakout, promising potential gains that will inject life into your portfolio.

Following today's positive inflation data, we expect crypto to begin climbing higher, and we should target some decent performance for the rest of this week.
For now, we remain in the barbell portfolio.
Let's see how prices perform the rest of the week, as that may be somewhat telling for the weeks beyond that.
TLDR
- Bitcoin finds support, and it is poised for a potential retest of $70k after the inflation data surprise.
- Positive market mechanics and technical indicators across assets signal potential upside around the corner.
- Ethereum and Solana set up for a bullish reversal, eyeing crucial resistance breakouts.
- WIF and POPCAT have solidified their positions as blue-chip meme tokens; we are confident that they still have much room to run from current prices.
Disclaimer: This is not financial or investment advice. You are responsible for any capital-related decisions you make, and only you are accountable for the results.
BTC
Following today's downside surprise in the inflation data, we've seen a shift to risking-on from the market. This means a bid in the S&P and other risk assets (crypto), with bond yields and the Dollar Index ($DXY) both falling. This is all positive for Crypto.For a number of weeks, the amount of Open Interest (leverage) has been at the $28b level. However, yesterday, this more meaningfully ticked up to $29.8b. This remains well below the excessive highs we saw in March when Open Interest hit $36b. We're still currently at healthy levels.
The Funding Rate also remains healthy between 0.00% and 0.01%. This indicates there isn't any imbalance in positioning between Longs and Shorts. Overall, this is a positive setup from a leverage market perspective.
Technical analysis
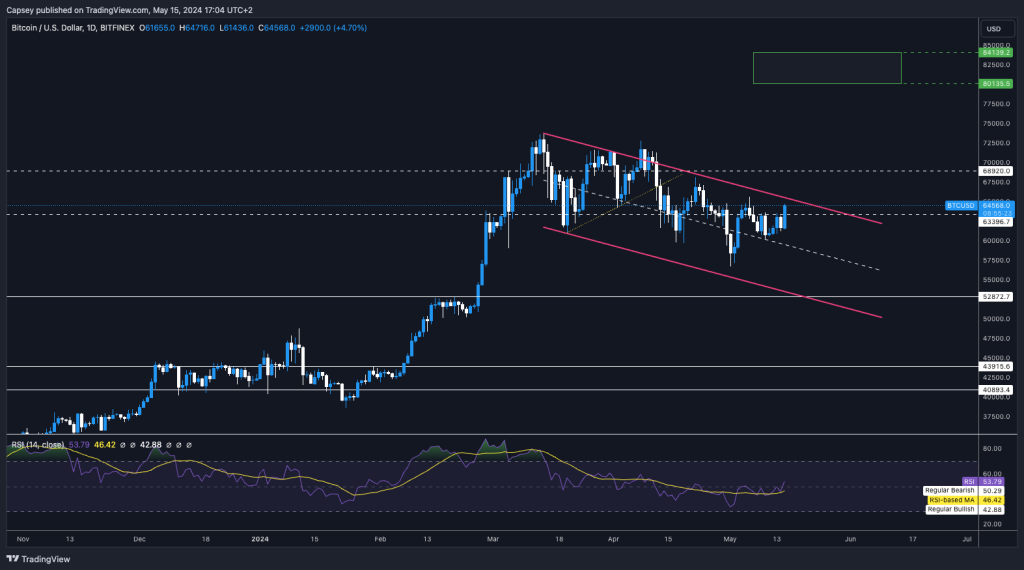
- Bitcoin's price has performed well because it has found support on the 50% line of the larger bull flag.
- Following the above, price was able to breach above the key horizontal level of $63,300 on today's positive inflation data.
- There is a local resistance at $64,700, which is also close to the top border of the bull flag. Both levels will likely act as a resistance for Bitcoin. If Bitcoin can breakout of this level, this would be hugely positive.
- Beyond this, there is horizontal resistance at $68,900 and then the all-time high at $73,500.
- This period of sideways chop/consolidation over the past two months has given trading indicators such as the RSI the chance to reset more meaningfully on the larger timeframes. This is important if we want to see a more sustained, longer-term upside for BTC.
Cryptonary's take
We thought Bitcoin might need more time to break out of the bull flag; however, following last week's moderation in the labour market data and today's lower-than-expected inflation data, the market looks good to potentially move higher.As we can see from the TA section above, Bitcoin price-wise does have a few horizontal resistances just above the current price. But if price can climb above these levels, then we may be on for a retest of $70k far sooner than we expected. Bitcoin could be at a key inflection point here. If price can climb and get comfortably out of the bull flag, then expect potentially a 10% move higher.
ETH
The mechanics look clean. Funding is at 0.01%, while Open Interest has remained relatively flat for a few weeks now. The leverage interest seems to be in other coins rather than ETH. Either way, this is a healthy leverage market setup for ETH.Technical analysis
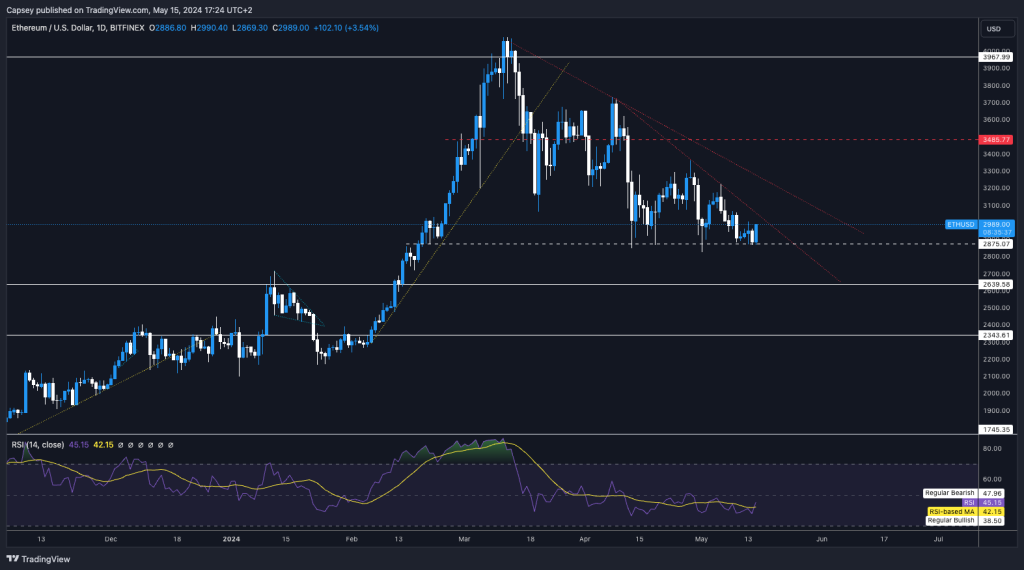
- Having been in a general downtrend for a month now, ETH has also done well to hold the $2,875 horizontal support (this was previously at $2,900, we've adjusted it slightly).
- If price has successfully hammered out this bottom at $2,875, we'd expect price to break out of the local downtrend line and attempt a move up to the next red downtrend line; this is where the real breakout would come.
- The last few months of downtrending price action have reset the RSI on the larger timeframes. This is positive for a sustained move up in price.
- Whilst we're still quite a way off all-time highs, there are local resistances for price to overcome in the meantime. The key horizontal resistance for price to get above is $3,485 (again, slightly adjusted from the original $3,525).
Cryptonary's take
The take here is that it looks like we're set up for the market to do well, and ETH is likely to be pulled up with this. For now, it seems a base at $2,875 has been marked, and if price can break out of the downtrend line (we think it can), then we could see $3,200 to $3,300 in the upcoming week.Whilst we still expect ETH to underperform against SOL and other SOL plays, we do think the general market can continue on higher and drag ETH up with it.
SOL
On the market mechanics front, SOL looks similar to ETH in that Open Interest hasn't increased much at all, meaning there isn't a pile in to leverage, which is, of course, positive for prices potentially going higher.Alongside this, the Funding Rate is at 0.01%. This means there is a slight bias amongst traders to be Long rather than Short. However, positioning is relatively evenly balanced, which is positive.
Technical analysis
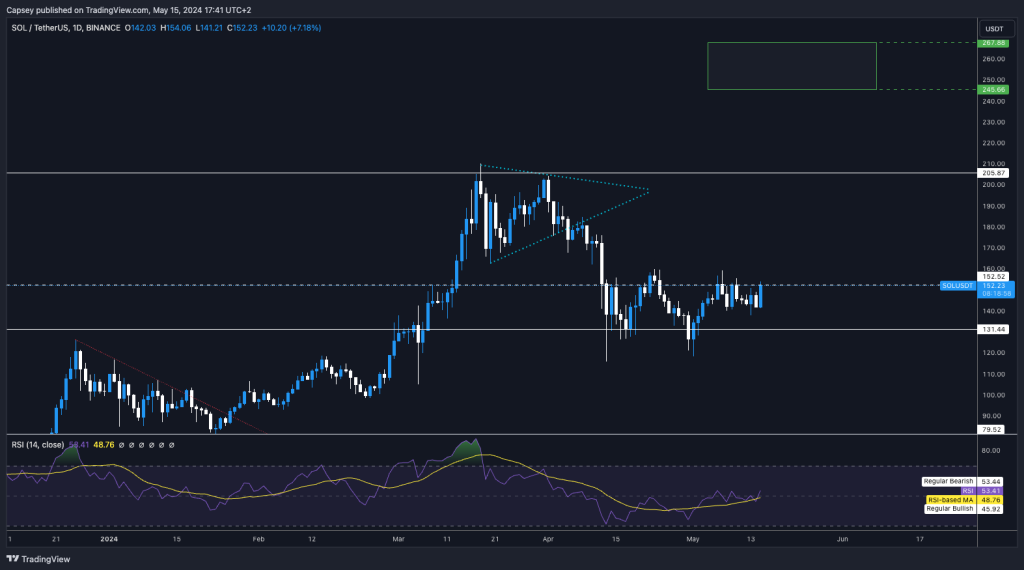
- SOL is at an inflection point here, and you want and need to see it breakout to the upside.
- For the past month, SOL has been range-bound between horizontal support at $131 and horizontal resistance at $151/$152. To see the bullish reversal, we need to see price cleanly breakout above $151/$152. We're currently getting that, but we need to see the follow-through over the next few days.
- Since SOL put in its cycle price high in mid-March, we've seen the price pullback and this has substantially reset the RSI on the larger timeframes. This is positive for potentially fuelling more significant upside moves.
- Beyond $151, there is a local horizontal resistance at $170 that we should be mindful of.
Cryptonary's take
It's crucial for SOL that we get a clean break above $151/$152 over the coming days if we want to see a more sustained upside in price in the short term. If price can't break out, then we'll remain in the range. Long-term, of course, we still love SOL and think it'll be the major outperformer. If price revisits the $120 to $140 range, we'd lightly add to our bags.WIF
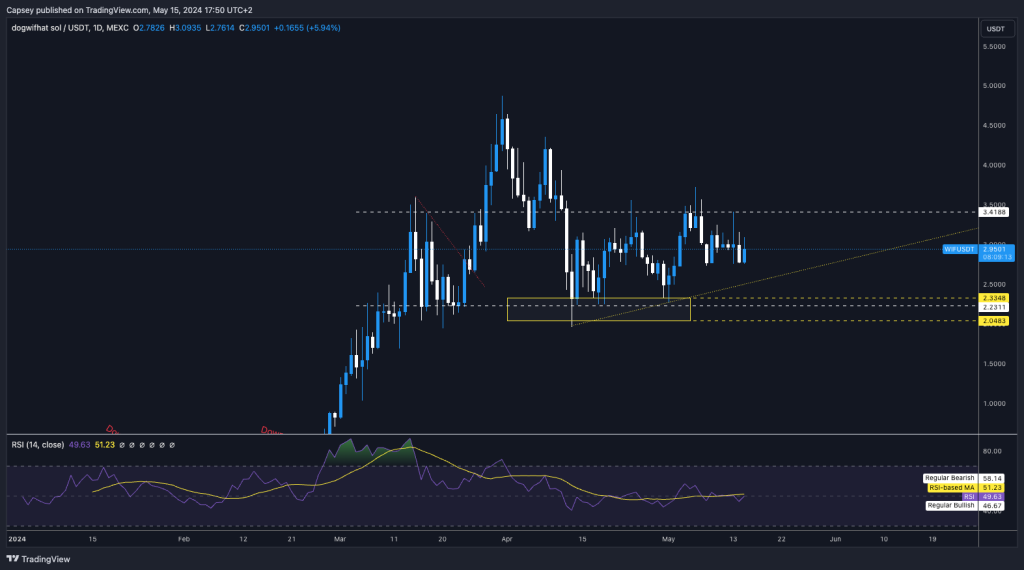
Having bounced perfectly from the Yellow Buy Box between $2.04 and $2.33, WIF has put in a series of higher lows, which is positive for price.- The local horizontal support is at $2.75, with the major support at $2.23.
- To the upside, the major horizontal resistance is $3.41. A breakout above this level would be game on for WIF and likely see $4.50 retested relatively swiftly.
Cryptonary's take
For now, we're keeping the analysis on WIF relatively straightforward. WIF is range-bound between $2.23 and $3.40, and we won't likely see a major move until price breaks out of or below either of these levels. We still see WIF as more likely to break to the upside, although this may take some more time. The key level for WIF to breakout of is $3.40. Patience until then and accumulation at the lows.POPCAT
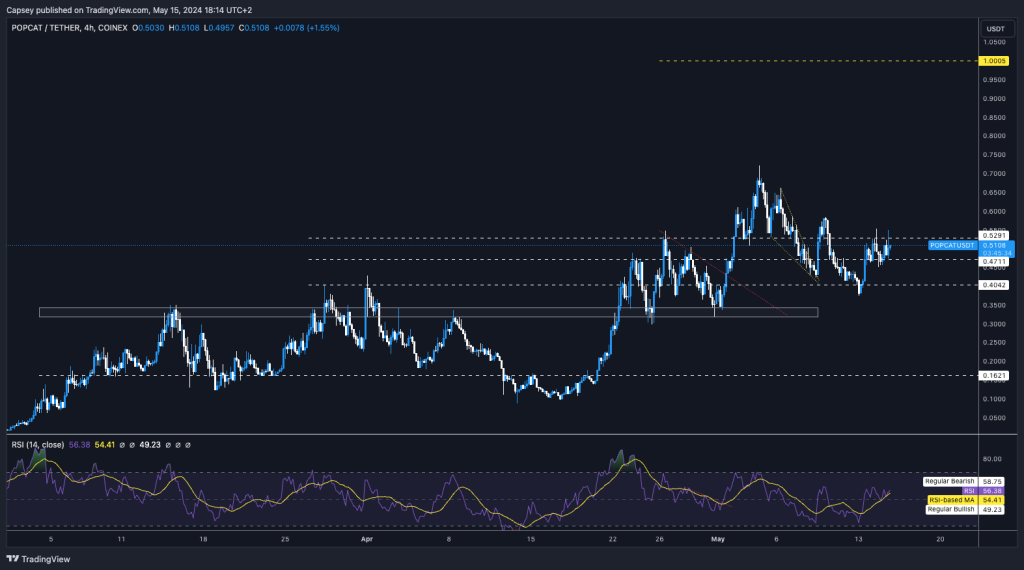
The chart posted below is the 4-hour chart; take note of that.We originally felt that $0.40 to $0.46 would be the zone of support from which the price could bounce. We did get a slight deviation below that, but it was a quick recovery, which was good.
- Price is now seeming to battle between two key ranges: support at $0.47 and resistance at $0.53.
- If price can rise above the $0.55 to $0.58 area, this would be a bullish catalyst that could send us back to the highs at $0.70.
- The major range for price is the support at $0.40 and the overhead level at $0.58. For now, we'd exercise patience while price remains between these levels.
Cryptonary's take
In my (Tom) opinion, this is all ok here.Let price work this range out, and let's zoom out for some perspective. One month ago exactly, price was at $0.13, and one month before that, price was at $0.28, and one month before that (so 3 months ago), price was less than $0.01.
At this time, it looks likely that $POPCAT has cemented itself in the 'Blue Chips' category for memes, which is a big part of the price battle - winning the narrative. In the short term, it's very hard to say what will happen with POPCAT and memes in general.
But we believe staying in the winners (WIF, POPCAT) is the play. Remember, zoom out, and in 3-6 months, we see $POPCAT as substantially higher than its current $0.50 price, although three months ago, if we had told you POPCAT would be at $0.50 today, you would have called for our heads, but here we are. So, be patient, but have confidence that we are going higher.
Recommended from Cryptonary


