Save 23% ($351) & Get a Free 1-1 Call with our Team ⏰ : 0d 2h 59m 44s
Is this the end of the bull? | Jan 16th
We need to be honest with you. Do we believe this rally could have an impact on your long-term gains? Absolutely not. What you’re seeing now is just an opportunity to make money and/or accumulate. No, we will not be going to ATHs this year and no, you will not get rich from holding throughout 2023.
However, it can be the foundation of your wealth. If you accumulate now, you might just be making the best decision you could ever make and you wouldn't even know it yet. Or hey, you can just take advantage of the pump and make some money in the short-term. Either way, you win.
Disclaimer: Not financial or investment advice. You are responsible for any capital-related decisions you make, and only you are accountable for the results.
TLDR
- Bitcoin and Ether have reclaimed their 2017 all-time high levels. We expect both BTC and ETH to go up in the coming weeks.
- SNX is close to breaking a 609-day old resistance.
- DYDX has god-like potential. Read to find out why.
Total Market Cap
The Total Market Cap index represents the entire valuation of the cryptocurrency market. We track this index to understand where the market is now and where it will be going. Every pack of wolves has an alpha male. This chart is the alpha male of the crypto pack, because where this goes, the entire market follows.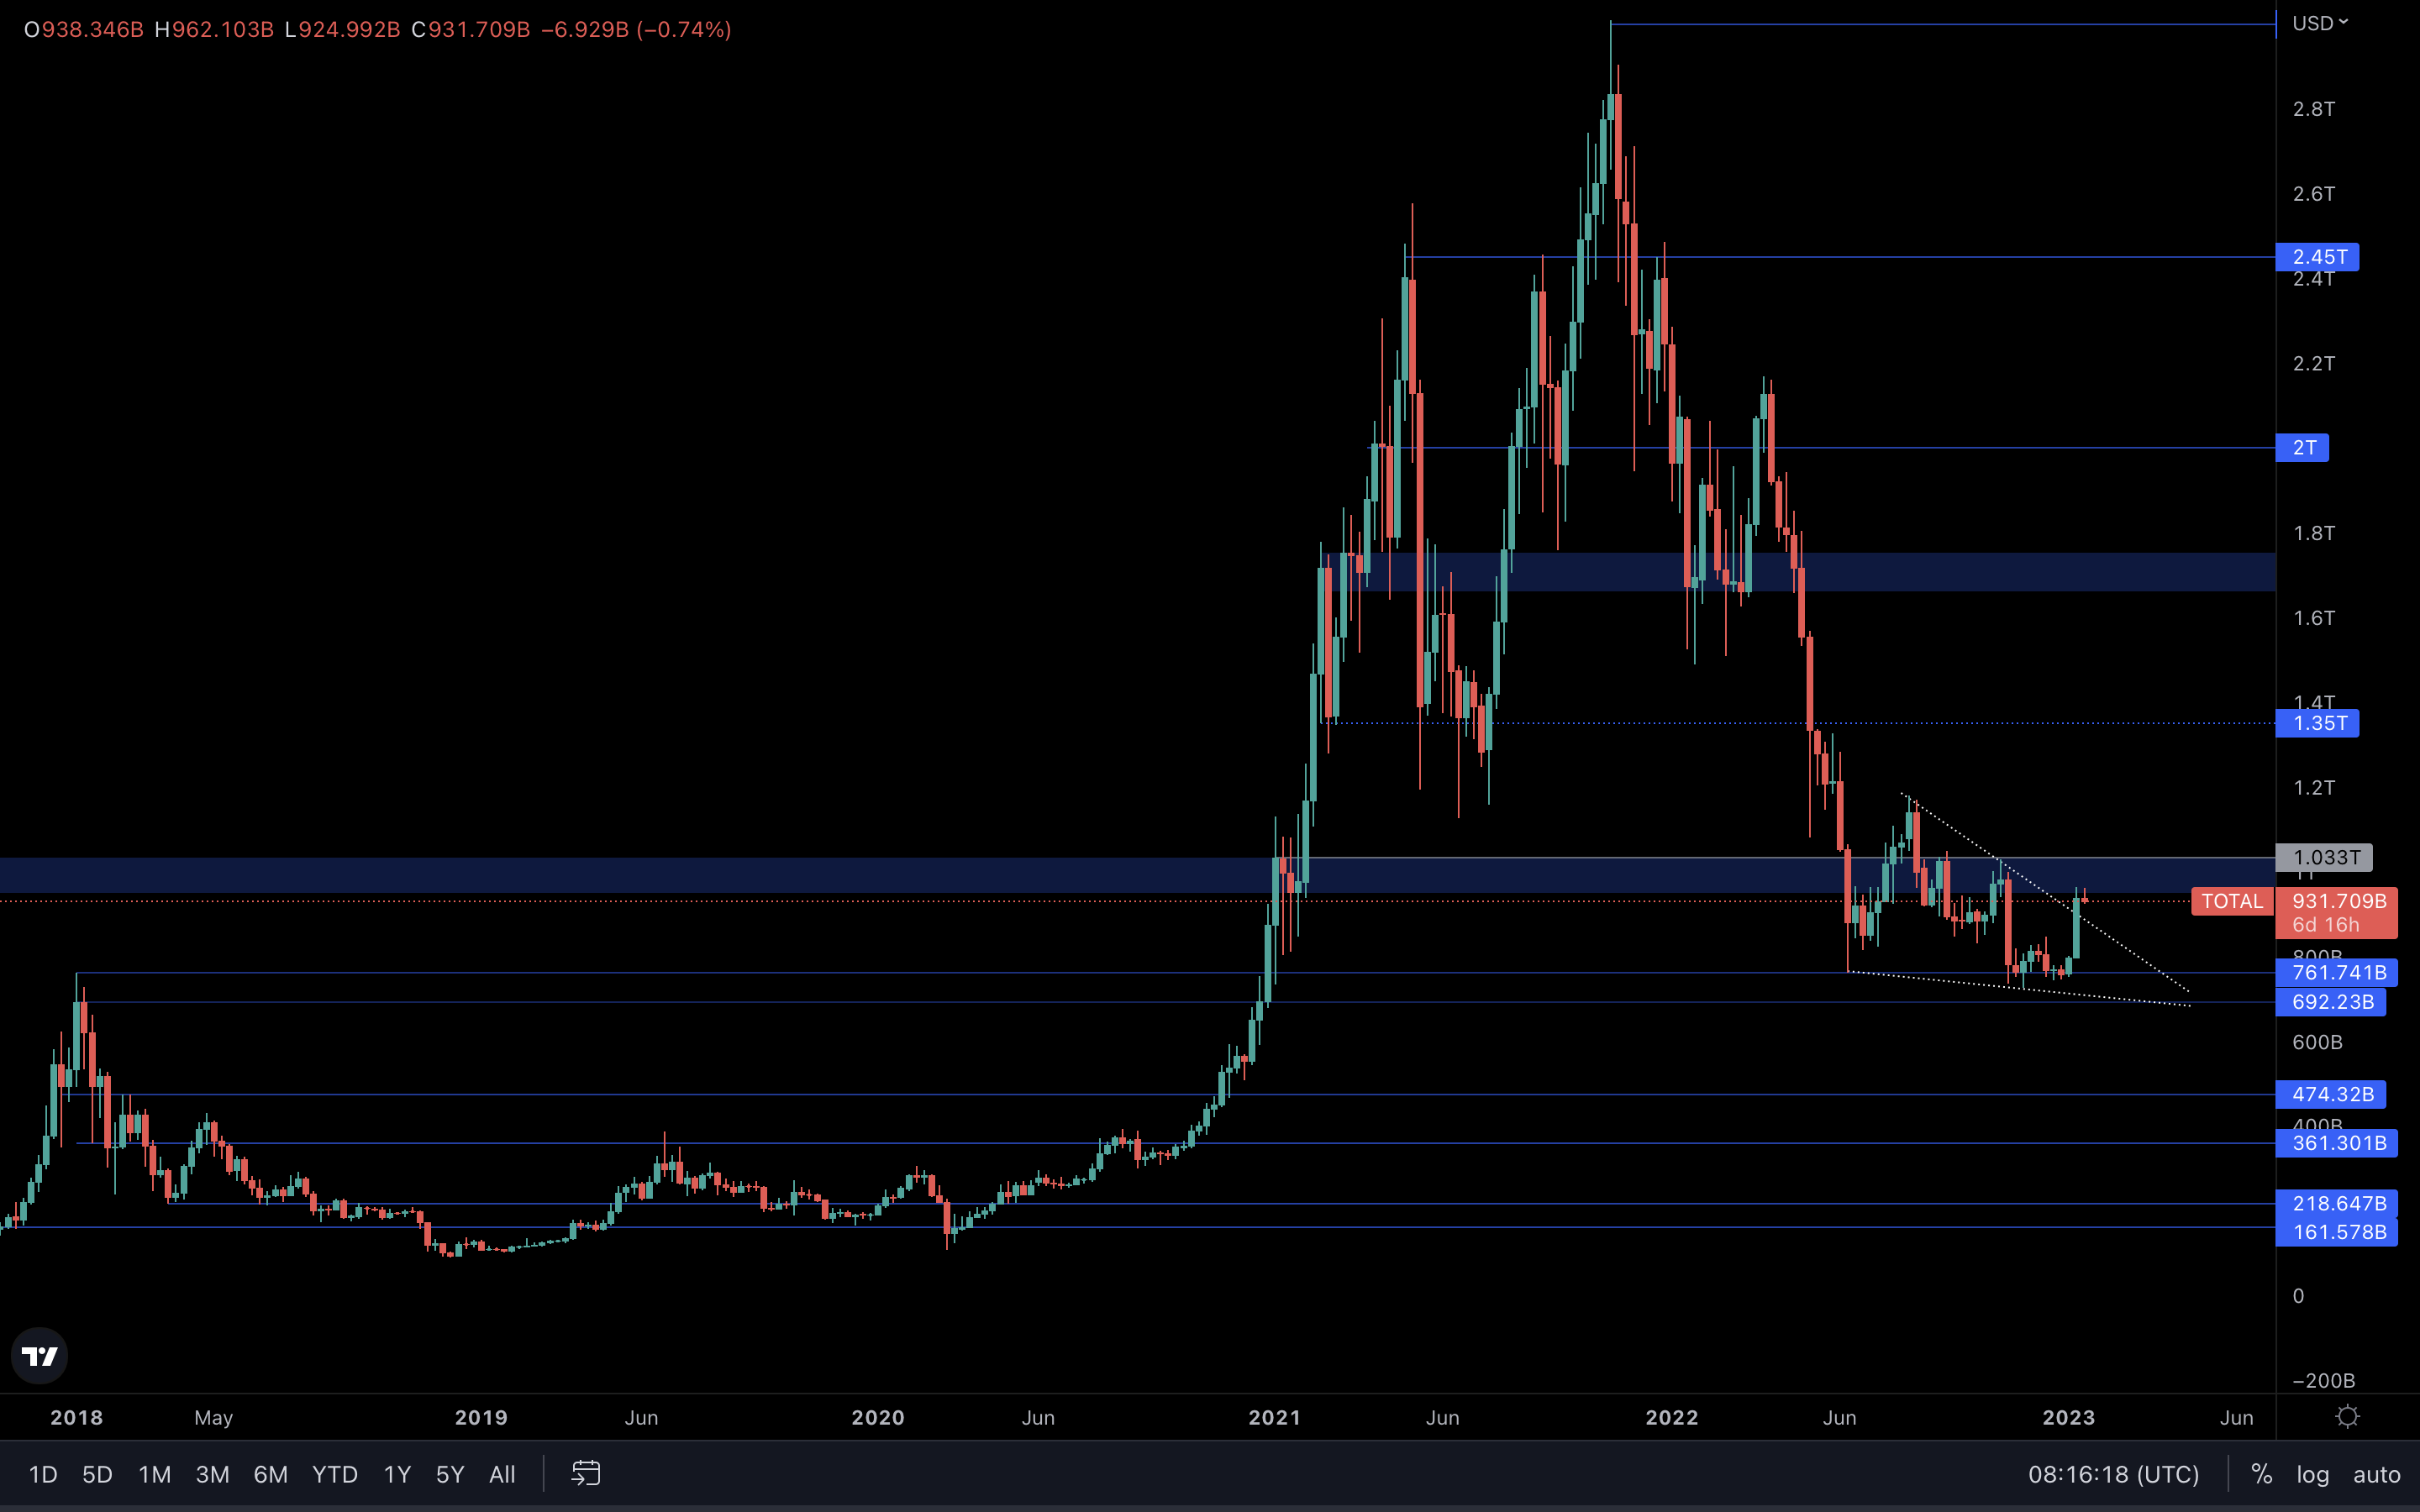
Last week, we saw a break above the falling wedge’s upper trend line. This confirms that more upside is yet to come. However, the Total Market Cap index is currently testing resistance. For this rally to continue for longer, we’ll need a reclaim of $1.03T, which happens to be the first target after the breakout from the wedge. As long as we stay at resistance, there’s always a chance for sellers to gain the upper hand, push the market lower, and cause a rejection of the Total Market Cap from this level. It’s hard to predict if we could see a reclaim of $1.03T this week, as the daily timeframe is completely exhausted and overextended. A slight slowdown in prices is likely on the cards after such a move (23% increase on the market in 7 days without any stops whatsoever). Keep that in mind as we head into this week.
Altcoins Market Cap
The Altcoins Market Cap index represents the entire evaluation of the altcoins market. Imagine all altcoins in the same basket, but Bitcoin in a different one, with price labels on the baskets.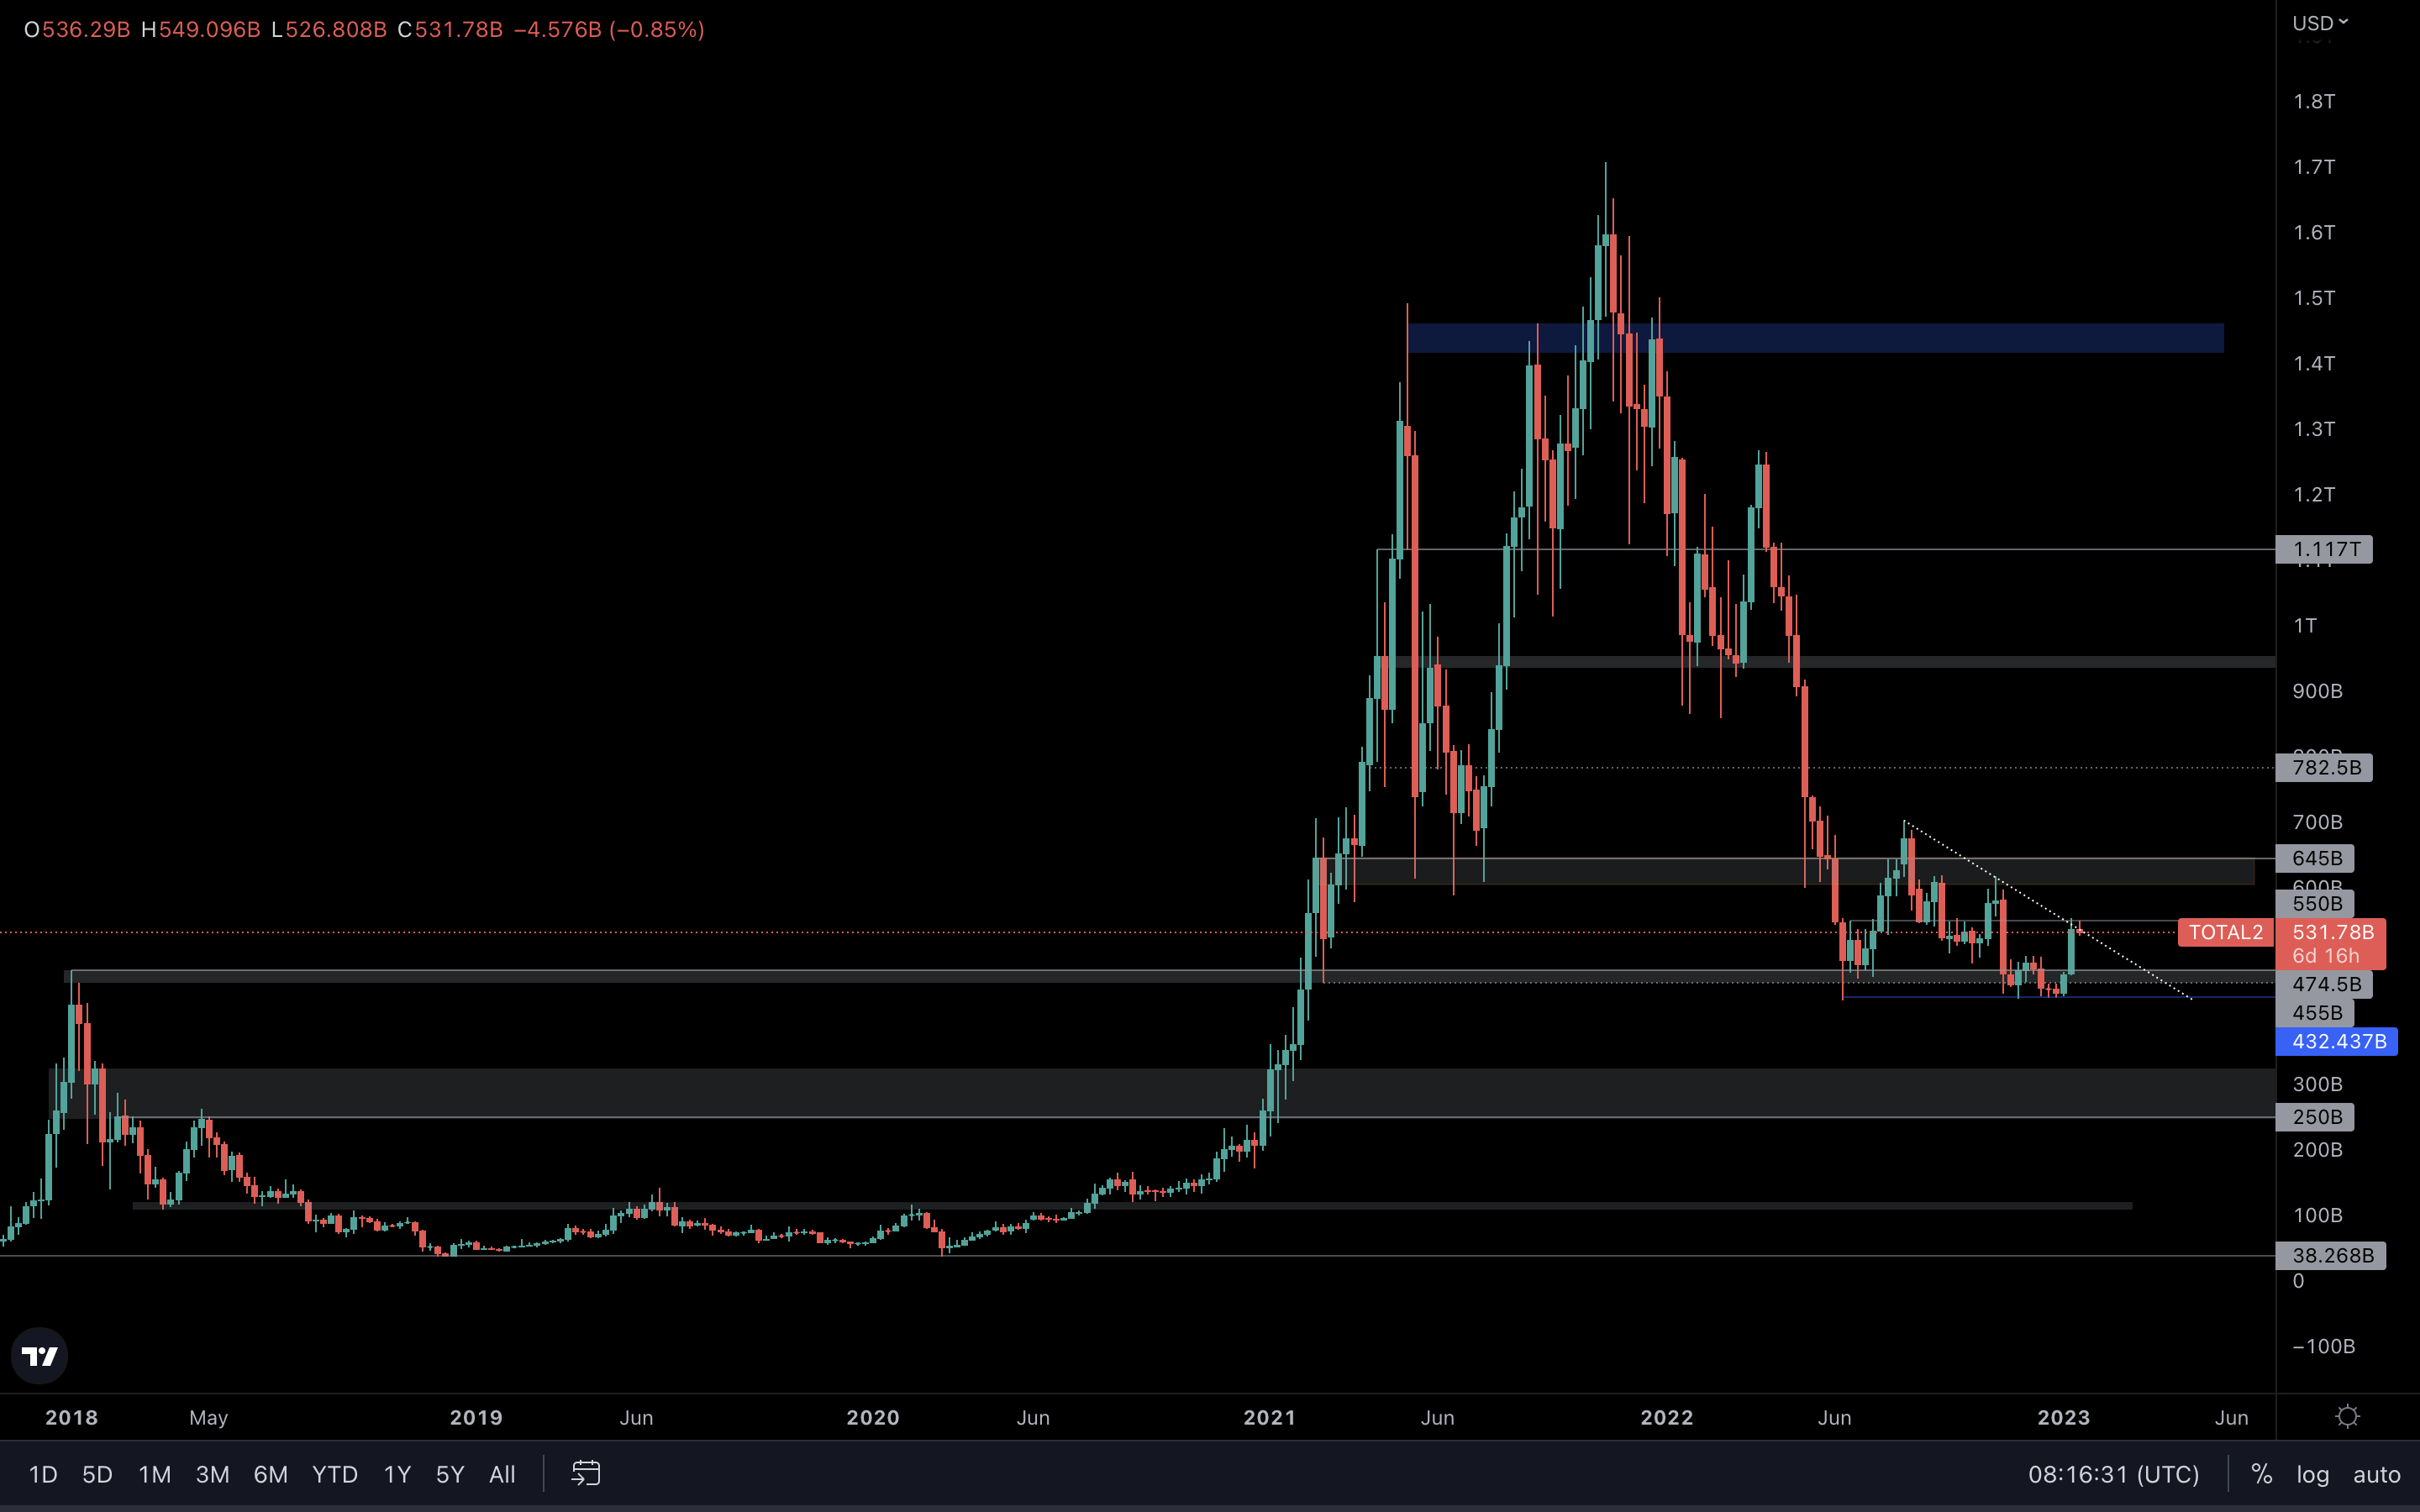
Unlike the Total MCap index, this index hasn’t broken resistance yet. We’ll need to see a reclaim of $550B, which currently acts as resistance on this chart, before confirming more upside. In the meantime, keep in mind that we could see pullbacks across the altcoins market in the next few days. This is normal and shouldn’t worry us at all, especially after both BTC & ETH have reclaimed their 2017 all-time highs, something which we’ll explore below.
DPI | DeFi Index
The DPI (DeFi Pulse Index) measures the overall health and performance of the DeFi market, which should interest all market participants.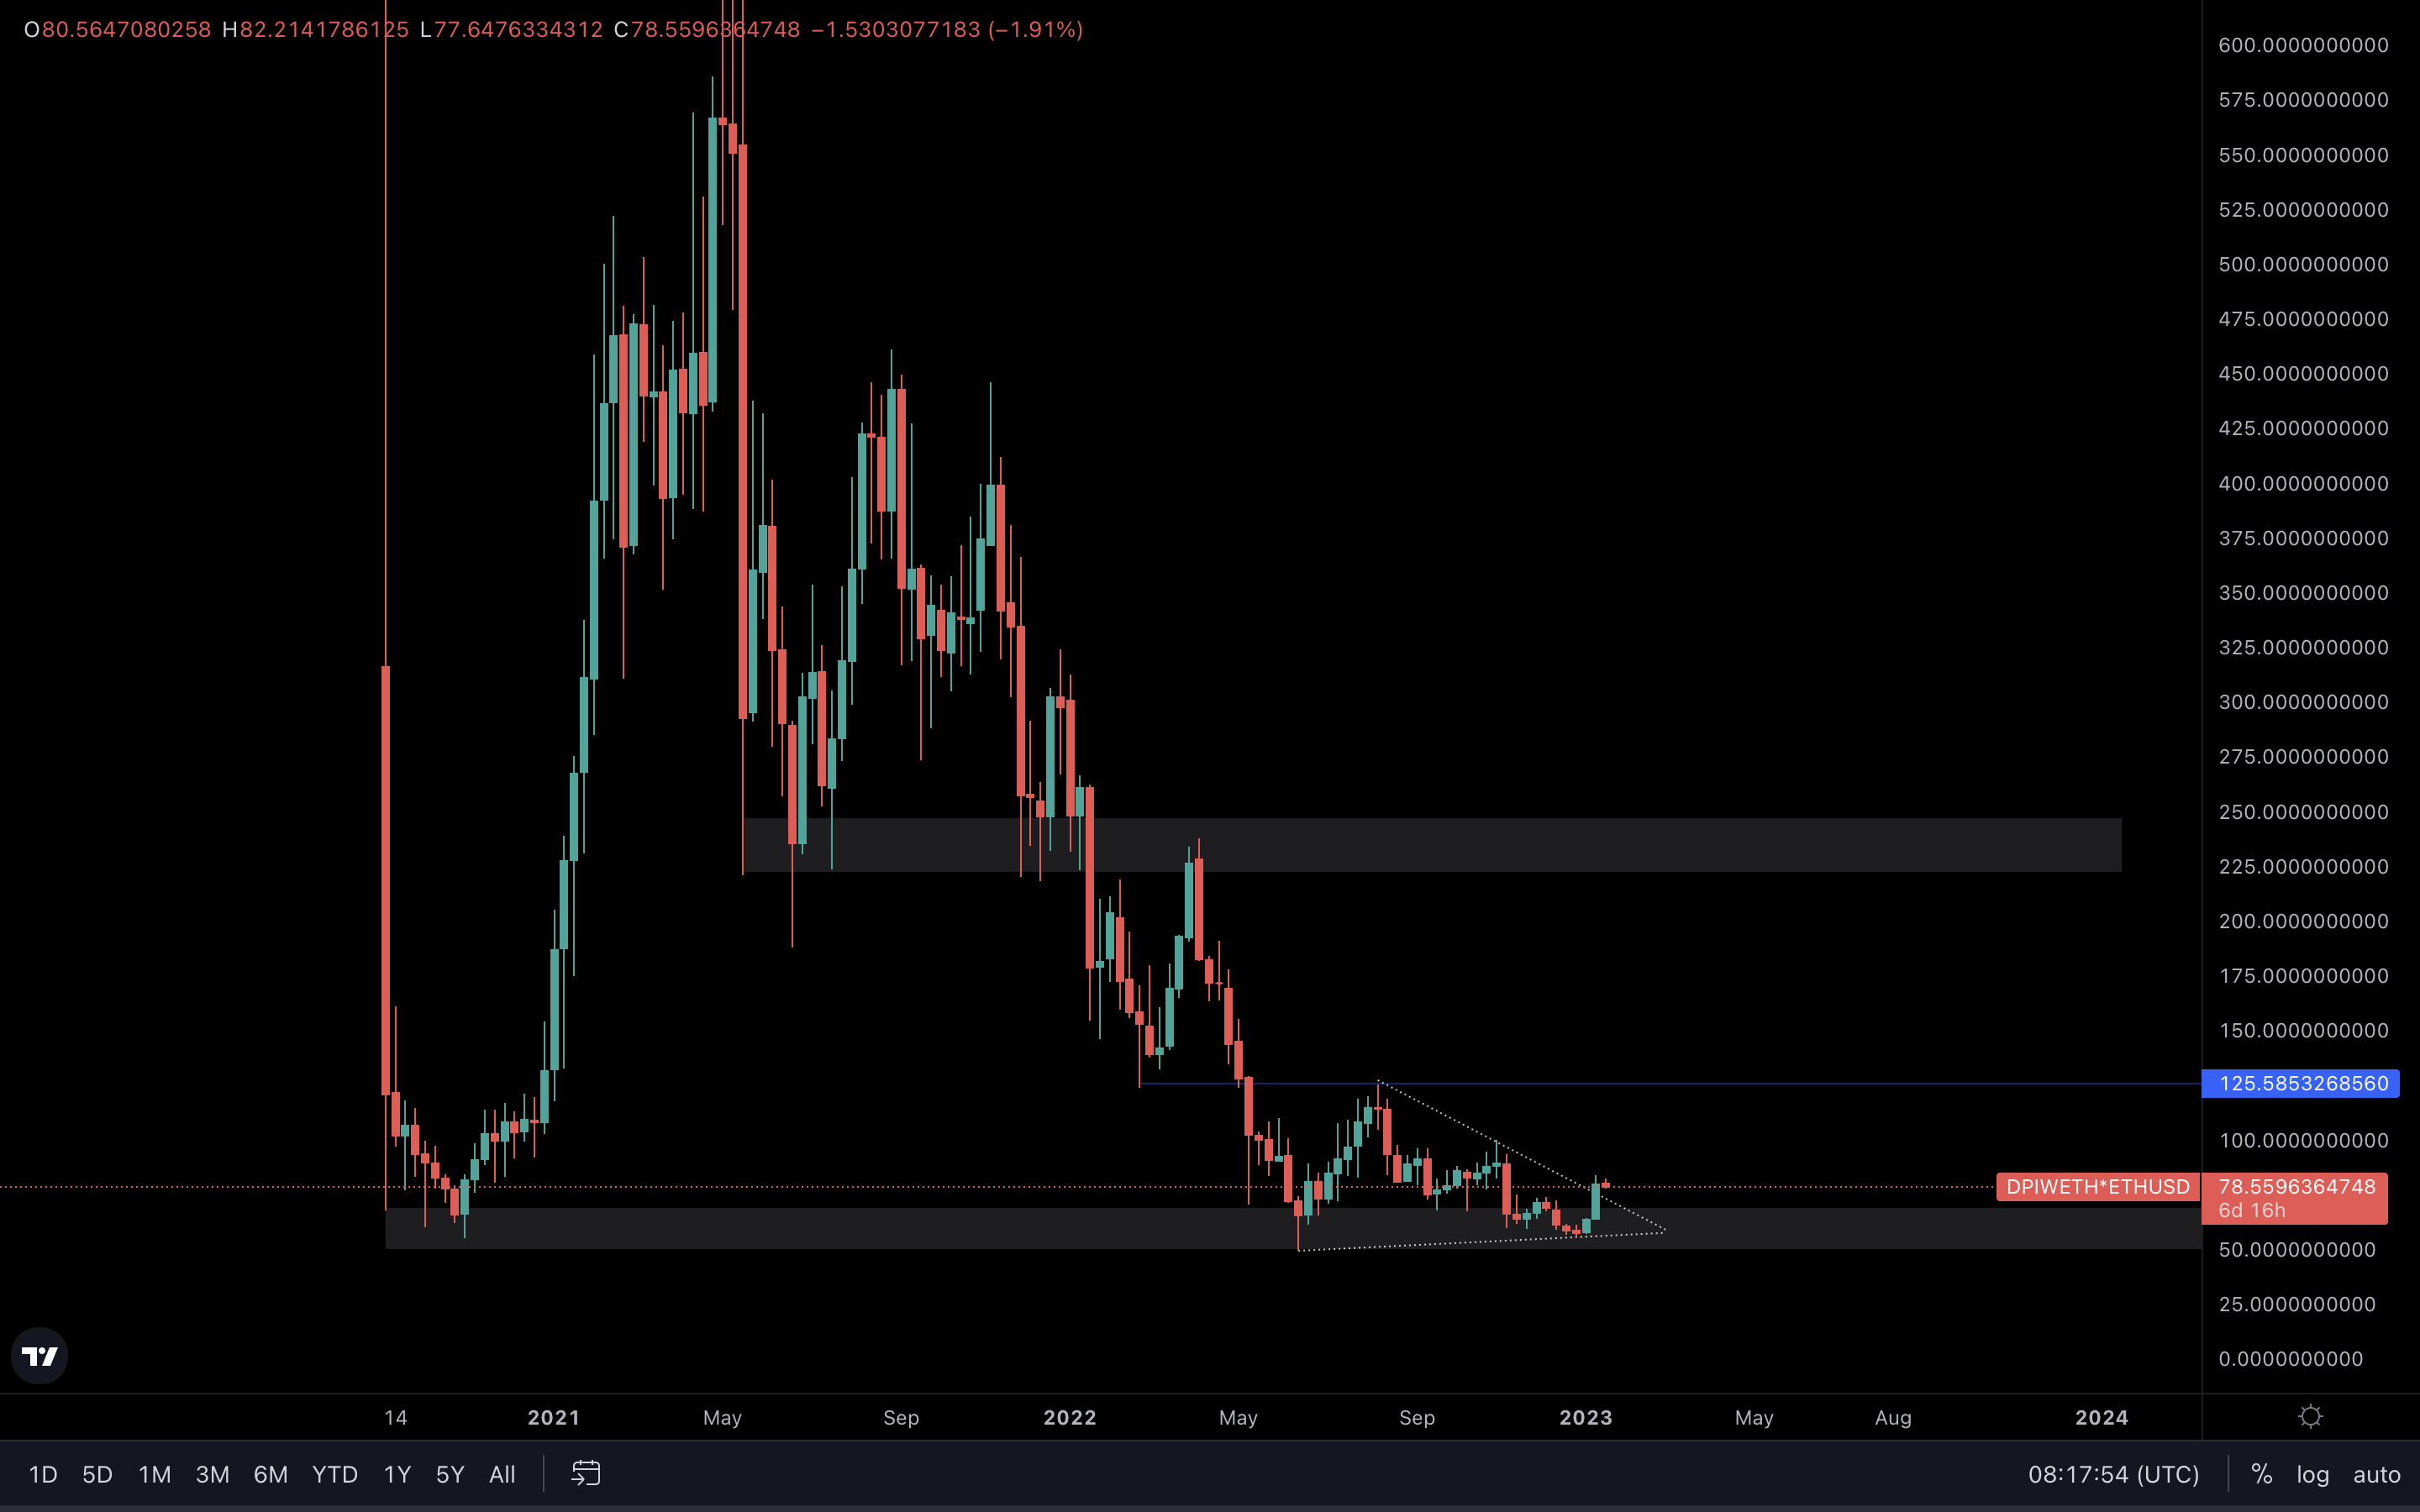
Clear breakout - the DPI is heading to $125 which suggests DeFi will perform well in the short term.
BTC | Bitcoin
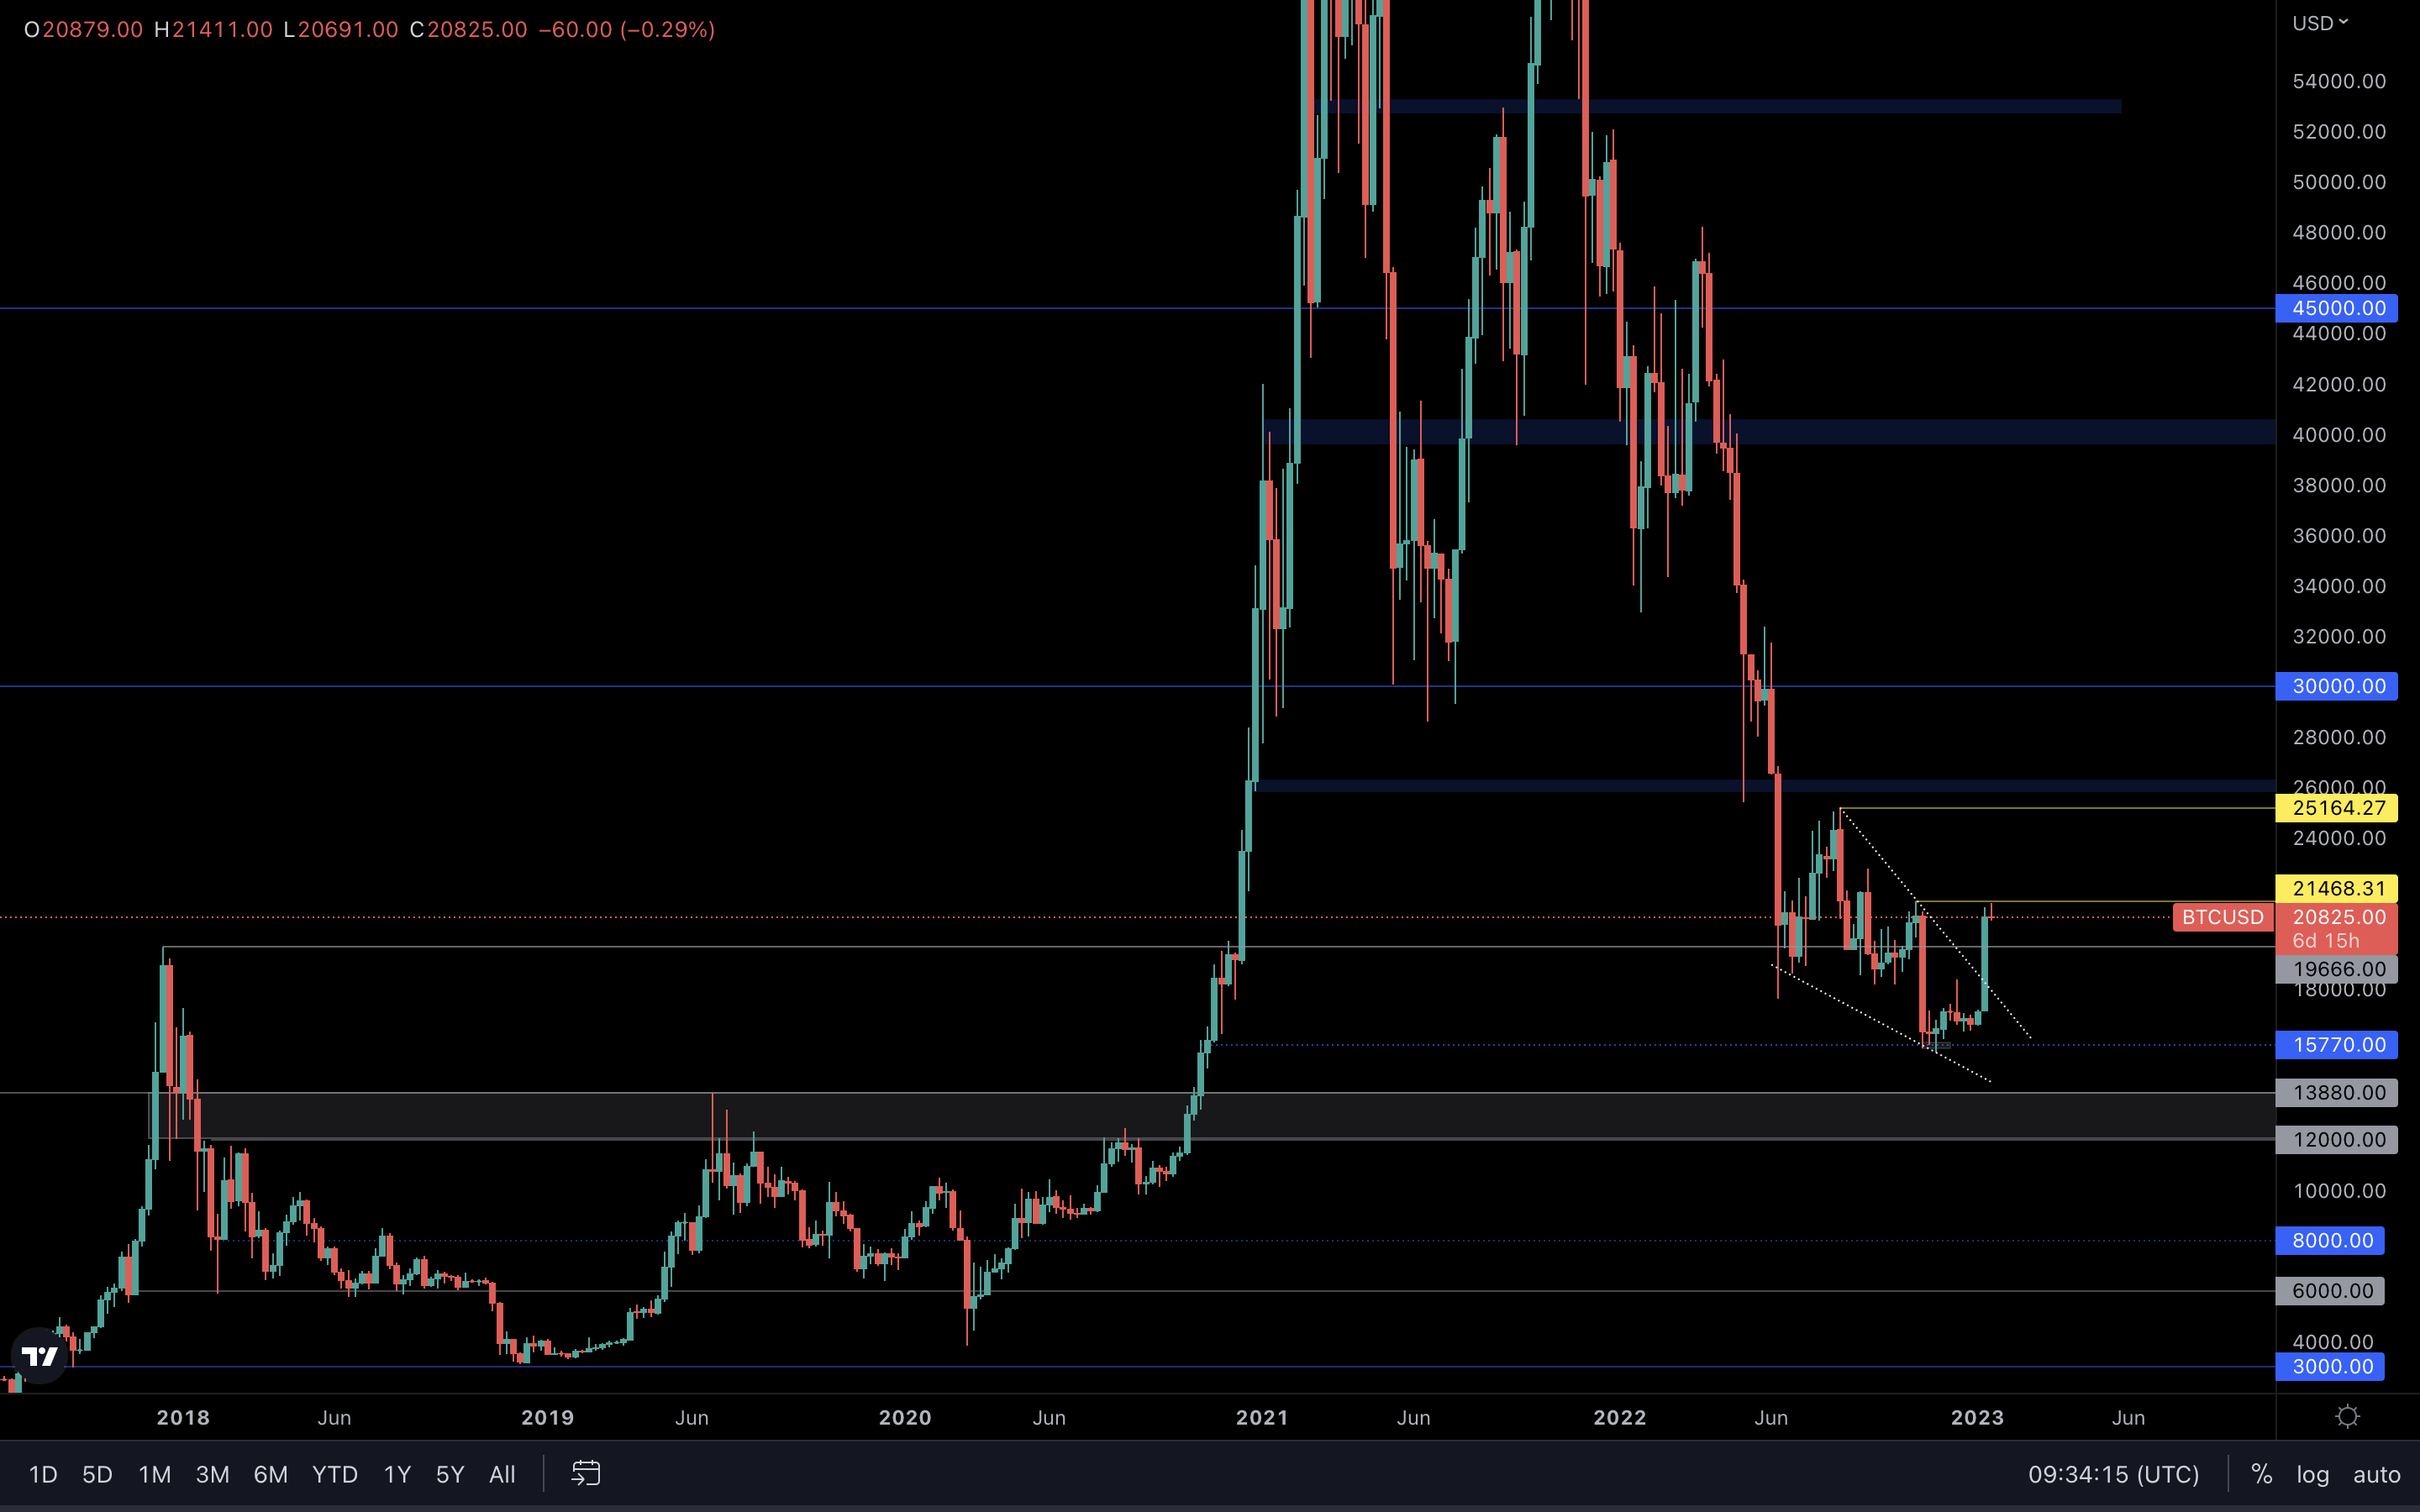
If you haven’t seen falling wedges in play before, here’s something you need to know: After a breakout occurs, the previous highs inside the wedge become targets on the way up. This means that we have our first target sitting at ~$21.5k, which Bitcoin has already tested. A reclaim of this level is necessary to resume upside to our second target for the wedge, which is sitting at ~$25k.
ETH | Ethereum
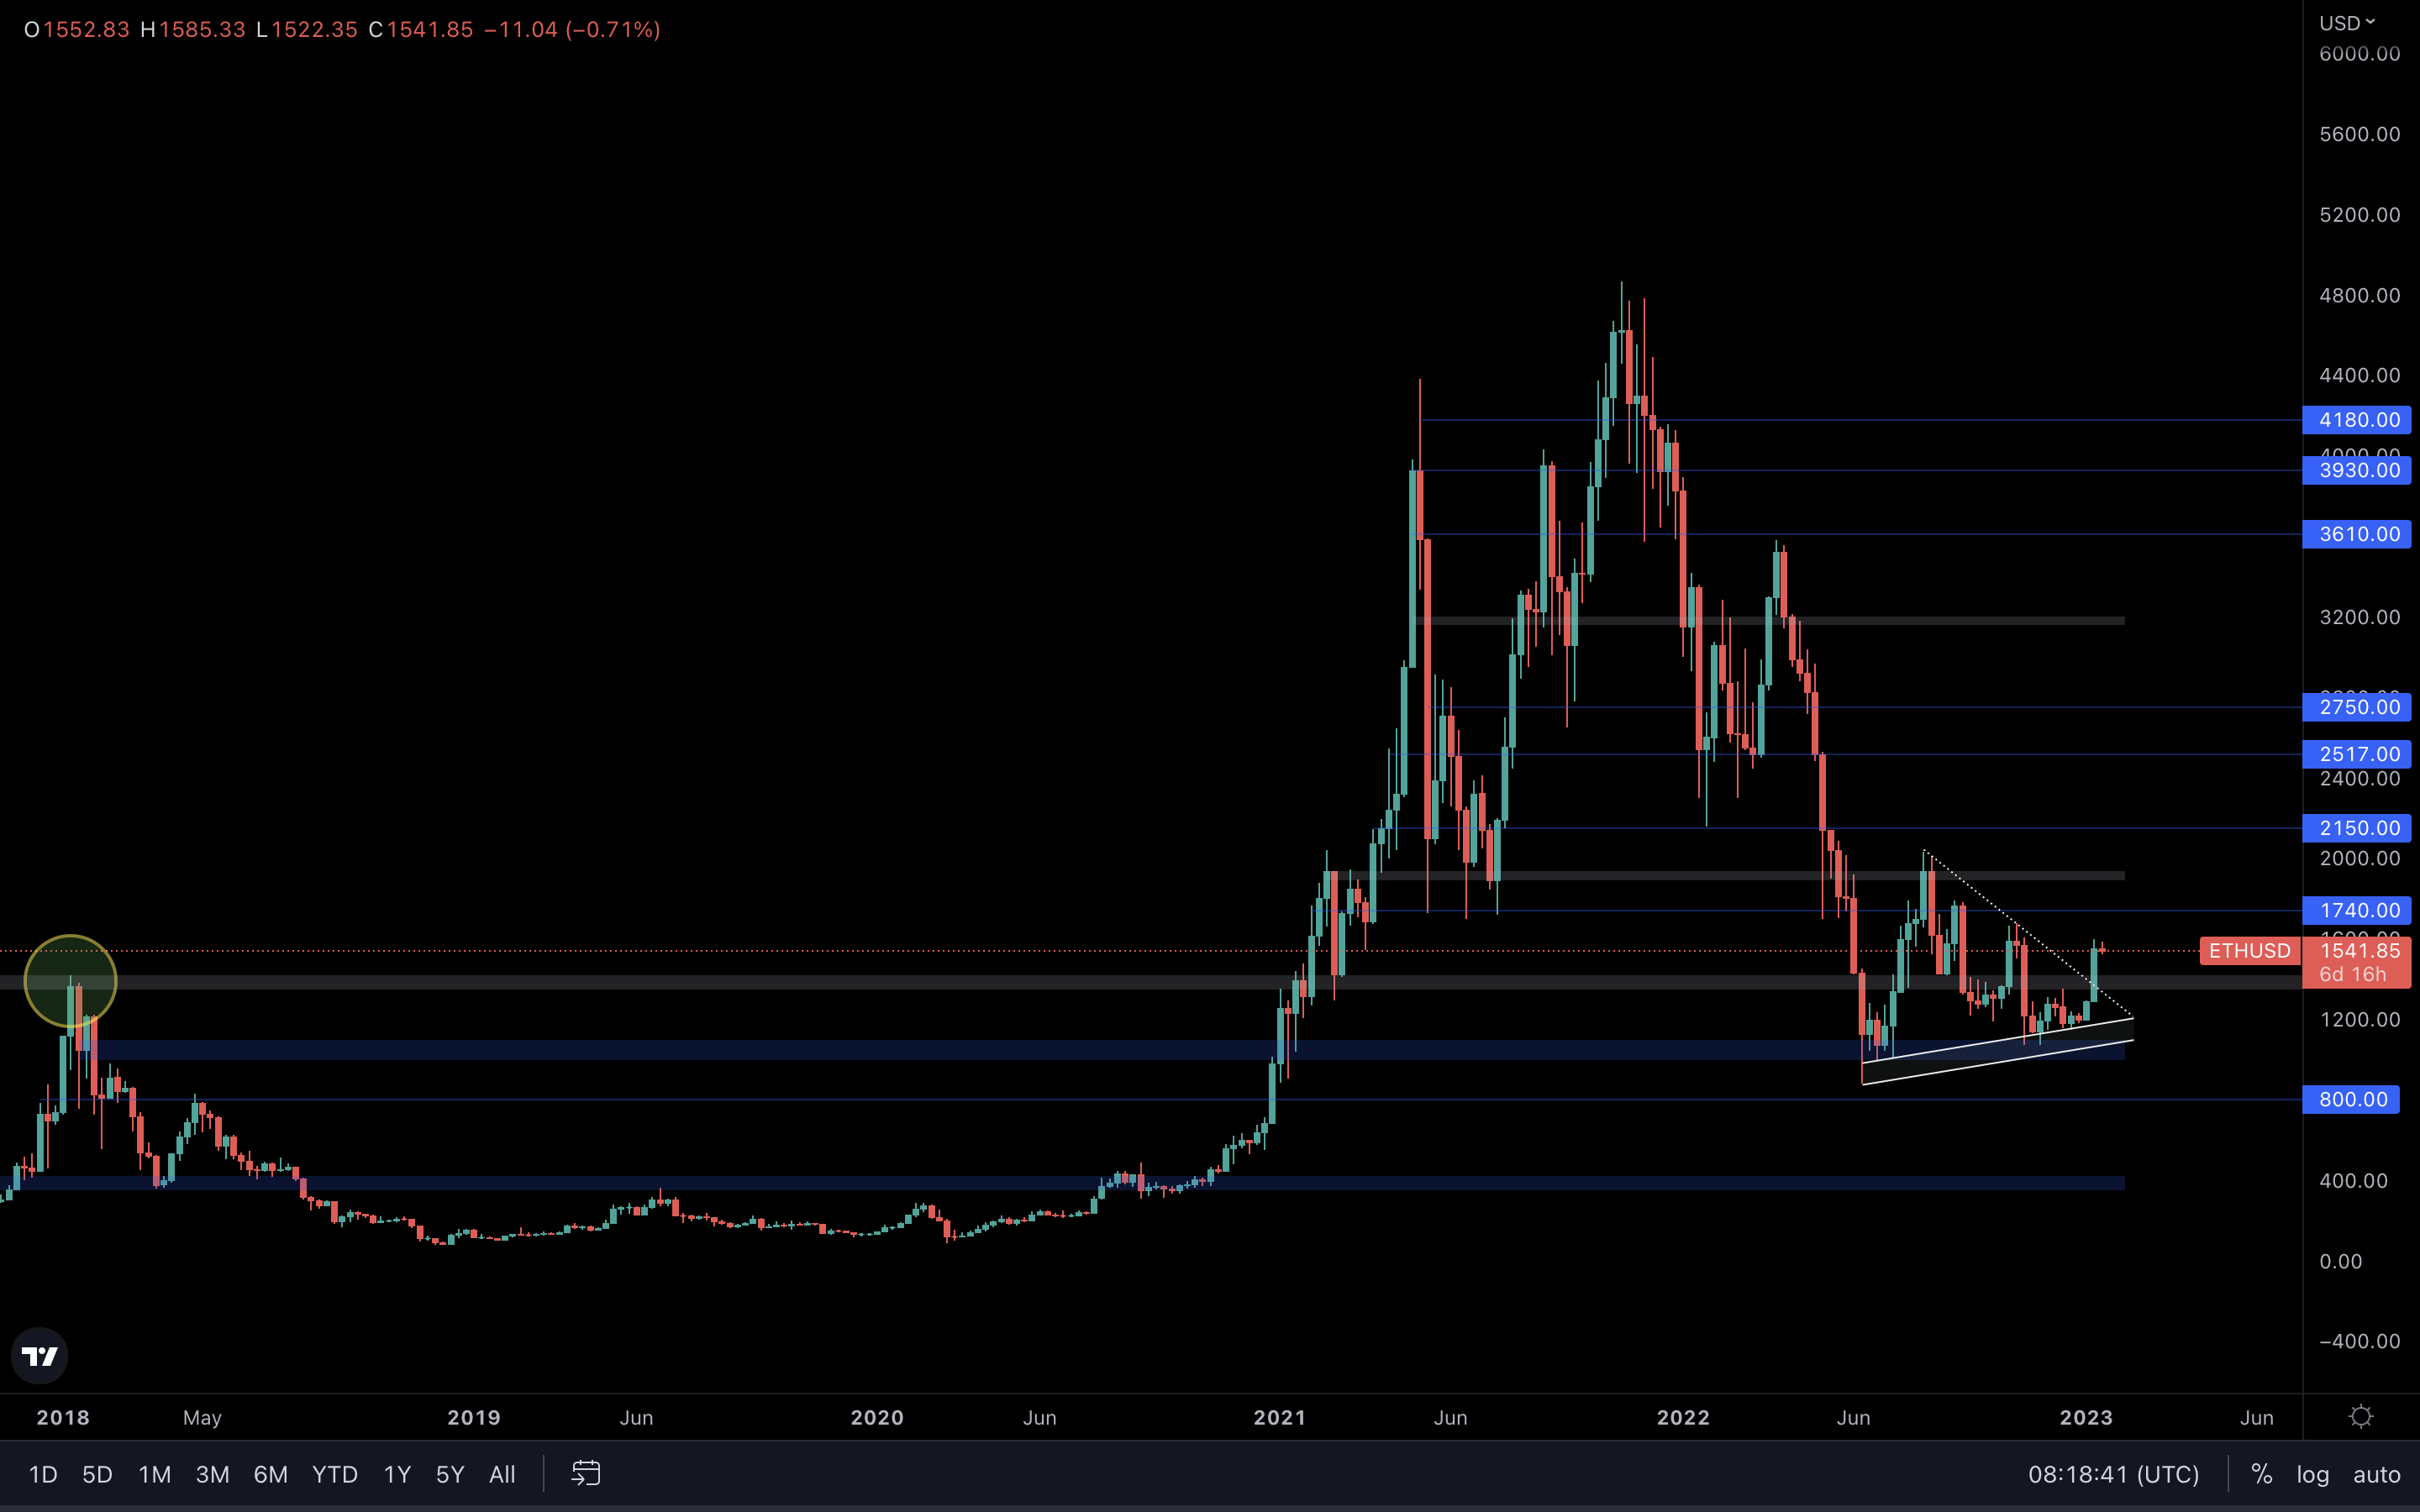
We’re finally seeing Ether breaking out from the symmetrical triangle we’ve been tracking for weeks. This breakout also came with a reclaim of the 2017 all-time high (left side of the chart). This means the level now acts as support, and Ether must stay above it to prevent further downside. Although we’ve chosen our targets based on previous highs inside the pattern, we’re not going to do that here. Instead, we’re looking at $1740 and $1900 as the next price targets for Ether because these two levels have been more consistent on higher timeframes. As long as we stay above $1420 (2017 all-time high), Ether will head toward $1740 next. If buyers manage to keep up even then, a move to $1900 will follow shortly after.
SOL | Solana
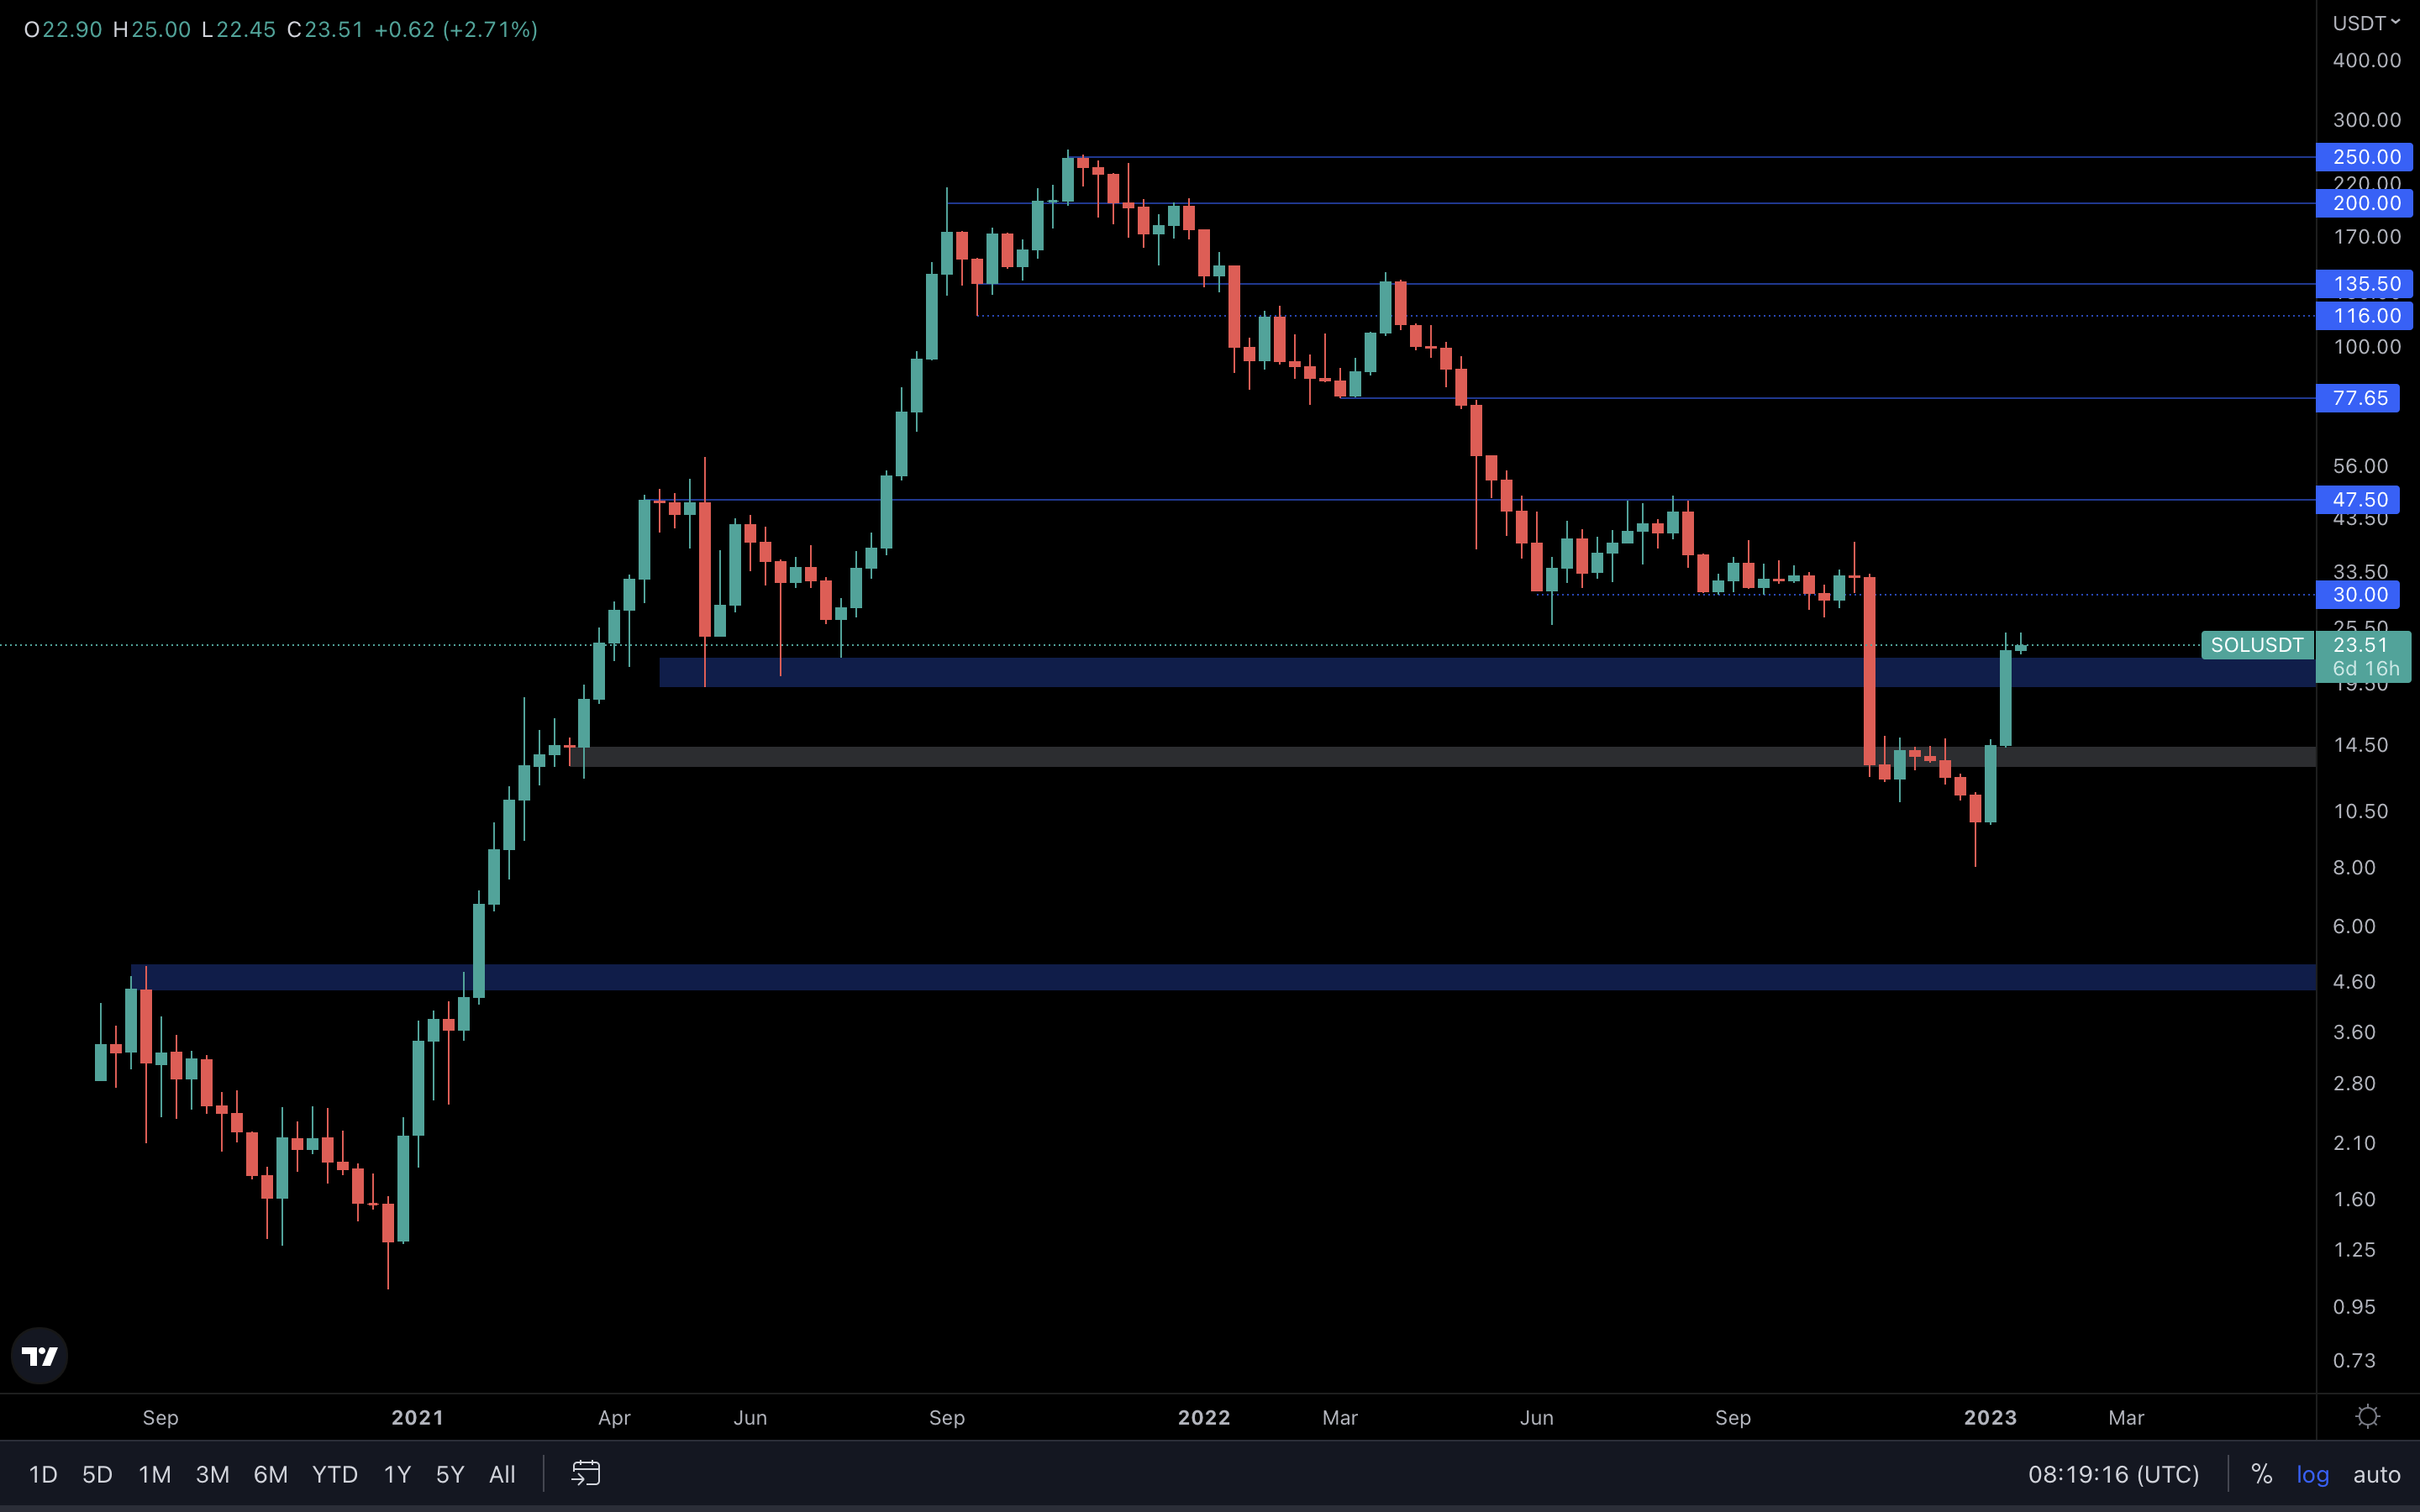
SOL managed to reclaim the $19 - $22 weekly support by closing a candle above it, which means we’ll now need to see a loss of $19 to confirm further downside. What’s coming next is quite simple to understand. If we do not see a weekly closure under $19, SOL could rise to $30 next.
RUNE | THORChain
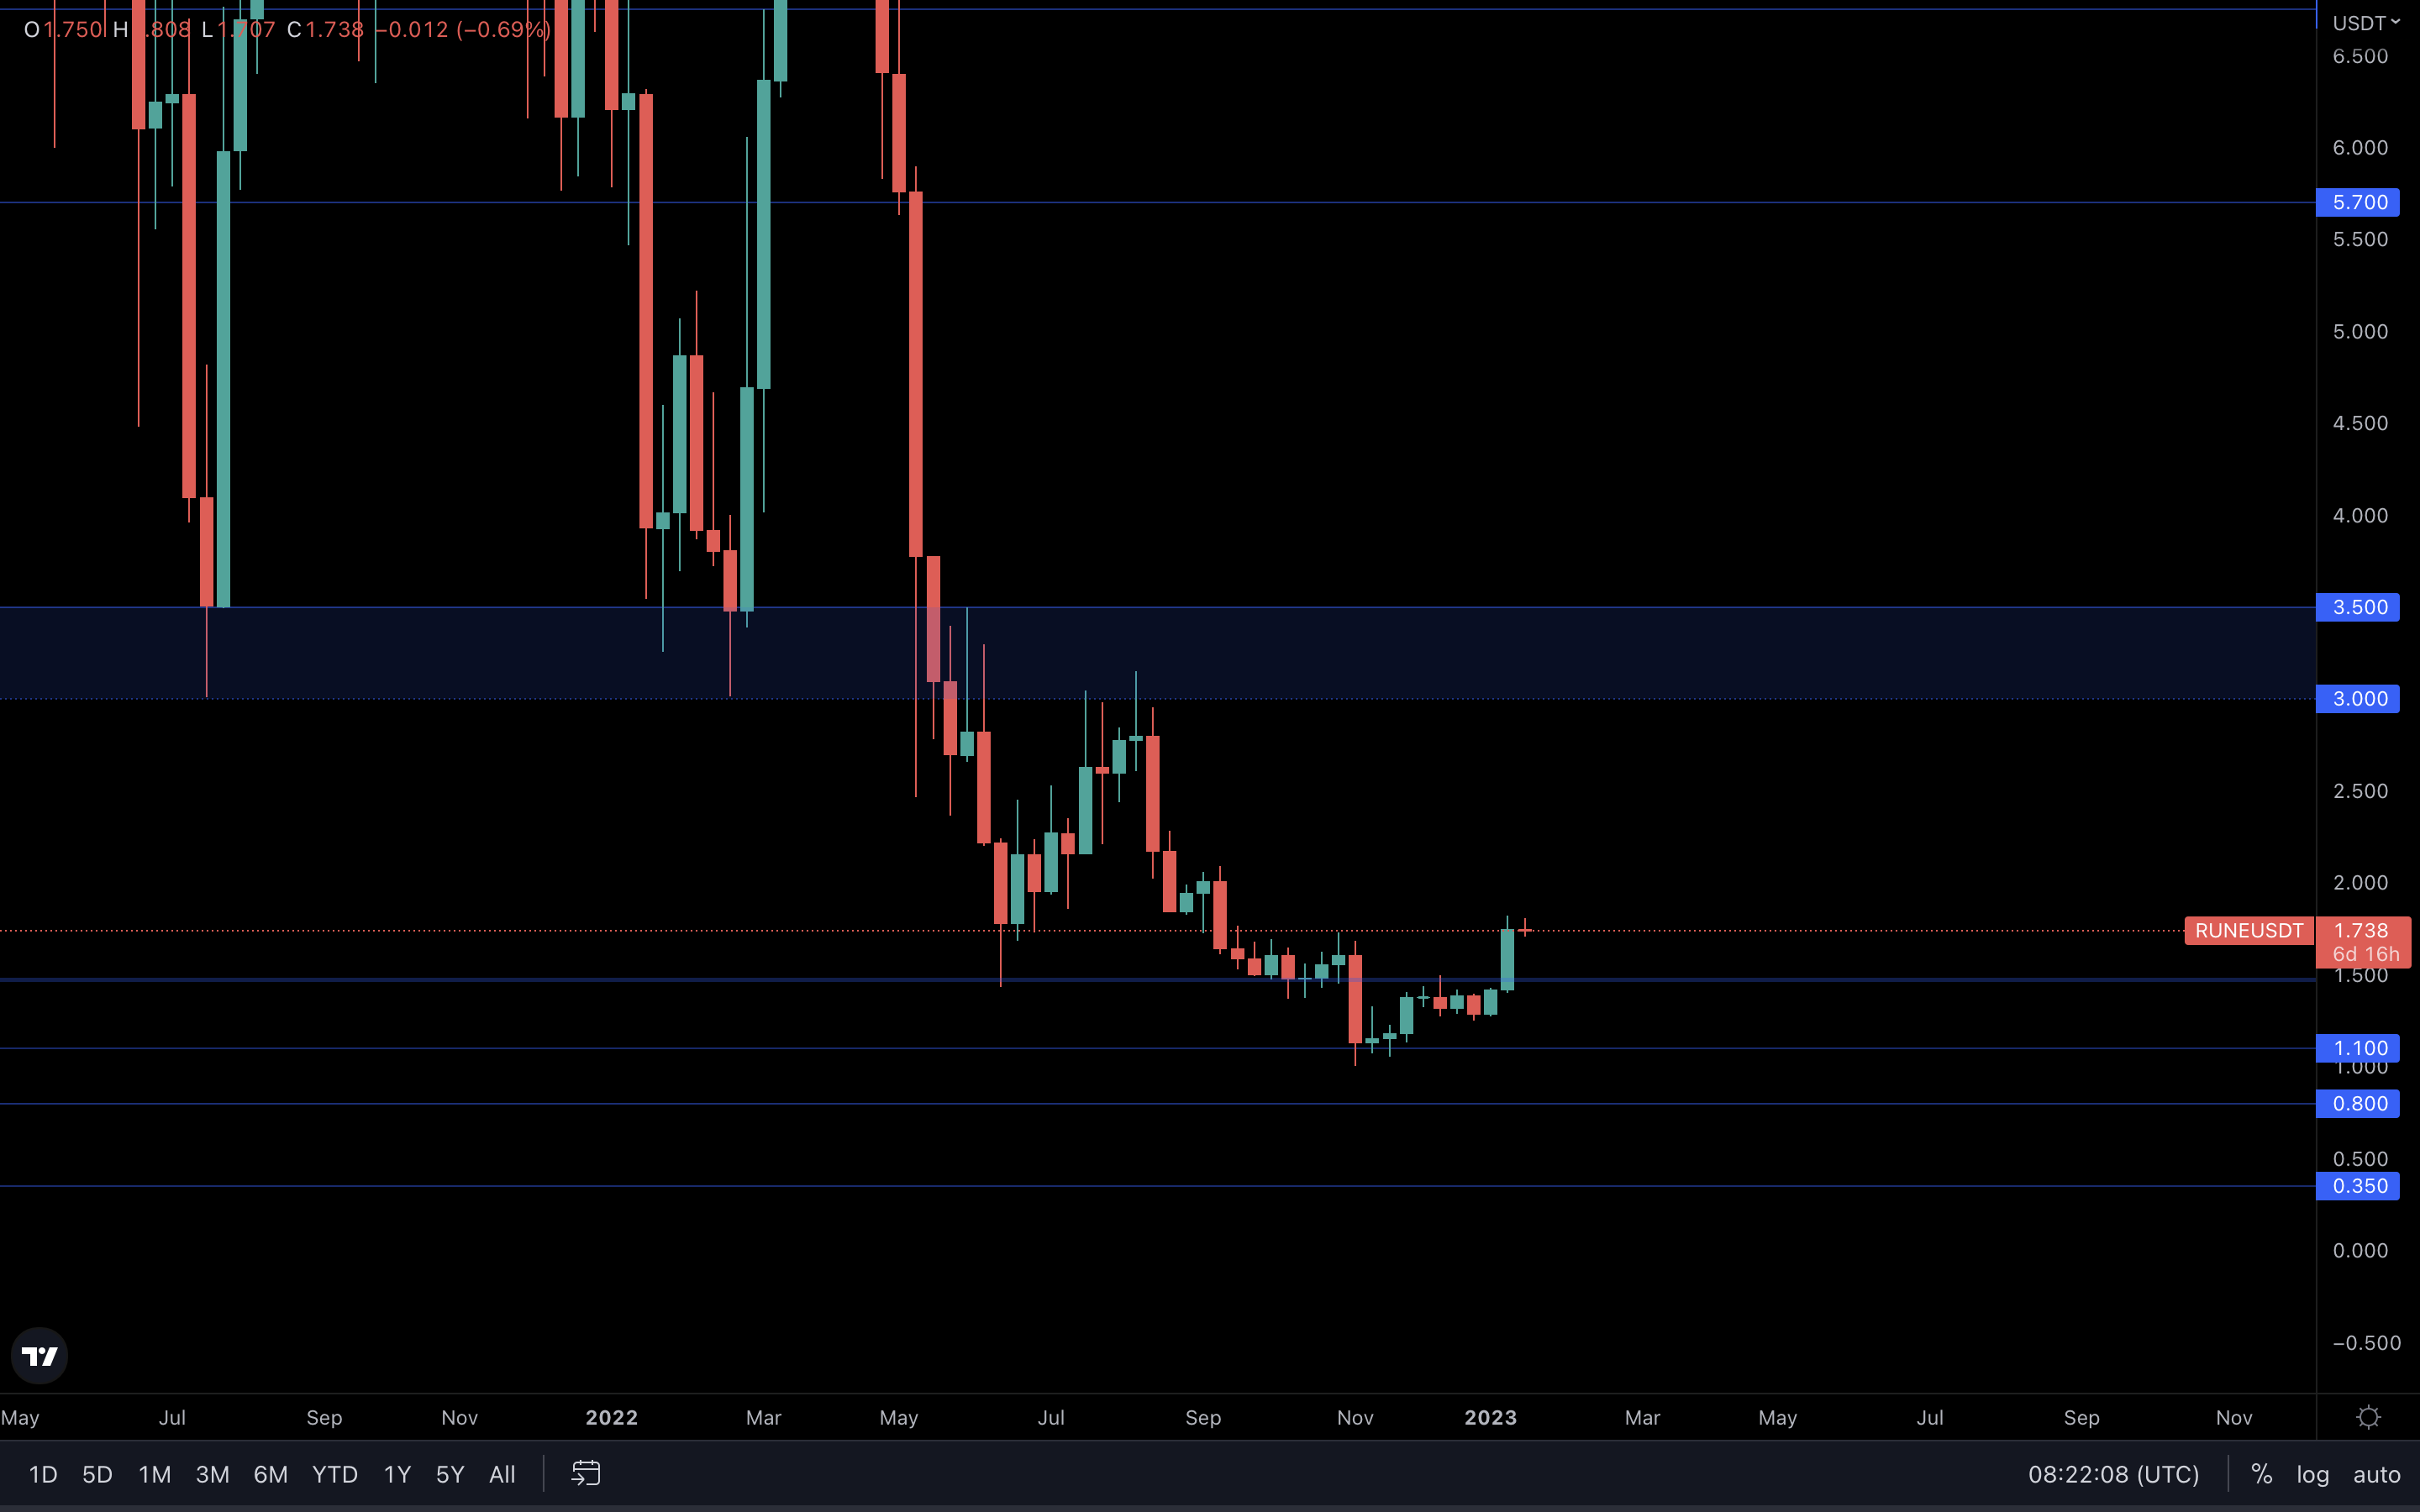
RUNE has reclaimed $1.50 on the weekly timeframe, so only a loss of that level will confirm significant downside. There’s no significant resistance between $1.50 and $3 on the weekly timeframe, so if the market continues to rally, we might see RUNE at $3 in the coming weeks.
SNX | Synthetix
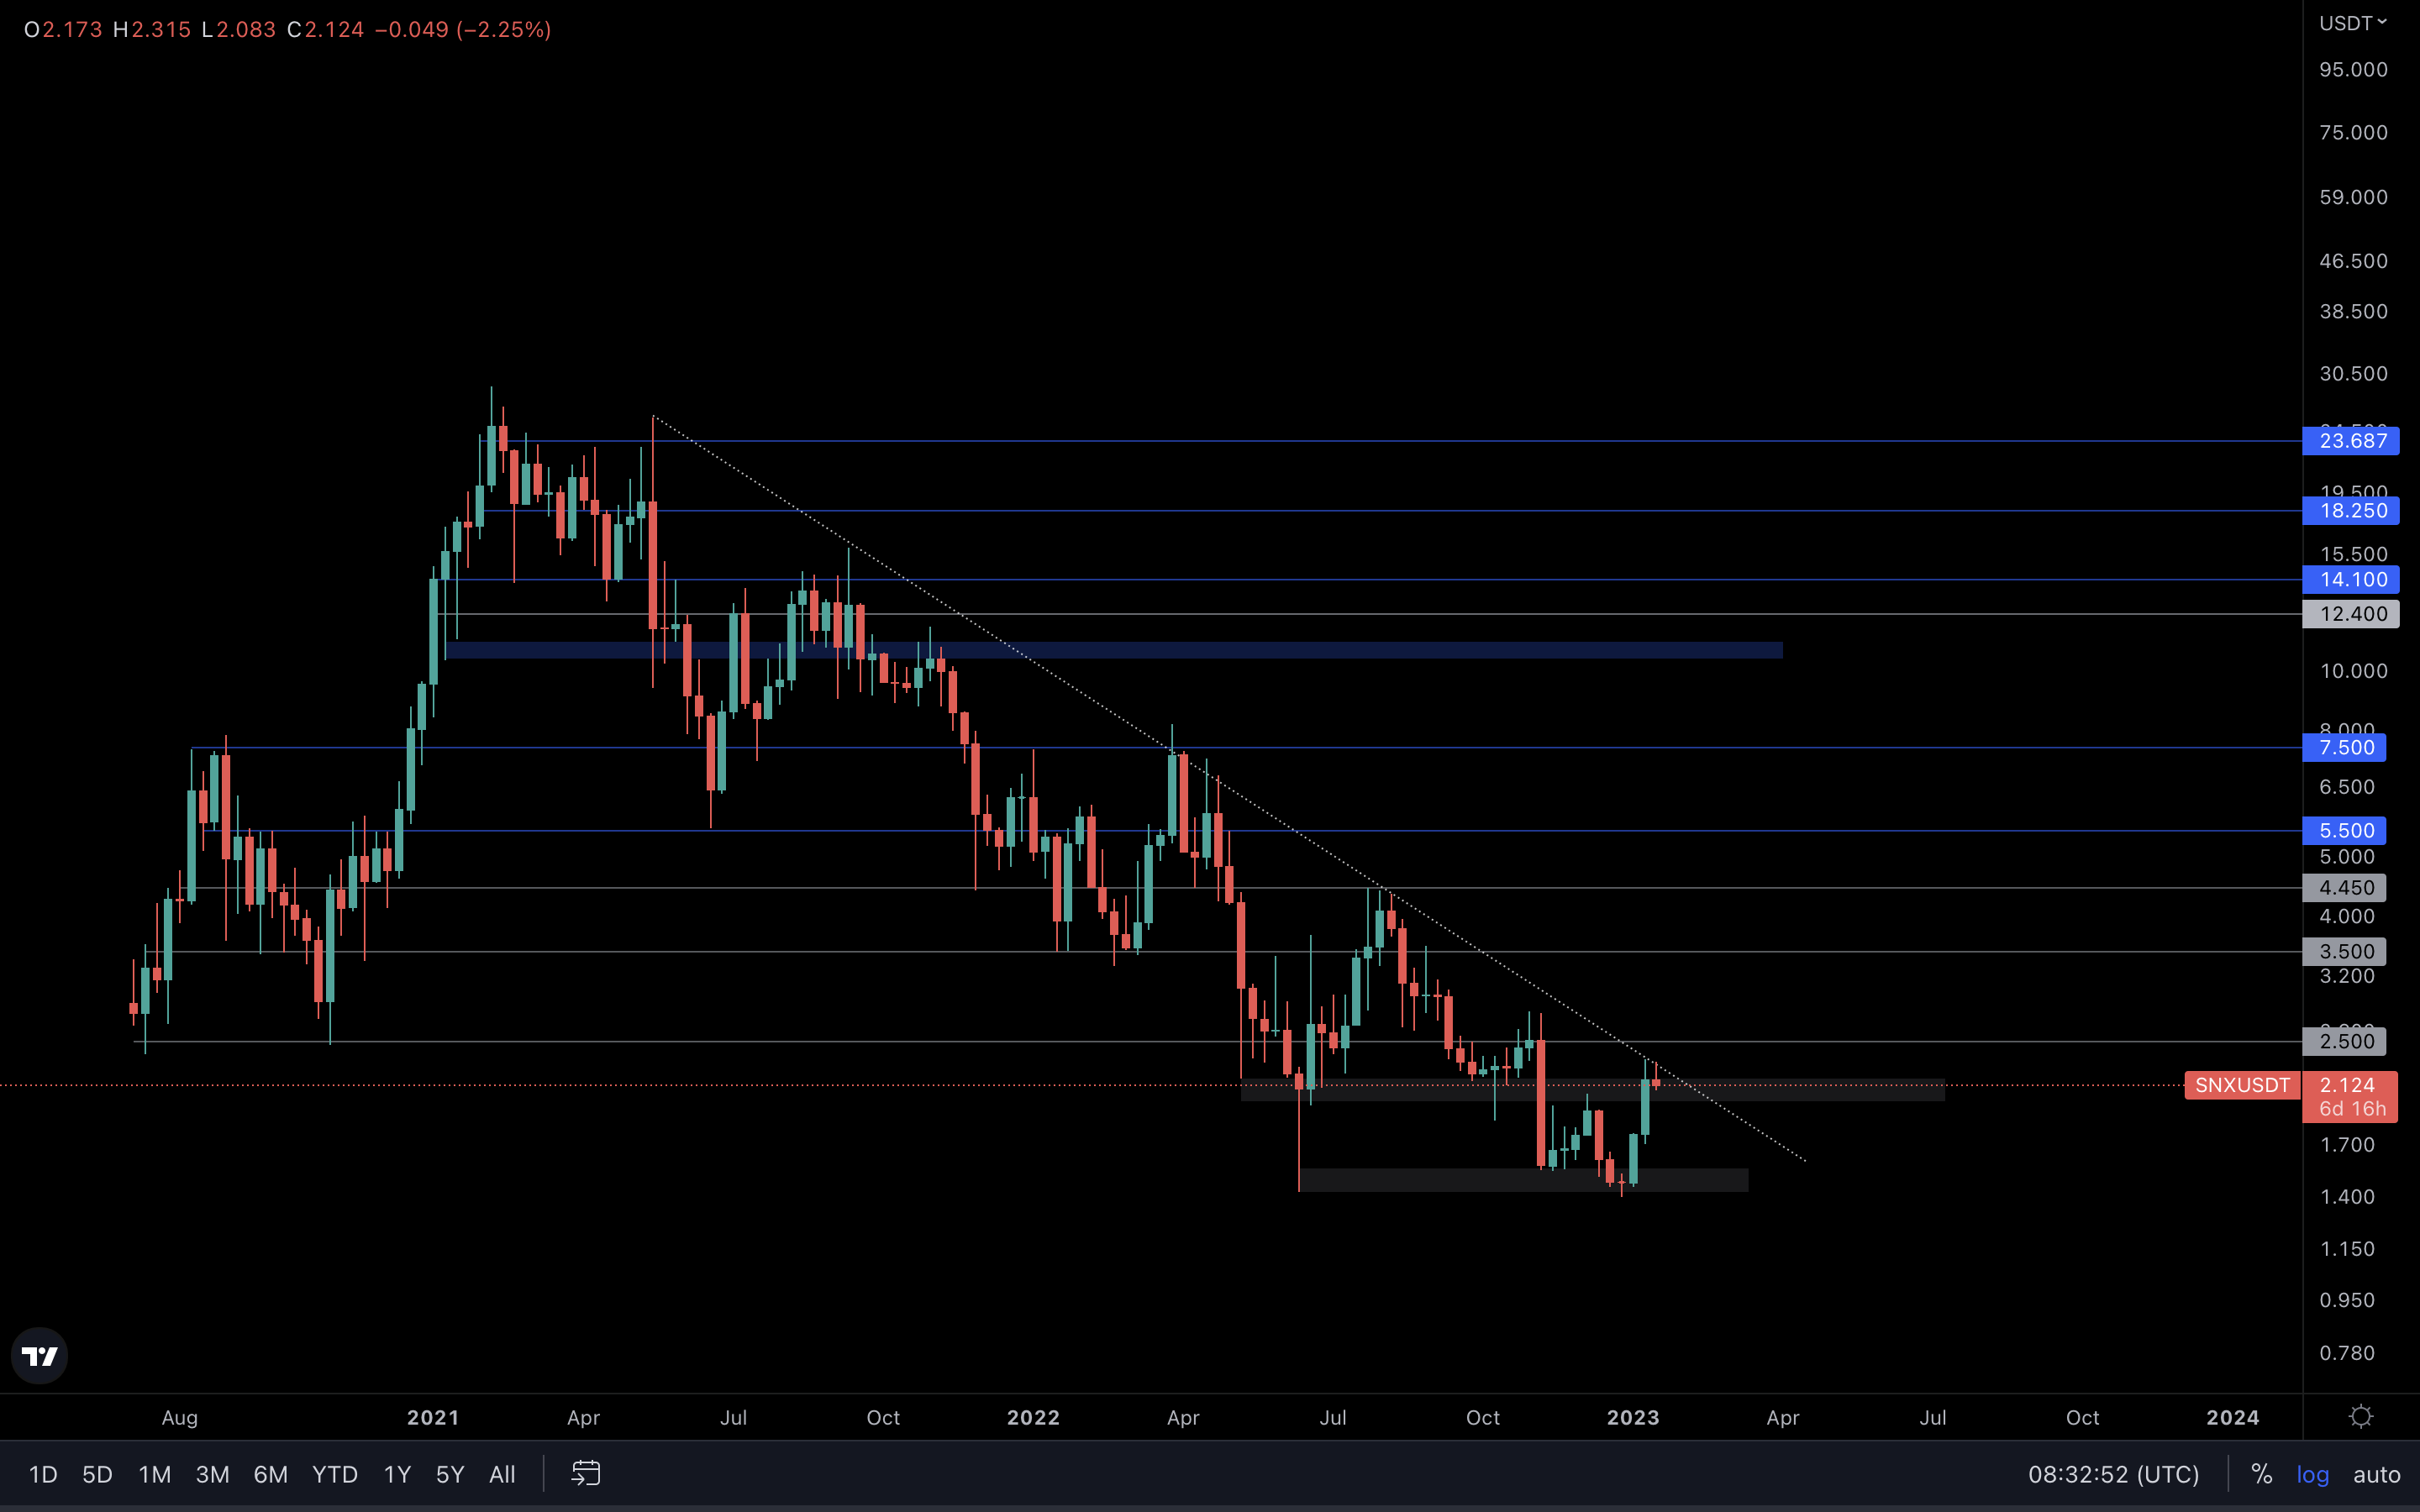
What you can see on this chart is a 609-day-old resistance. If the number didn’t give you goosebumps, let me tell you - it should.
After over 600 days of trading under this diagonal resistance trend line, and after multiple accurate rejections to confirm it as resistance, SNX retested the trend line again last week. Keep in mind that the more the trend line is tested, the closer we are to a breakout.
If SNX breaks above the trend line, this could be one of the most interesting charts you’ll be seeing for some time. For us to have confirmation, we’ll need to see a weekly reclaim of $2.50, after which SNX will slowly grind toward $3.5, $4.45, $5.50, $7.50 and hopefully even higher in the long run.
Great R/R for those who would want to take this on. We will be monitoring this chart on a daily basis to see if any progress is made. NOT FINANCIAL ADVICE
Cryptonary's Watchlist
DOT | Polkadot
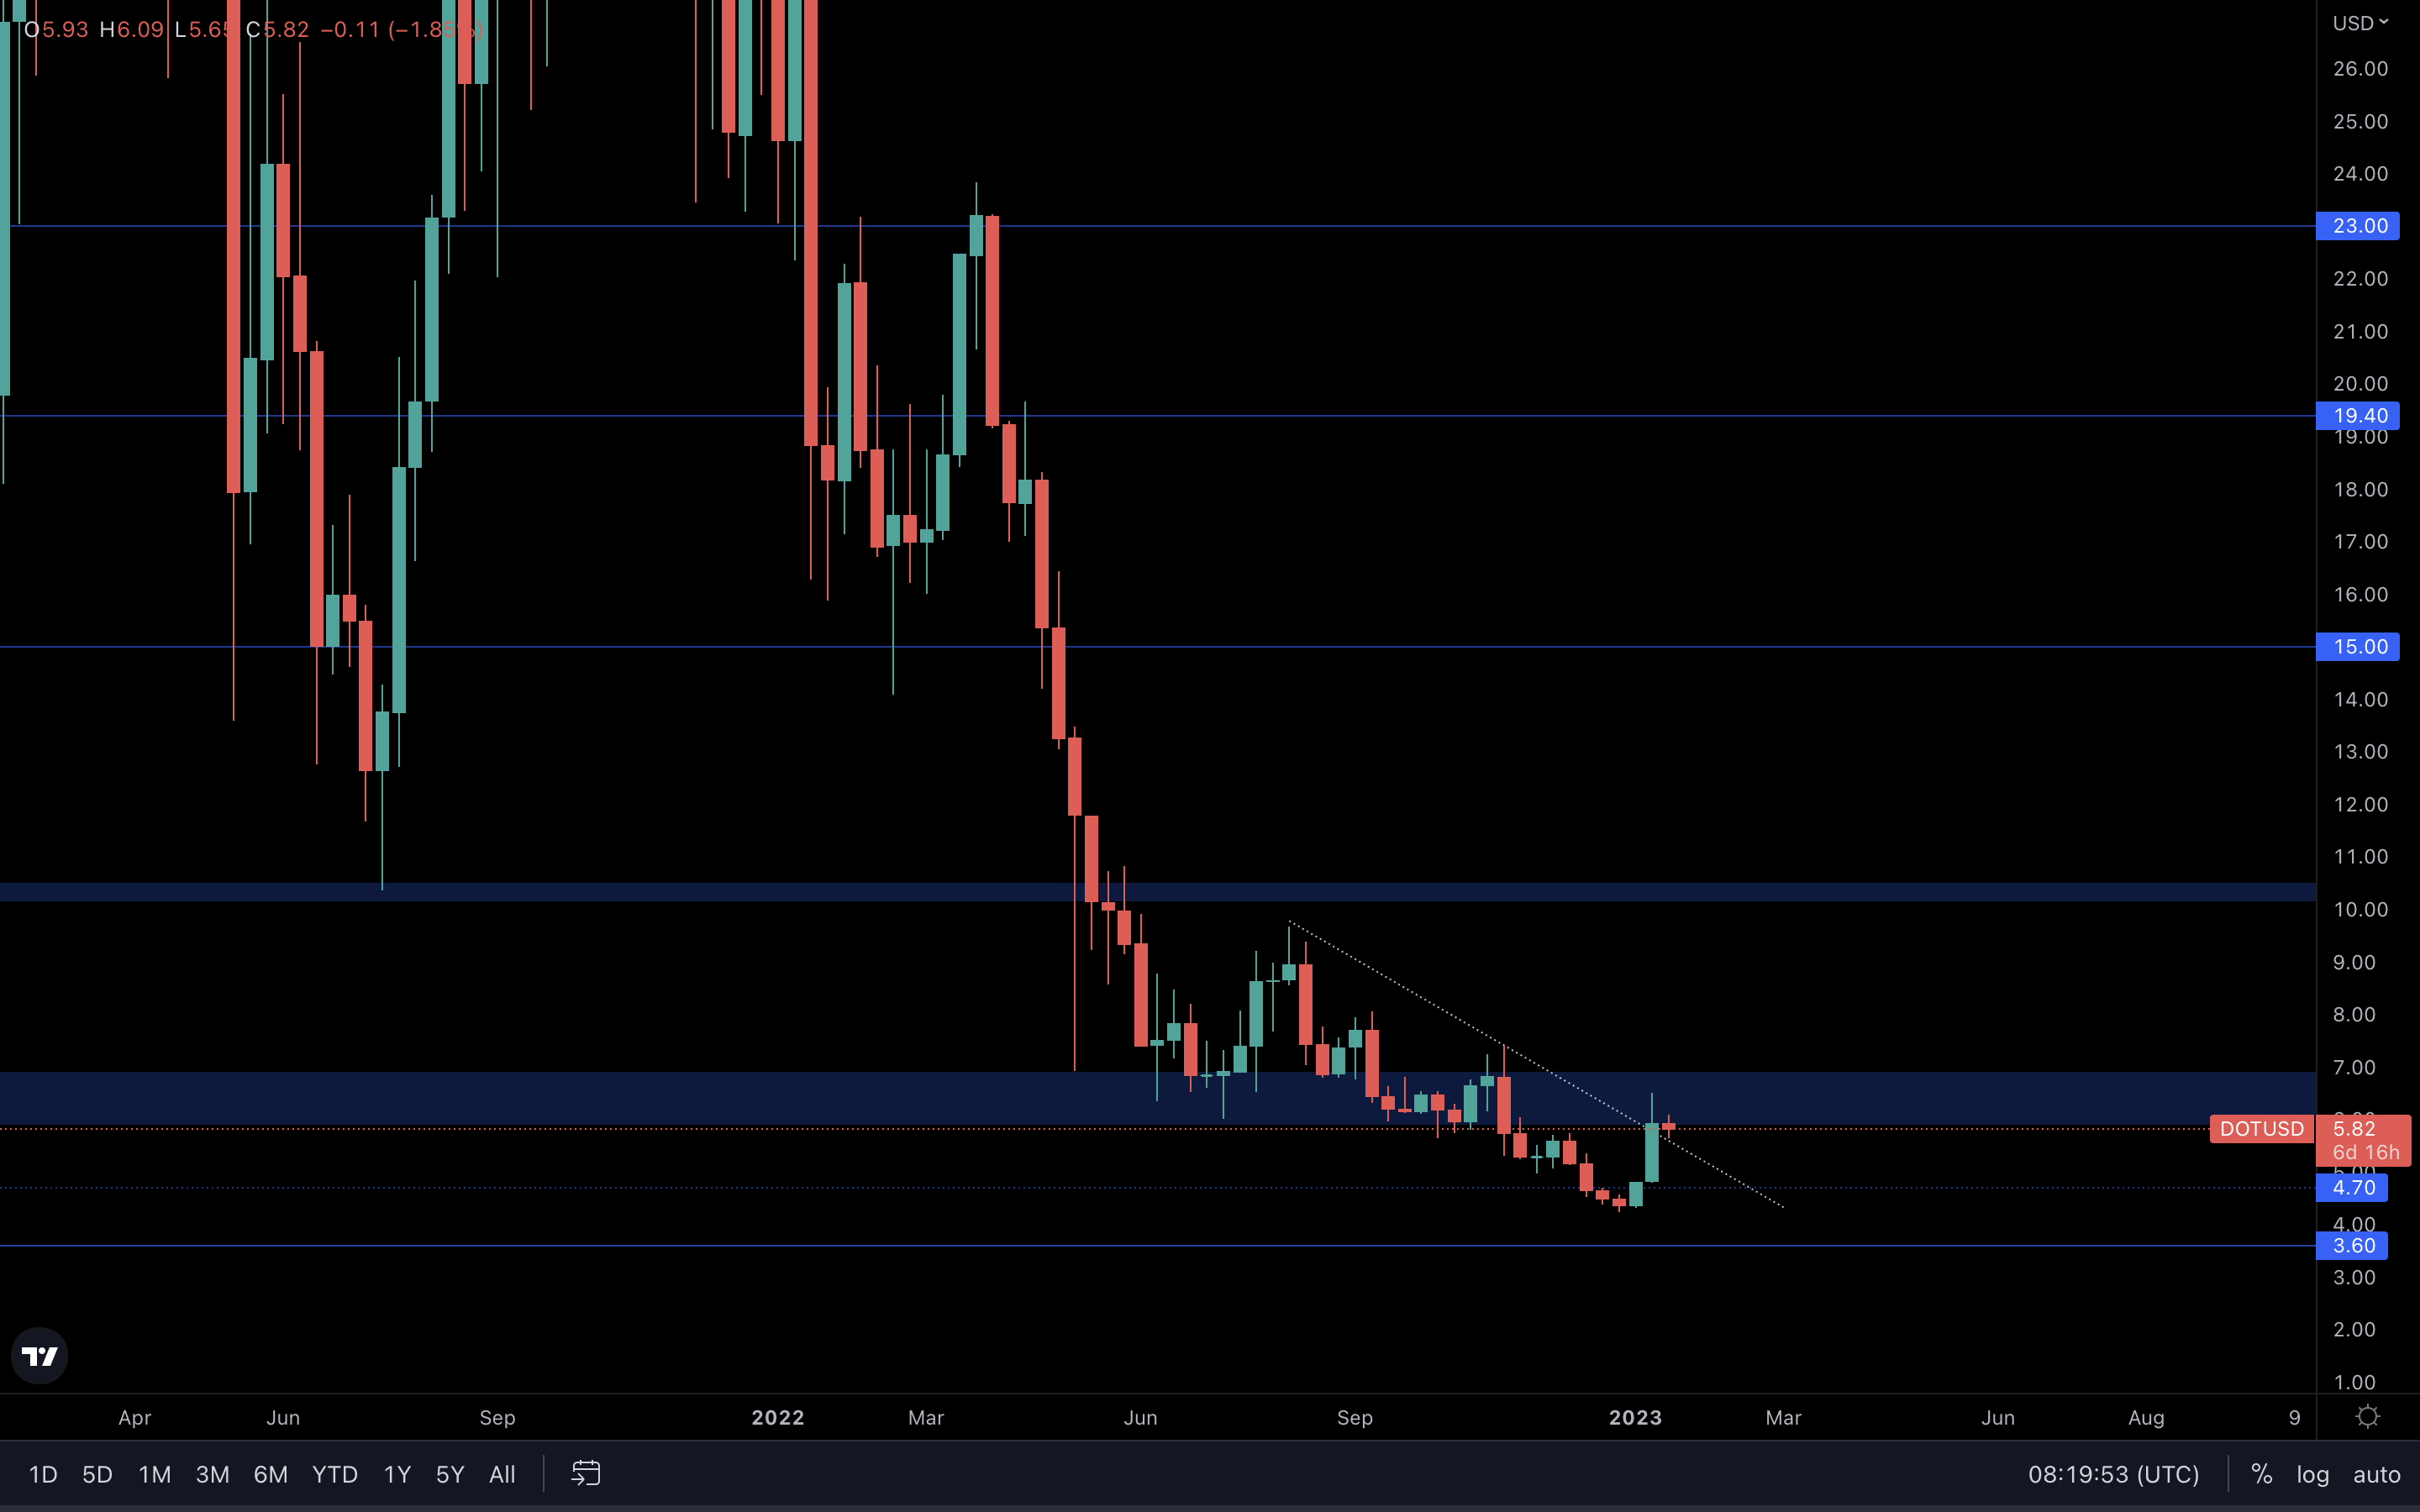
Another week, another breakout. If only it were like this all the time…
DOT has broken above this local diagonal resistance trend line on the weekly timeframe. However, it is still at resistance if it continues to trade inside the $7 - $6 region. We need to see a reclaim of $7, which, once confirmed, would pave the road for a $10 DOT.
SYN | Synapse
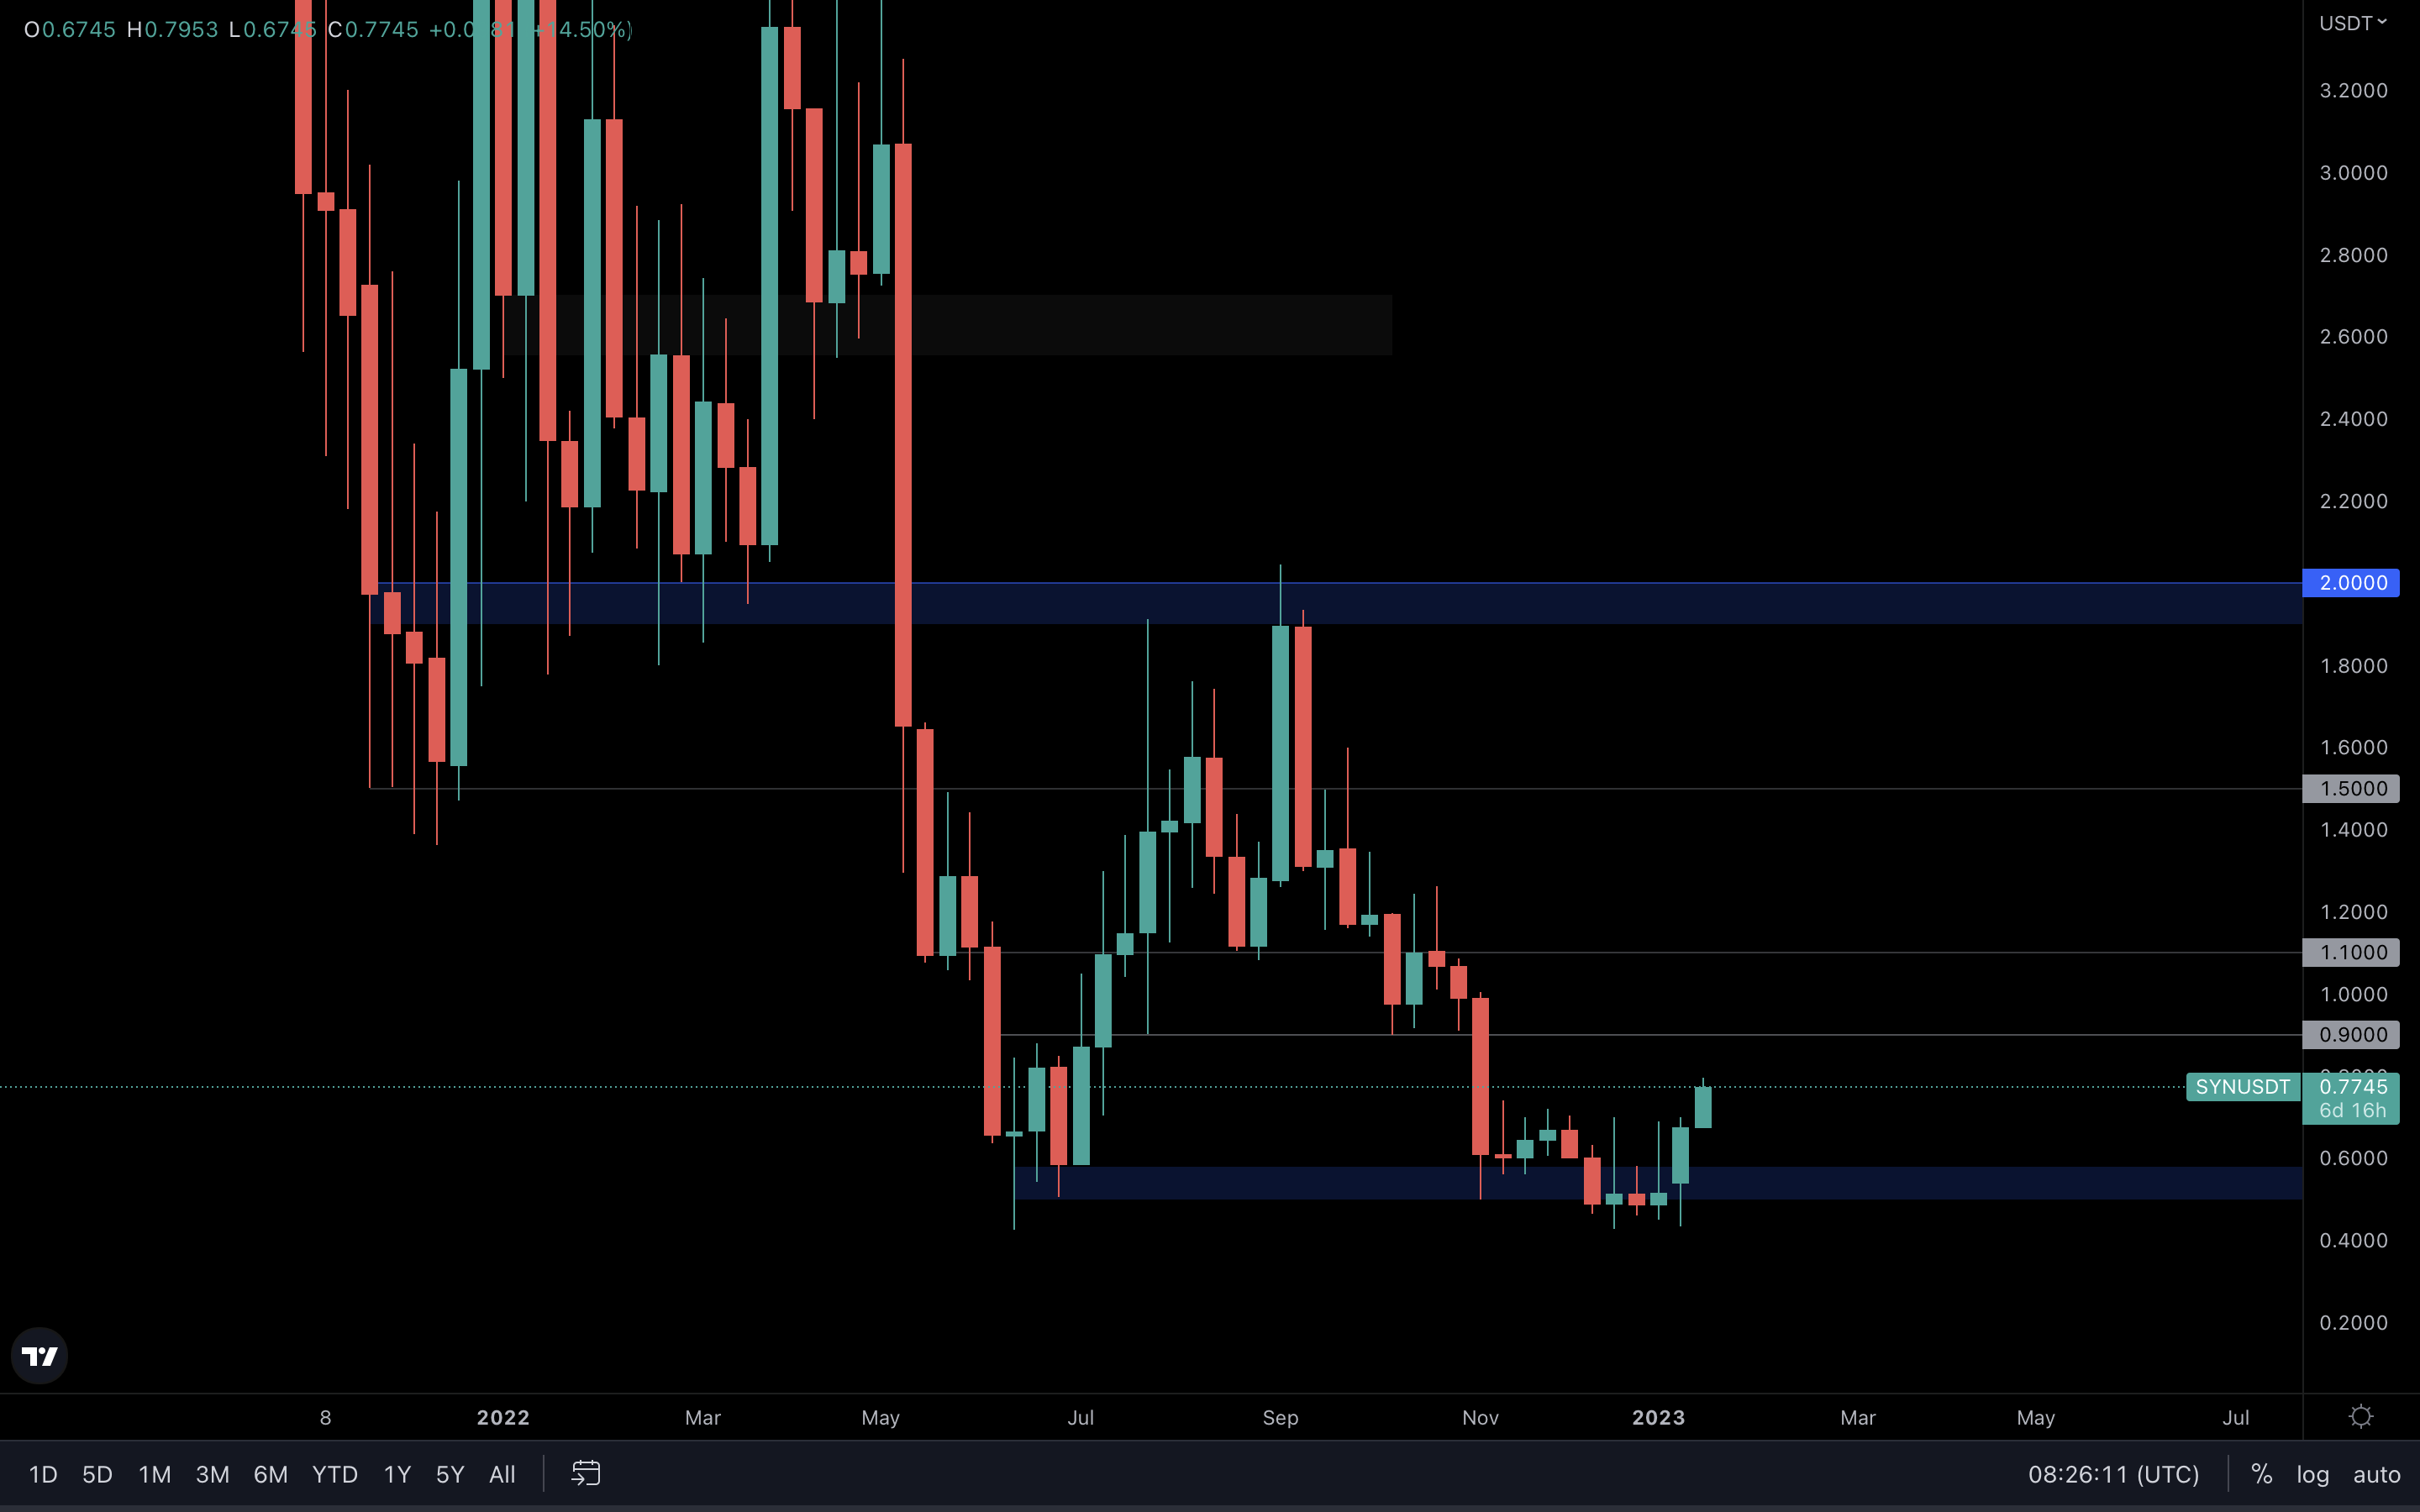
$0.60 has been reclaimed on the weekly timeframe, and as a result, SYN is already performing extremely well/ So it’s safe to assume the $0.90 resistance level will be tested shortly. If the market continues to rise, SYN should have no issues testing higher levels such as $1.10, $1.50 and even $2 at some point in Q1, especially since it’s one of the few that’s rising while the rest of the market is consolidating/going down. This shows that SYN has increased demand compared to other assets, making it a potential outperformer.
OP | Optimism
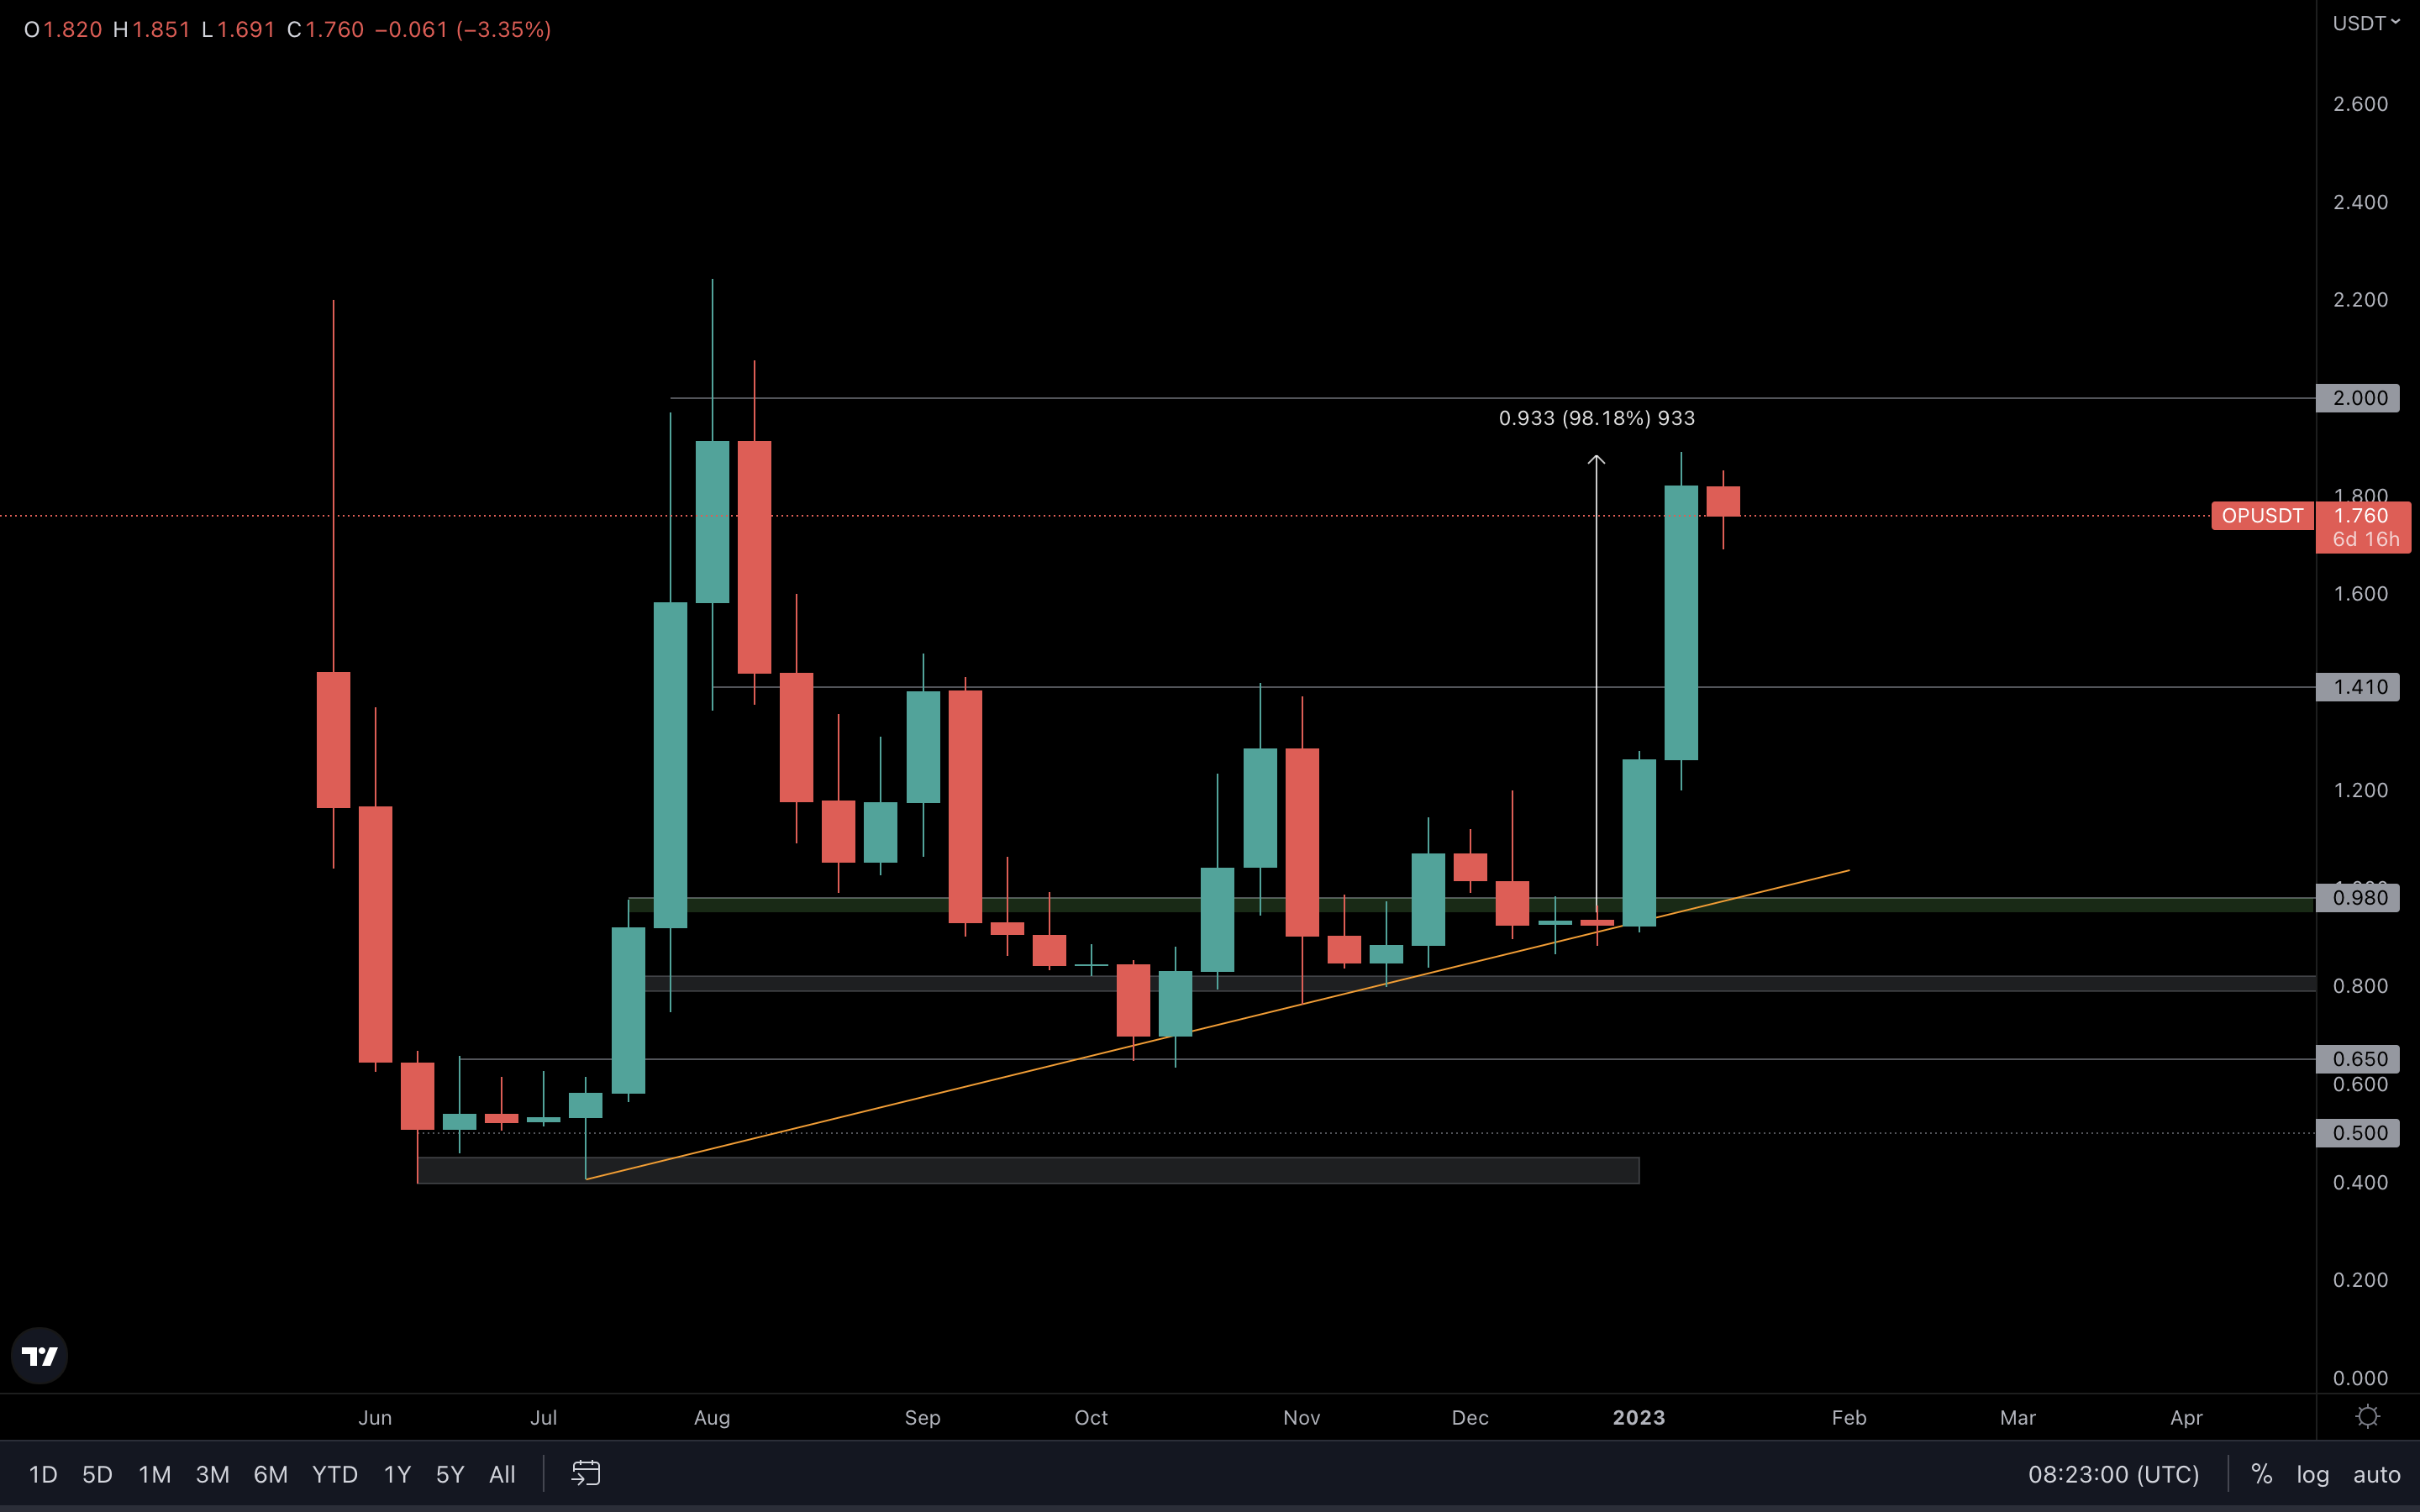
Beautiful performance. Congratulations to those who took our analysis as financial advice, even though we said it isn’t. You’re definitely doing well right now. There’s one thing we need to mention right from the start, and no, it doesn’t make us bears. OP has reclaimed $1.41 on the weekly timeframe, which means we’ll have to see a retest of that level at some point. Since the level has been reclaimed, OP is now inside a potential range between $1.41 and $2. Only a break of either level will confirm where we should be headed next. In the meantime, opportunities will present themselves in the short term, and we’ll spot them before they happen - as always. On that note, a move to $2 could happen soon (we’re talking days).
LDO | Lido DAO
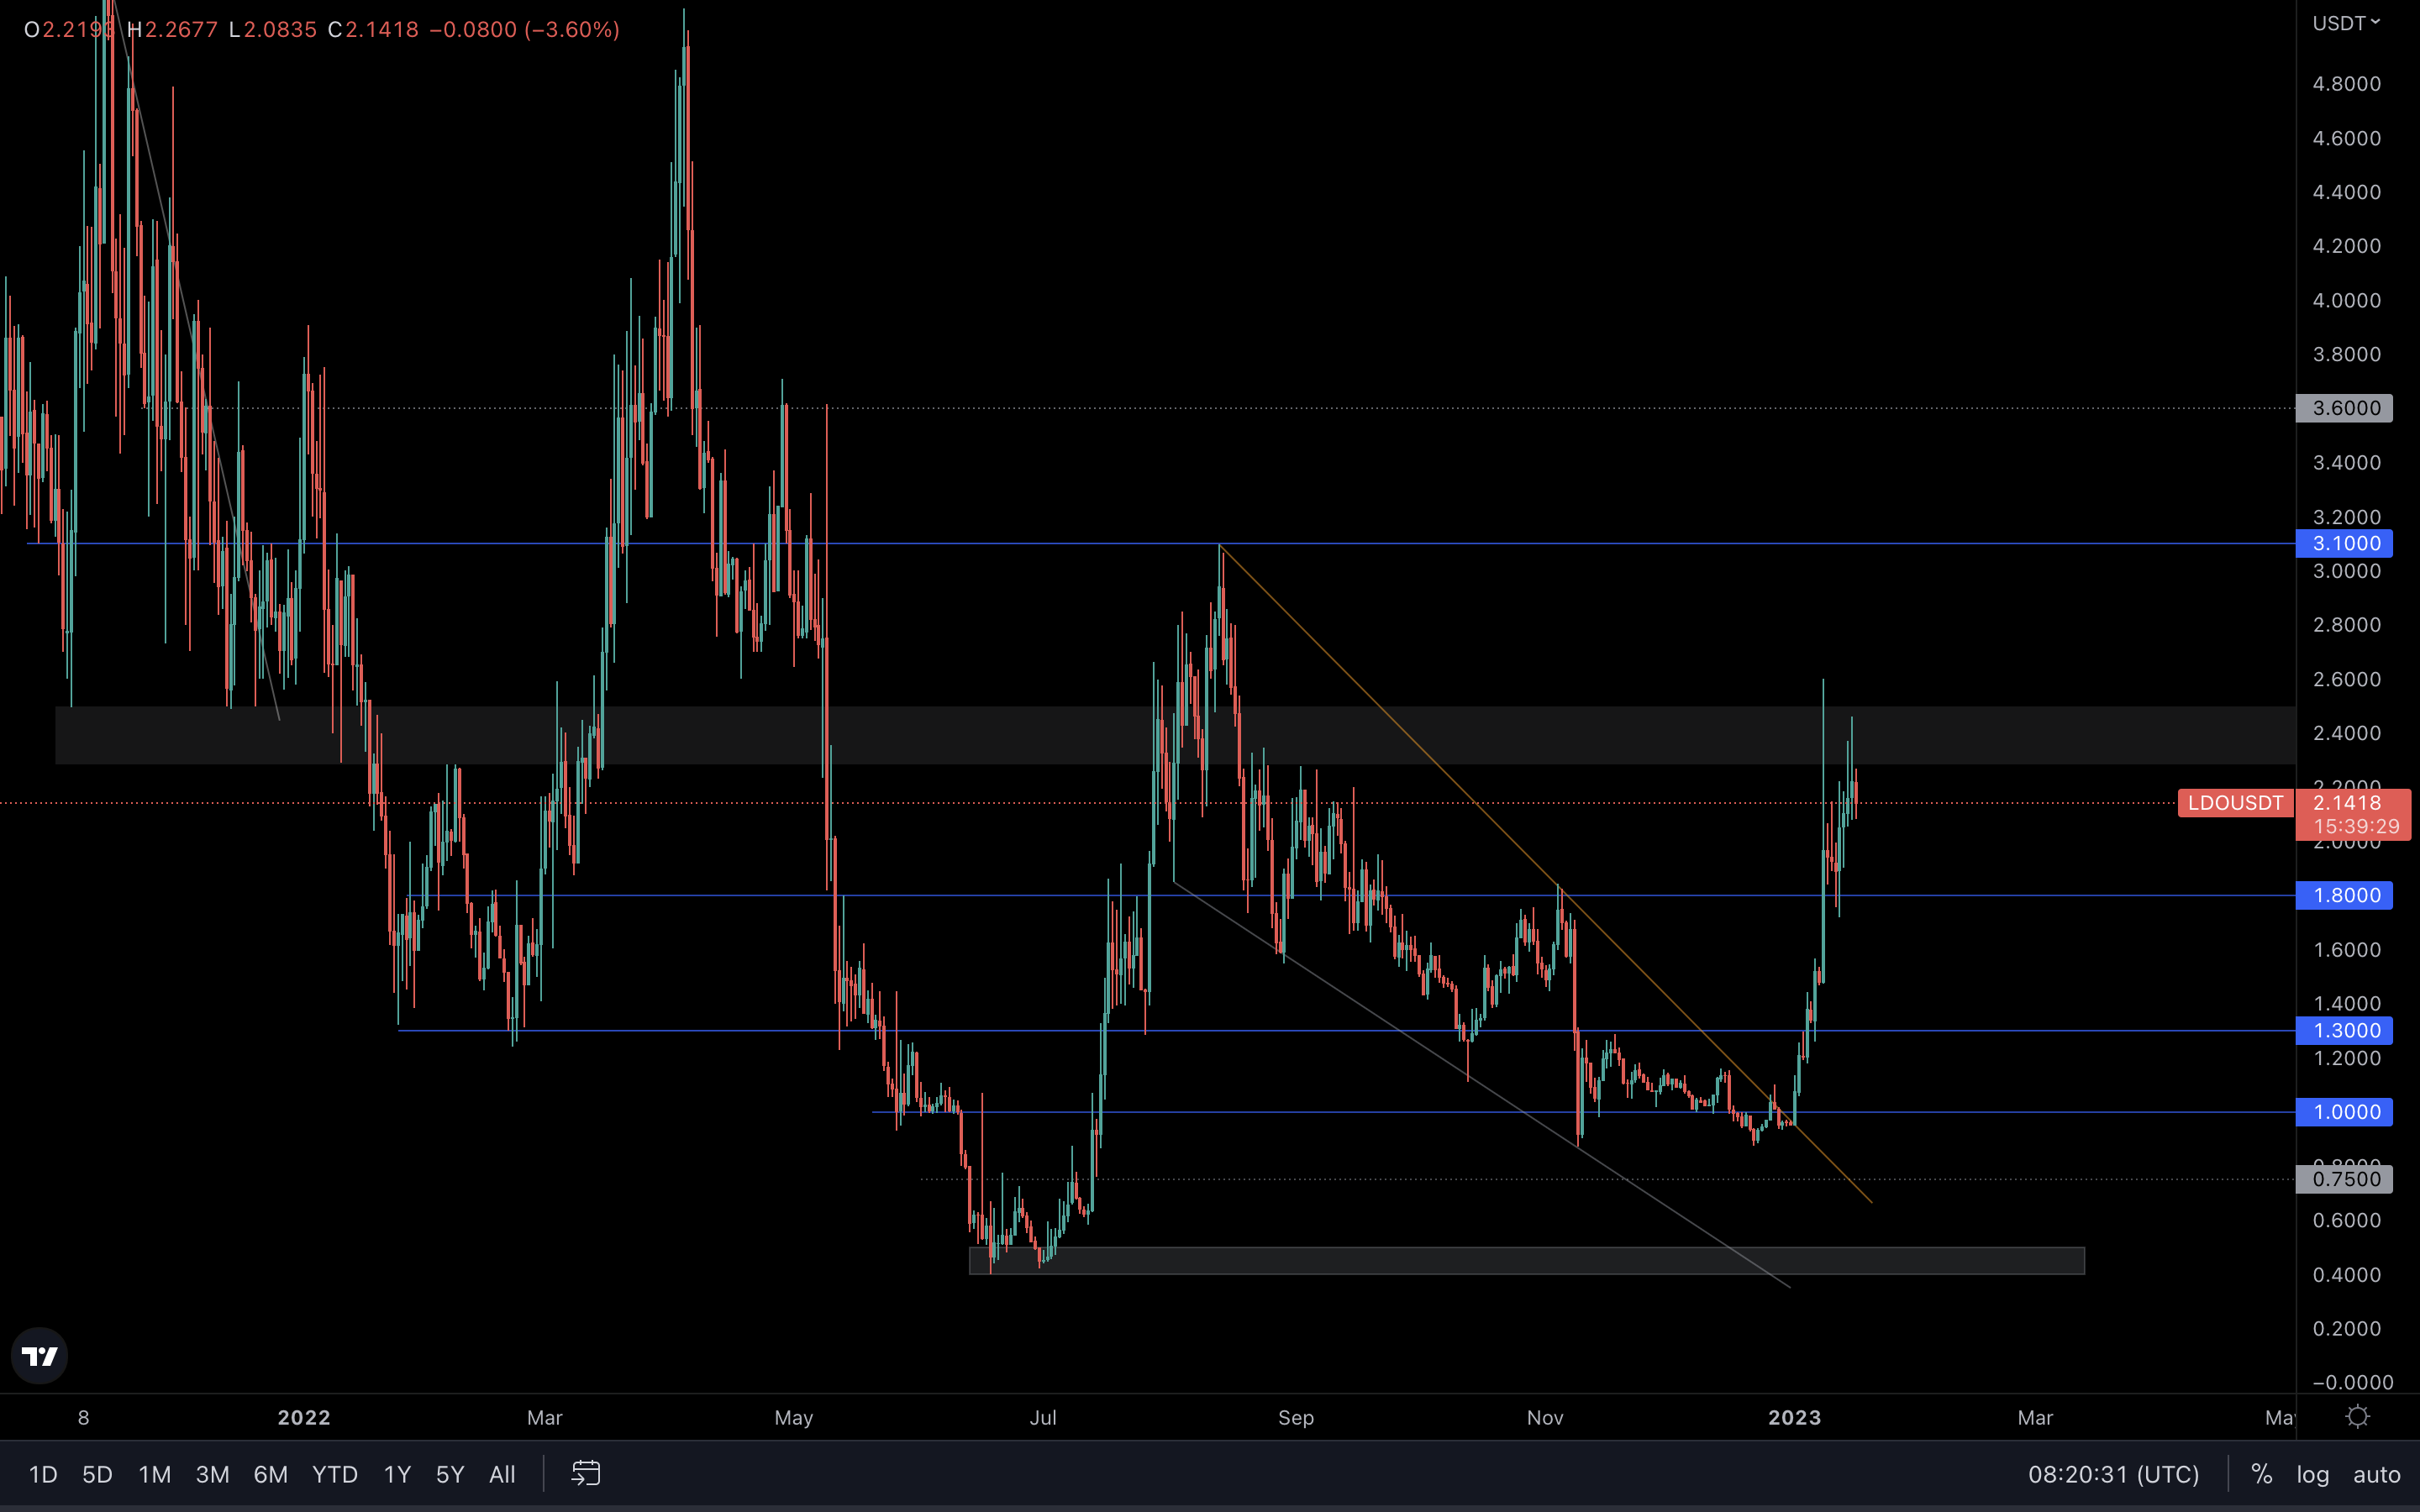 (Daily chart)
Similar to OP, LDO is also inside a potential range between $2.50 and $1.80. Until we see a break of either of these levels, the asset will continue to range, which makes it great for opportunity-taking, especially because of its volatility.
(Daily chart)
Similar to OP, LDO is also inside a potential range between $2.50 and $1.80. Until we see a break of either of these levels, the asset will continue to range, which makes it great for opportunity-taking, especially because of its volatility.
If $2.50 is reclaimed (weekly closure above would be ideal), then we should look at $3.10 as being our next target.
HEGIC | Hegic
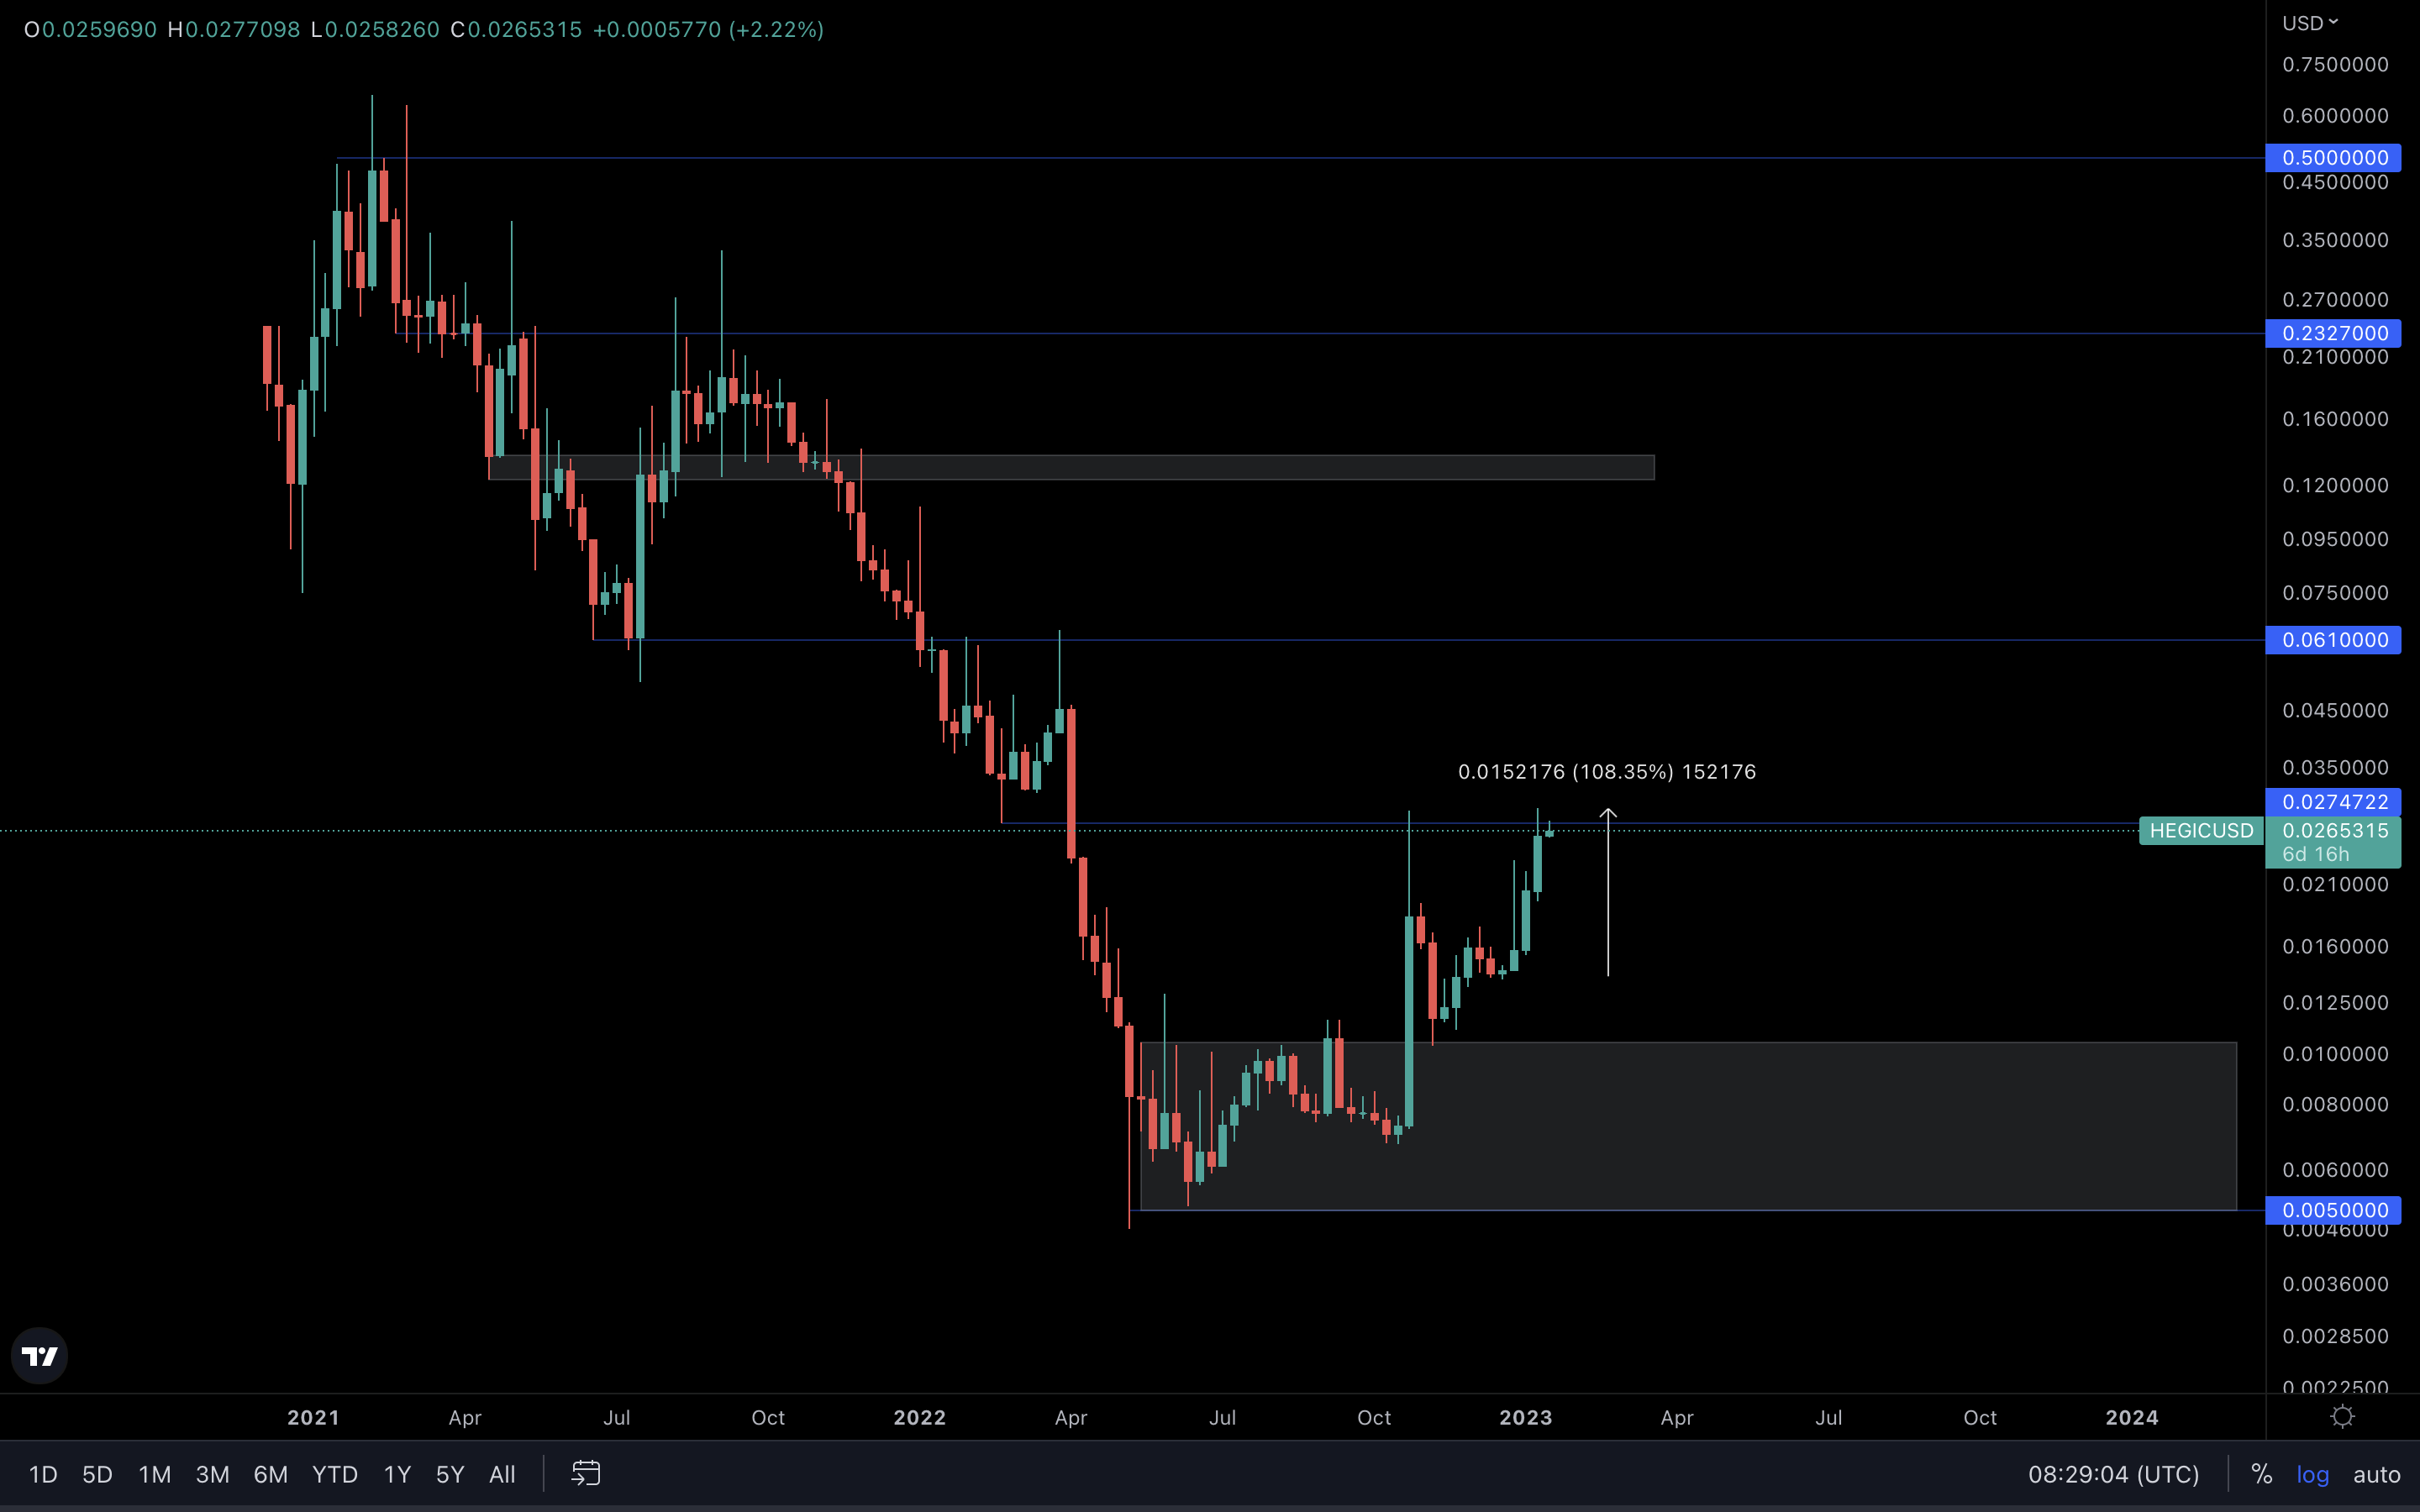
HEGIC has reached resistance on the weekly timeframe. To confirm further upside, a weekly reclaim of this current level is necessary, which will put $0.061 as our next target. Keep in mind that the asset has already risen over 100% in the last four weeks, which means that at some point, this move will become overextended and chances of a pullback will increase. The beautiful thing on this chart, however, isn’t the fact that HEGIC has risen over 100% in four weeks. Sure, that’s nice, but we’re more interested in its market structure. HEGIC’s weekly market structure has turned bullish, which means the technicals are backing up further upside. As long as this market structure remains intact, we will continue to see HEGIC form higher highs and higher lows on the way up to higher targets.
THOR | THORSwap
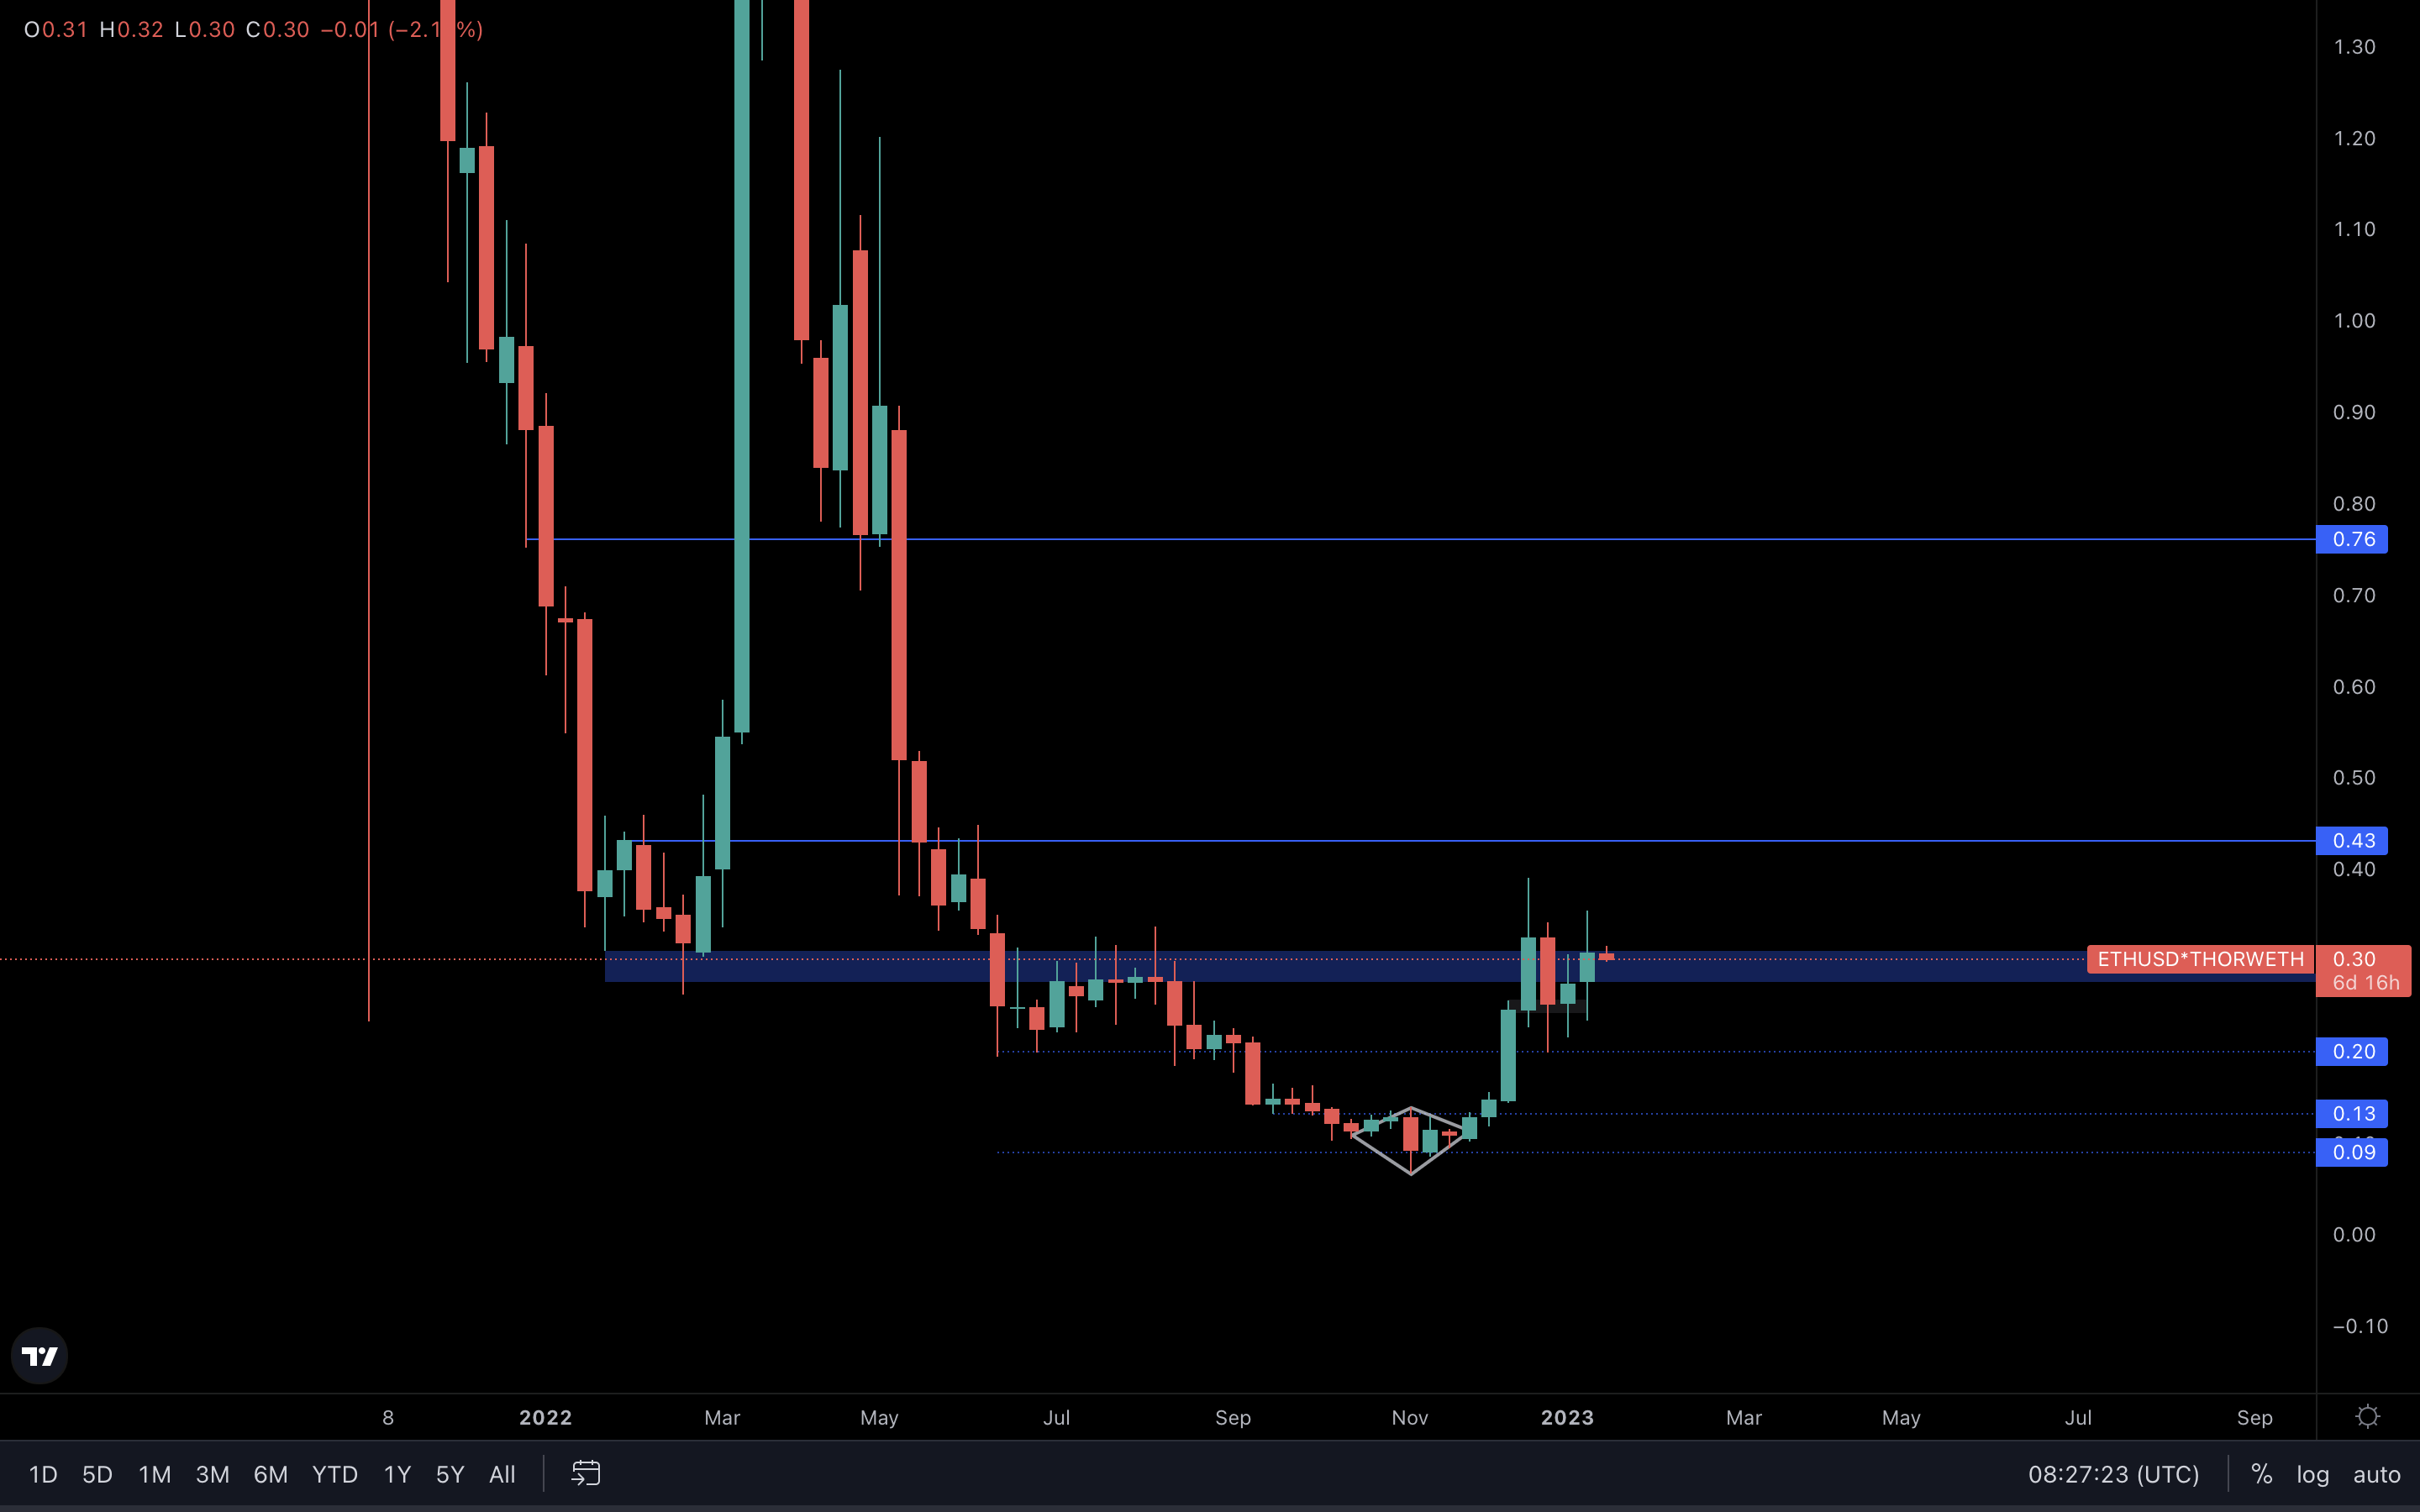
Two weeks ago, the blue box was acting as resistance. Last week, THOR reclaimed this area and turned it into support. This now confirms a move to $0.43 next, as long as THOR doesn’t lose the support by closing a weekly candle below $0.28.
MINA | Mina Protocol
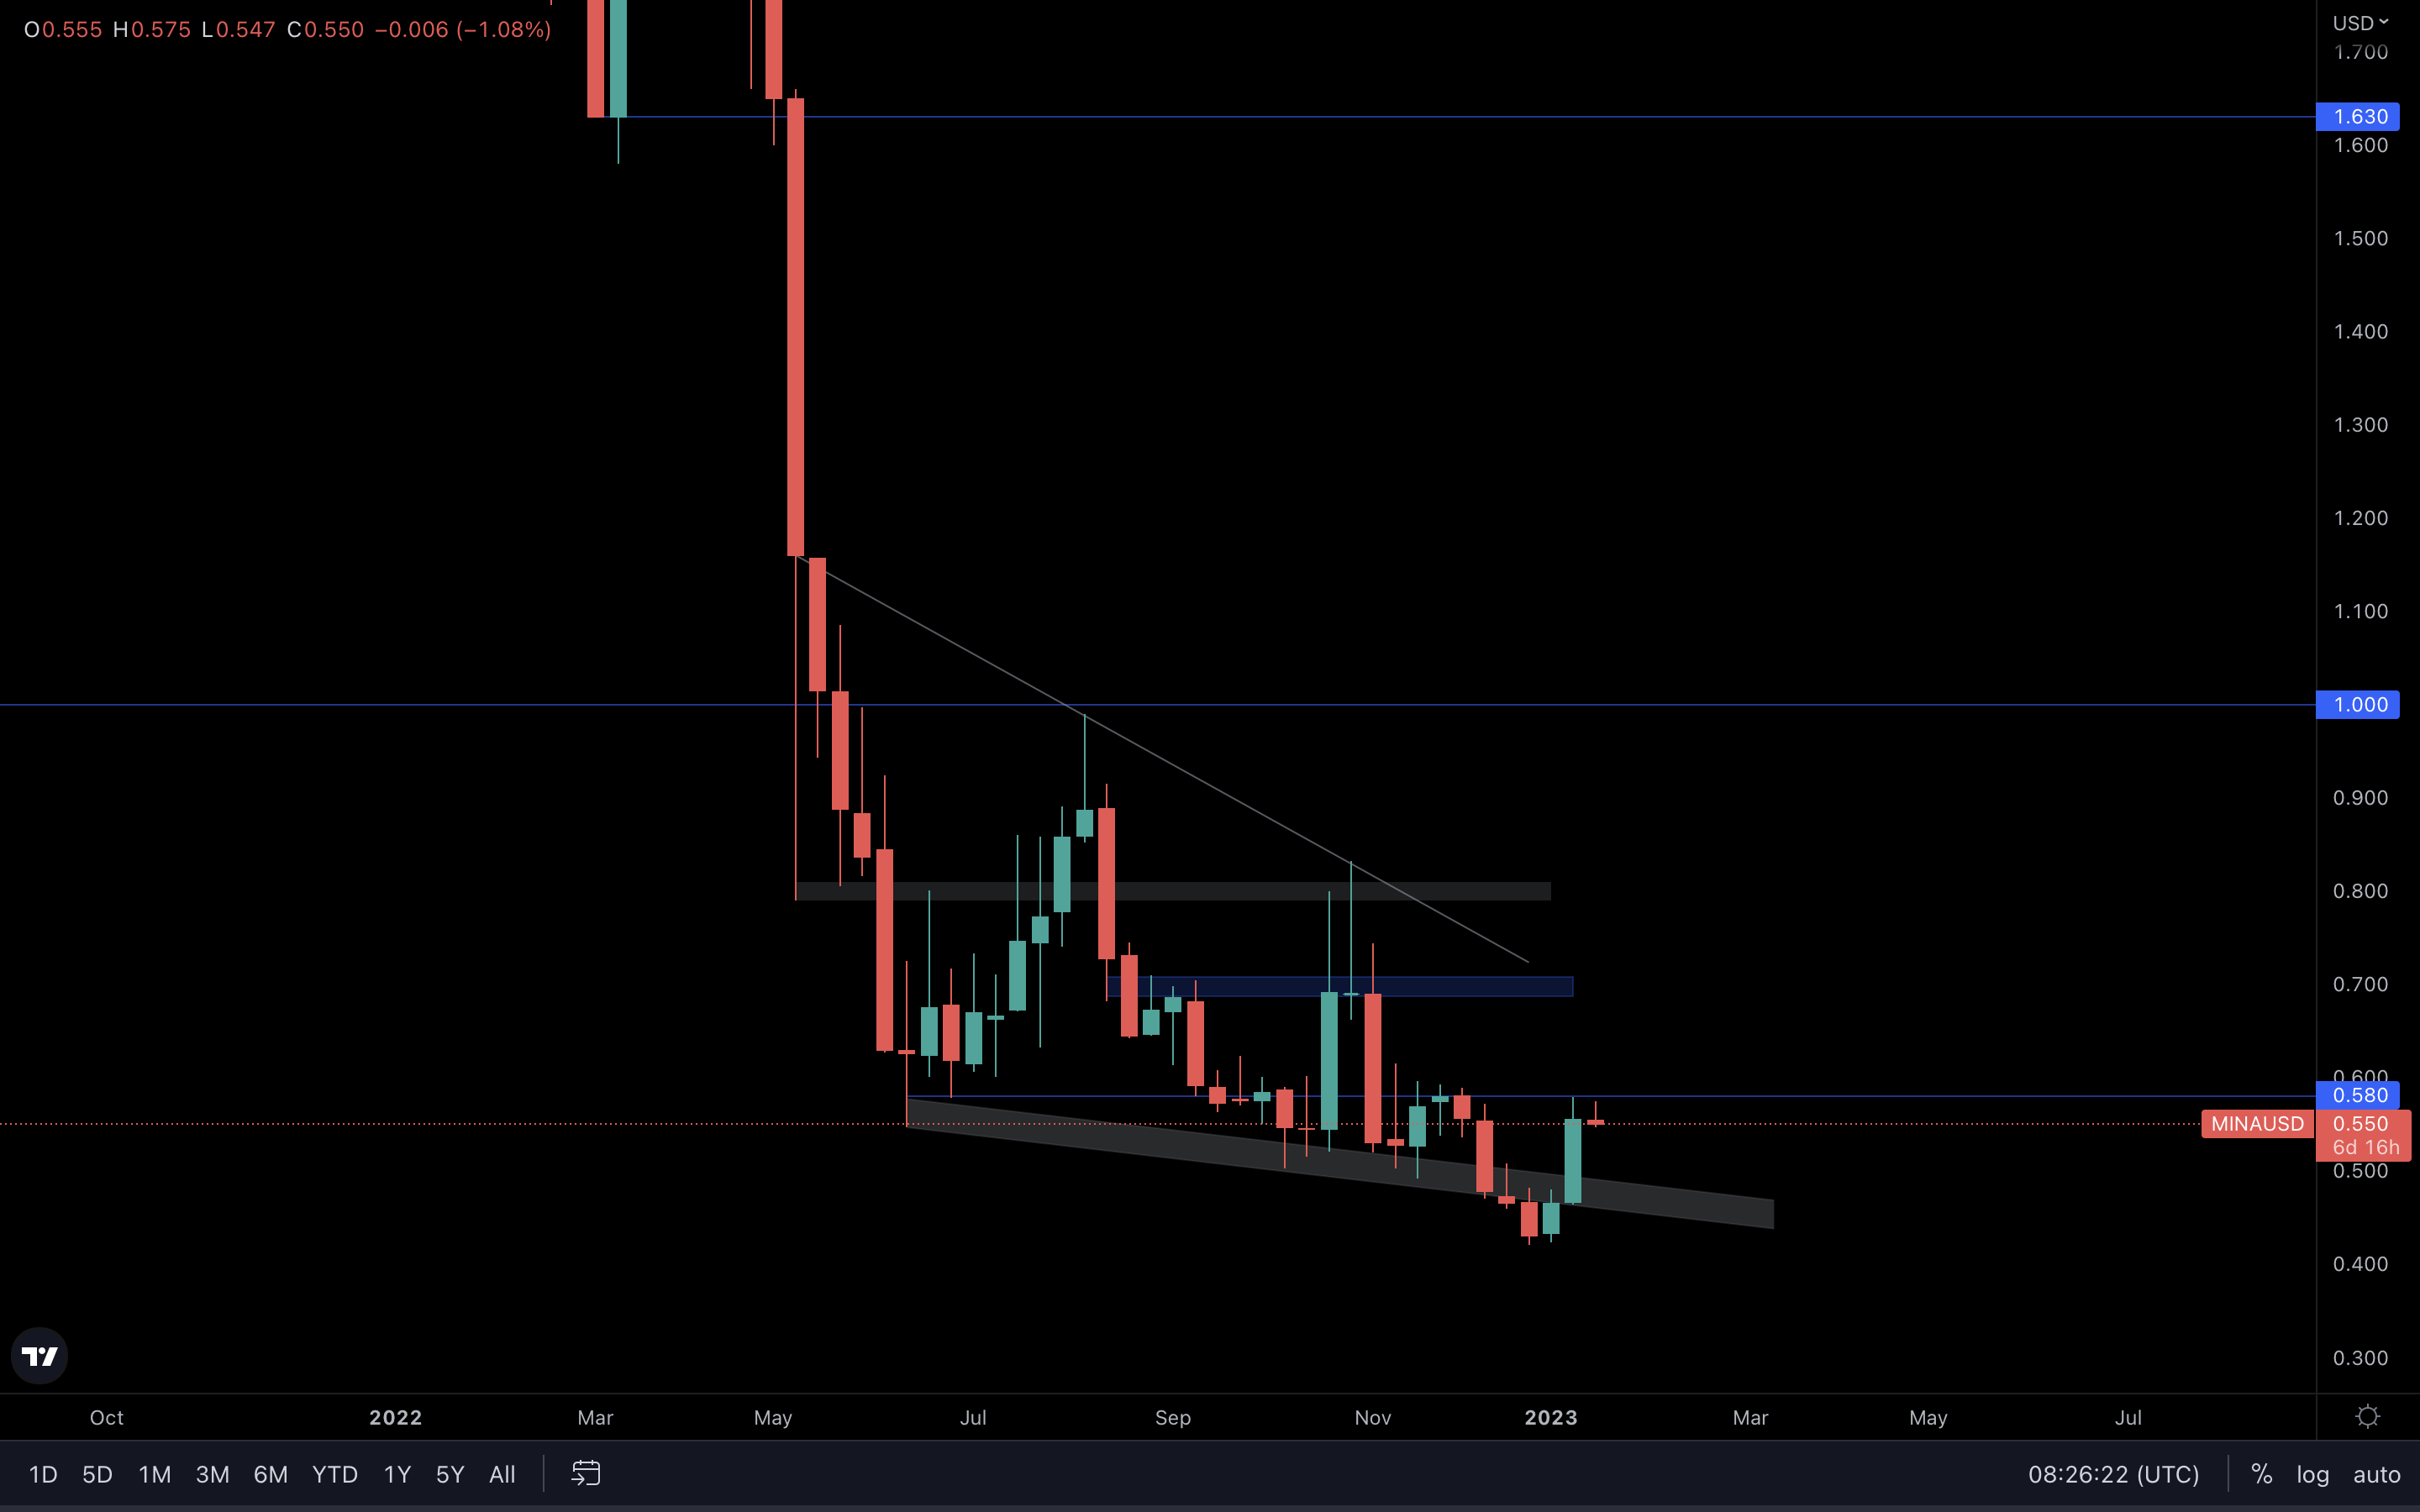
After successfully reclaiming the channel on lower timeframes, MINA has seen a buying impulse (same as almost all assets) which pushed its price to the $0.58 resistance level. A weekly reclaim of $0.58 is necessary to confirm further upside. Otherwise, MINA risks getting rejected and dropping back to the channel.
DYDX | dYdX
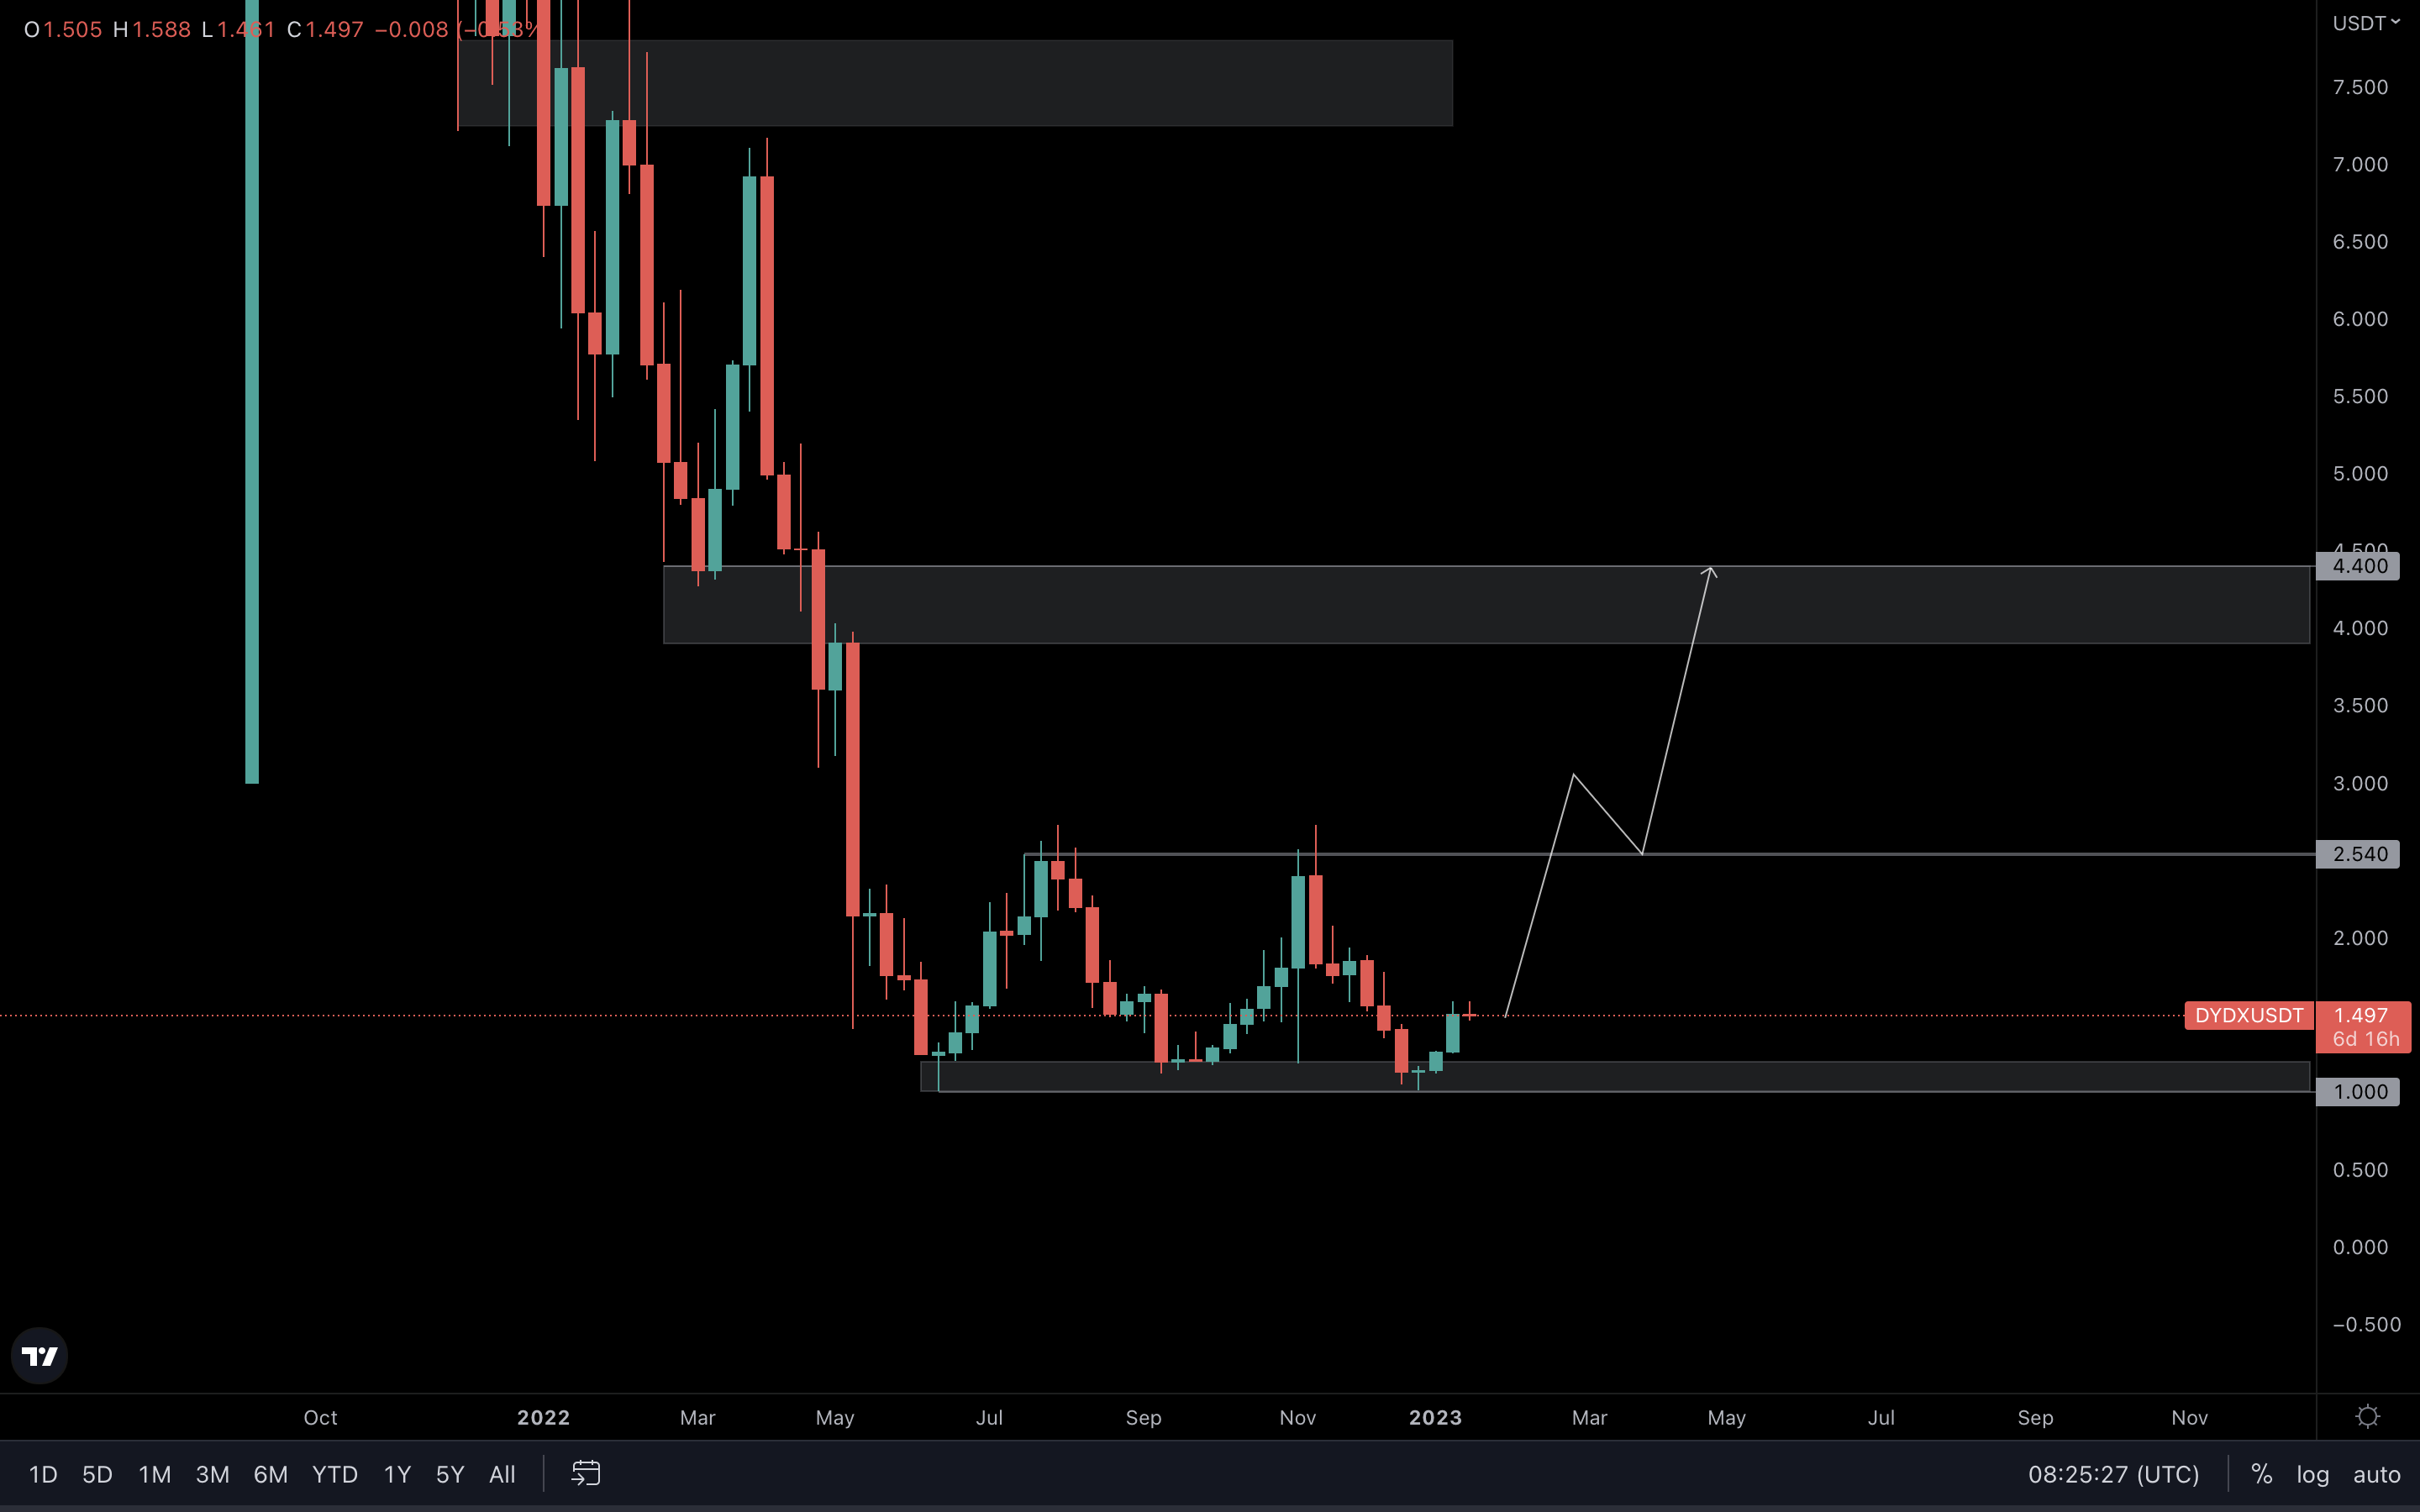
This is one of the cleanest charts in the entire report, purely because of its accuracy. DYDX has been ranging inside of the $2.50 - $1 range for over 200 days, and we believe this chart has the potential to turn into a triple bottom.
For this to be true, DYDX needs to rise to $2.50 and reclaim the level. By the time that happens, DYDX would’ve already risen ~67% from its current price up to $2.50, not a performance you’d want to miss.
There have been two times in the past when DYDX saw a short-term rally after testing the bottom support area around $1. Little to no stops. Just pure bull energy. Q: Could that happen again? A: Absolutely. Ever since the FTX fiasco, the user count on dYdX has risen a lot as the exchange is completely decentralized. From a fundamental standpoint, the project could sustain such a scenario with little to no effort. Buyers are there, otherwise DYDX wouldn’t have risen 50% in the last three weeks alone.
However, for this to happen, we’ll need the rest of the market to perform well. If the performance we’ve seen in the last two weeks comes to an end, DYDX will be unable to continue rising toward $2.50 and above at this time, invalidating the potential triple bottom.
This is definitely a chart worth tracking even while sleeping.
Cryptonary’s take
I’m sure you’ve heard this 100 times by now, but we are in a bear market. Until we see clear changes in market structures across the board, nothing can change that.
- The bottoming process will span over multiple months, and we’re sure that this rally will definitely not bring us to all-time highs.
- Don’t get your hopes too high. Opportunities can arise from time to time, but we will likely go down again at some point this year.
- Take profits on the way up. Don’t get greedy. Stay humble.
Recommended from Cryptonary


