Log in

Save 23% ($351) & Get a Free 1-1 Call with our Team ⏰ : 0d 2h 59m 43s

Home
Research
Analysis
Community
  1. Cryptonary
  2. Market Analysis
  3. JUP technical analysis: Will $0.87 hold for a move to $1.2?
Technical Analysis

JUP technical analysis: Will $0.87 hold for a move to $1.2?

Published: Oct 16, 2024
0
Share:

Jupiter has shown promising bullish moves after holding above $0.87. Can it break resistance at $0.94 and rally to $1.2? Here’s what the charts are telling us.

Post Feature Image

Disclaimer: This is not financial or investment advice. You are responsible for any capital-related decisions you make, and only you are accountable for the results.


Overview

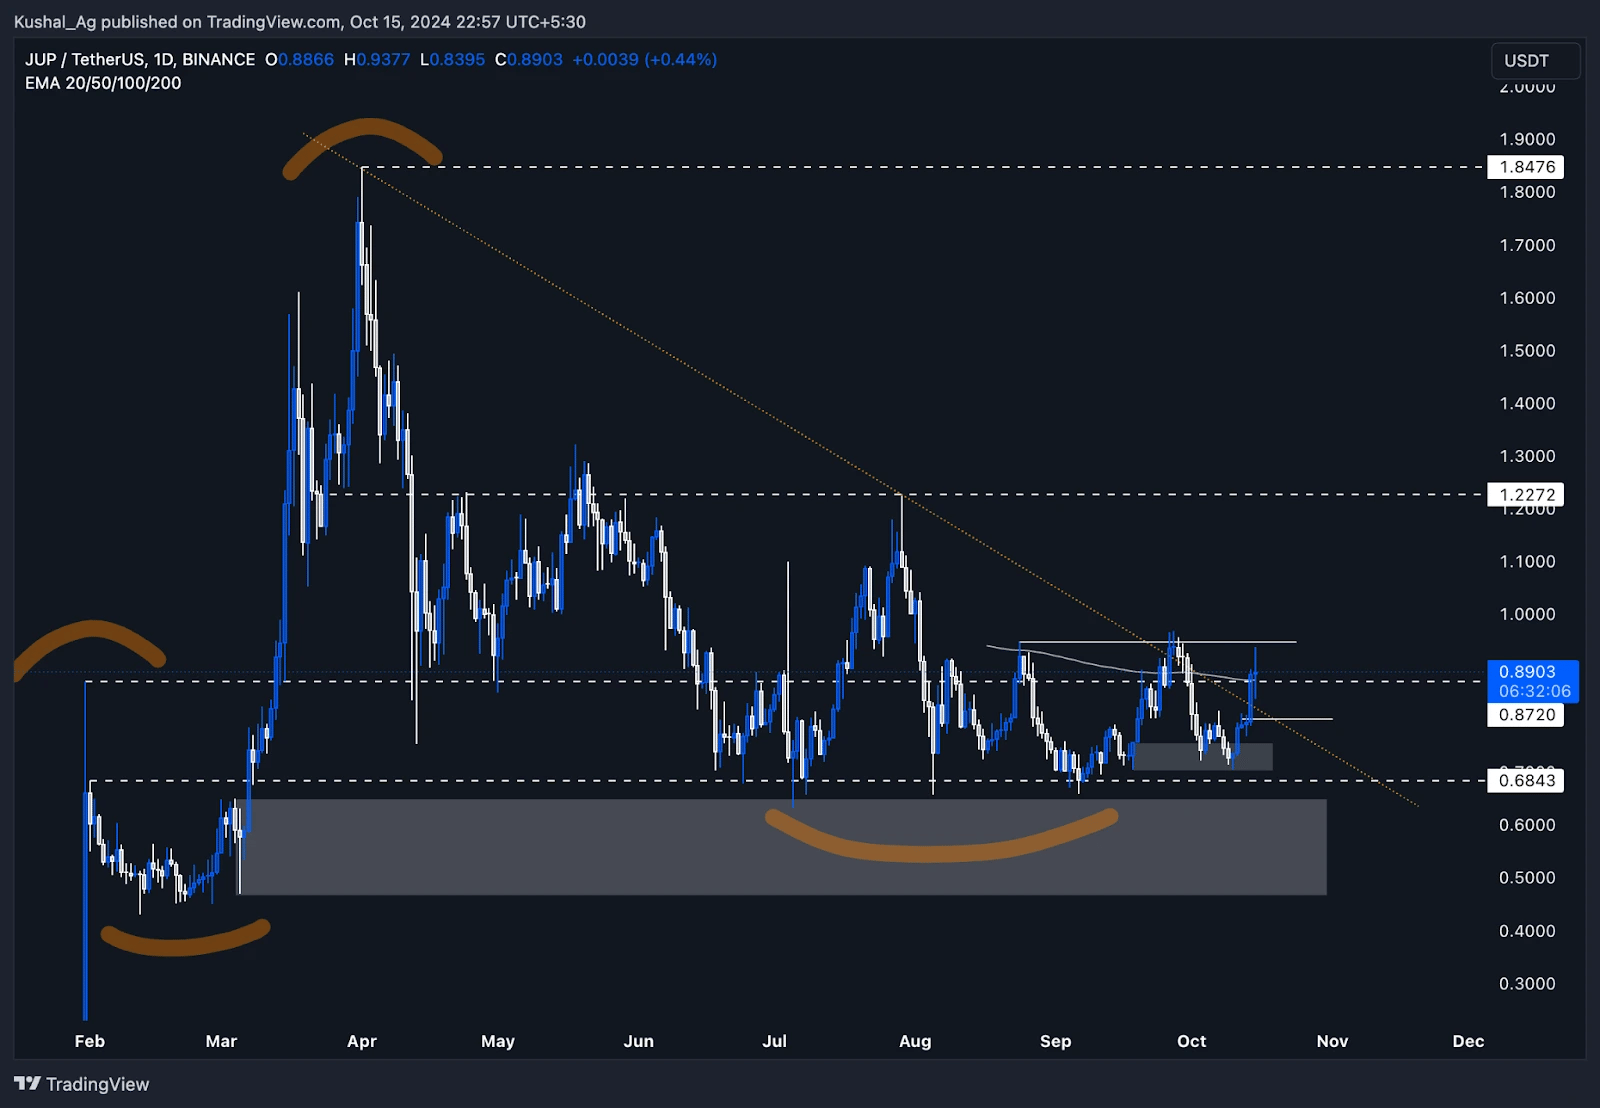
Jupiter ($JUP) has been showing some promising movements in the last two weeks, especially after our previous analysis earlier this month. The asset has been consolidating and forming key support and resistance levels on the daily time frame, indicating potential momentum for an upside move if critical resistances are broken.

Daily chart analysis

At the time of our last analysis, Jupiter was pulling back into a demand zone between $0.75 and $0.70, which is a key area of support in the lower time frame. The price has reacted positively from this zone, confirming it as a strong support level.
  • Support zone: Jupiter took a strong bounce from this demand zone around October 4th and made another deeper test on October 10th, pushing into the lower part of the zone before reversing upwards.
  • Price movement: After the second test, Jupiter saw a 25-30% bullish swing to the upside, indicating strong buying interest at these levels.
  • Current levels: As of today, Jupiter is attempting to sustain above the $0.87 level, which is also where the 200 EMA lies on the daily chart. This level is crucial as maintaining price action above the 200 EMA would confirm strength and signal further bullish momentum.
Resistance levels
  • Jupiter is currently facing rejection around the $0.94 level, a key resistance area that has been marked previously.
  • If Jupiter manages to break and hold above this $0.94 resistance, it could open the door for a rally toward $1.2 in the coming weeks.
Possible pullback
  • In case of a pullback, the $0.8 area represents a key retest level, aligning with the orange trendline. This zone would serve as a healthy retracement and accumulation point before another potential upward move.
1. A cryptocurrency price chart shows price movements, key resistance, and support levels, along with trendlines and curved patterns.

Cryptonary's take

Jupiter is currently in a critical phase. The price has been reacting positively from strong demand zones, and now it's a matter of whether it can sustain above $0.87 and break the resistance at $0.94. If it manages to break through and consolidate above, we could see a significant move toward $1.2 and beyond in the medium term.

However, traders should keep an eye on the 200 EMA and the $0.87 level. If the price fails to hold here, a pullback to $0.8 or even lower could be likely. Overall, Jupiter is looking strong but will need to confirm strength through key breakout levels to see further upside.

Get started for free

Create your free account or log in to read the full article.

​

Germany

By signing up, you agree to our Terms & Conditions
Recommended from Cryptonary
Market Update: Macro Risks Signal Further Downside
PRO
Market Updates
Market Update: Macro Risks Signal F...Earlier in the week, we had a lot of questions about whether we still see the $50k-$60k level being ...
11 min read
Mar 27, 2026
BTC, ETH and More: Crypto Structure Diverges, Bitcoin Remains Fragile
PRO
Market Direction
BTC, ETH and More: Crypto Structure...Over the past week, downside played out where expected, but follow-through has been inconsistent, wi...
11 min read
Mar 24, 2026
Market Update: Risk Assets Rebound Amid Tightening Conditions
PRO
Market Updates
Market Update: Risk Assets Rebound ...The market just gave us a perfect example of how fragile this environment is. Escalation over the we...
8 min read
Mar 23, 2026
Market Update: Trump Threats Escalate, Risk Assets Dive
PRO
Market Updates
Market Update: Trump Threats Escala...After a week of escalating rhetoric and no clear path to de-escalation, the Middle East conflict has...
7 min read
Apr 2, 2026
BTC, ETH and More: Short-Term Upside Liquidity in Play
PRO
Market Direction
BTC, ETH and More: Short-Term Upsid...Markets are pausing at key levels, and the next move is starting to take shape. After completing the...
13 min read
Mar 31, 2026
Market Update: Fed in a Bind & Bitcoin at a Breaking Point
PRO
Market Updates
Market Update: Fed in a Bind & Bitc...Markets are turning fragile as escalating Middle East tensions drive a clear risk-off shift, tighten...
8 min read
Mar 30, 2026
Market Update: Macro Risks Signal Further Downside
PRO
Market Updates
Market Update: Macro Risks Signal F...Earlier in the week, we had a lot of questions about whether we still see the $50k-$60k level being ...
11 min read
Mar 27, 2026
BTC, ETH and More: Crypto Structure Diverges, Bitcoin Remains Fragile
PRO
Market Direction
BTC, ETH and More: Crypto Structure...Over the past week, downside played out where expected, but follow-through has been inconsistent, wi...
11 min read
Mar 24, 2026
Market Update: Risk Assets Rebound Amid Tightening Conditions
PRO
Market Updates
Market Update: Risk Assets Rebound ...The market just gave us a perfect example of how fragile this environment is. Escalation over the we...
8 min read
Mar 23, 2026
Research
Top PicksDeep DivesPassive IncomeAirdrop ReportsMemecoins
Analysis
Market UpdatesMarket DirectionMarket PulseLivestreams
Tools
Market DirectionAssets & PicksAirdropsPortfolio Tracker
Cryptonary
Affiliate programEducationPrivacy PolicyTerms & ConditionsContact UsWrite for usTeam
Stay connected
Disclaimer: The information provided on this website is for educational and informational purposes only and does not constitute financial, investment, legal, or tax advice. Cryptonary is not a licensed financial advisor. All content is shared without any guarantee of accuracy or completeness. You are solely responsible for your investment decisions. Always do your own research and consult with a licensed professional before making financial choices. Past performance is not indicative of future results.

×
popupimage
Our Latest Utility Token Research ReportPreviously locked for Pro members, now available to read in full.
  • tickThe utility token we're tracking closely
  • tickWhy we believe it's still early in the cycle
  • tickWhat we're watching to confirm a structural shift
​
Germany

No spam. No hype. Just the research.