Save 23% ($351) & Get a Free 1-1 Call with our Team ⏰ : 0d 2h 59m 43s

Disclaimer: This is not financial or investment advice. You are responsible for any capital-related decisions you make, and only you are accountable for the results.
JUP:
Overview
Jupiter ($JUP) has been showing some promising movements in the last two weeks, especially after our previous analysis earlier this month. The asset has been consolidating and forming key support and resistance levels on the daily time frame, indicating potential momentum for an upside move if critical resistances are broken.Daily chart analysis
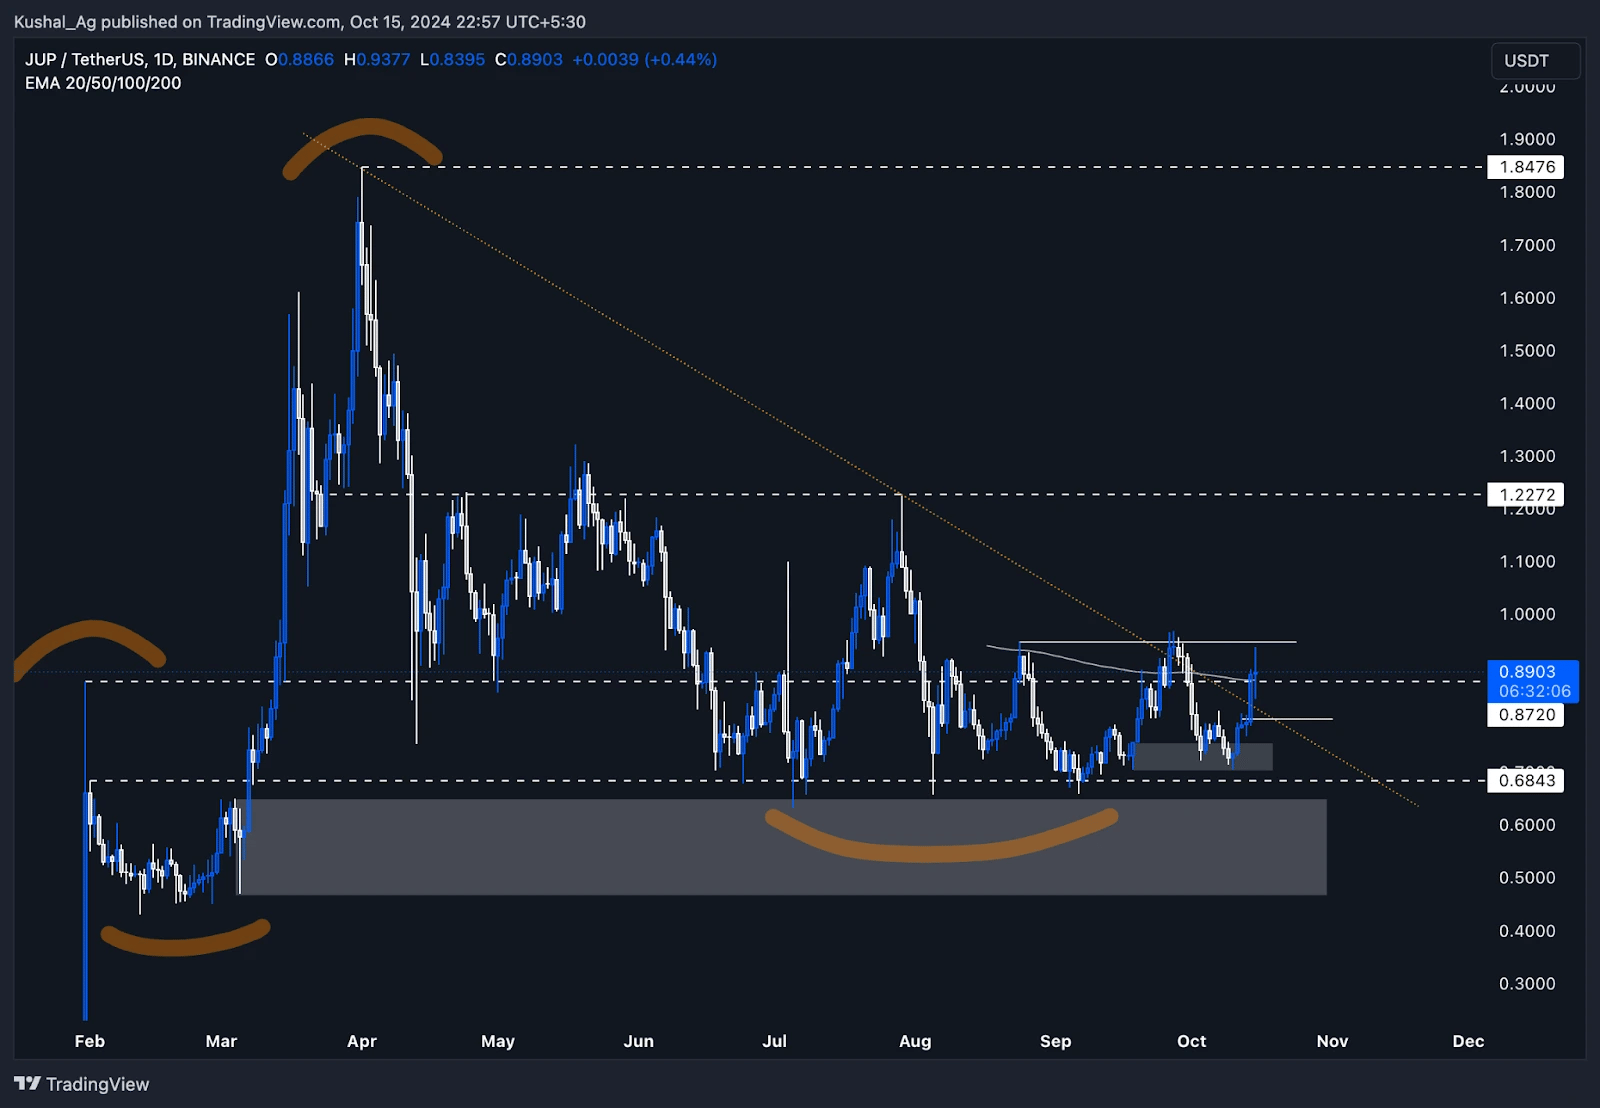
At the time of our last analysis, Jupiter was pulling back into a demand zone between $0.75 and $0.70, which is a key area of support in the lower time frame. The price has reacted positively from this zone, confirming it as a strong support level.- Support zone: Jupiter took a strong bounce from this demand zone around October 4th and made another deeper test on October 10th, pushing into the lower part of the zone before reversing upwards.
- Price movement: After the second test, Jupiter saw a 25-30% bullish swing to the upside, indicating strong buying interest at these levels.
- Current levels: As of today, Jupiter is attempting to sustain above the $0.87 level, which is also where the 200 EMA lies on the daily chart. This level is crucial as maintaining price action above the 200 EMA would confirm strength and signal further bullish momentum.
- Jupiter is currently facing rejection around the $0.94 level, a key resistance area that has been marked previously.
- If Jupiter manages to break and hold above this $0.94 resistance, it could open the door for a rally toward $1.2 in the coming weeks.
- In case of a pullback, the $0.8 area represents a key retest level, aligning with the orange trendline. This zone would serve as a healthy retracement and accumulation point before another potential upward move.
Cryptonary's take
Jupiter is currently in a critical phase. The price has been reacting positively from strong demand zones, and now it's a matter of whether it can sustain above $0.87 and break the resistance at $0.94. If it manages to break through and consolidate above, we could see a significant move toward $1.2 and beyond in the medium term.However, traders should keep an eye on the 200 EMA and the $0.87 level. If the price fails to hold here, a pullback to $0.8 or even lower could be likely. Overall, Jupiter is looking strong but will need to confirm strength through key breakout levels to see further upside.
BNB:
Market context
We had that blue range box on BNB between $500 and $622. The key thing we've been focusing on is the head and shoulders pattern formed in candlestick form. The left shoulder was printed on Monday, 1st July. The neckline followed on Monday, 22nd July, with the head forming on 5th August via a weekly wick candlestick. The neckline was respected on 19th August, and the right shoulder was accurately tested on 2nd September.Looking back, this neckline acts as a box resistance range, especially when considering the March-April period, when we saw numerous wicks, indicating significant selling pressure in that region. A breakout above this level would be crucial, signalling that buyers are stepping in and are willing to hold rather than sell at these levels.

Market mechanics
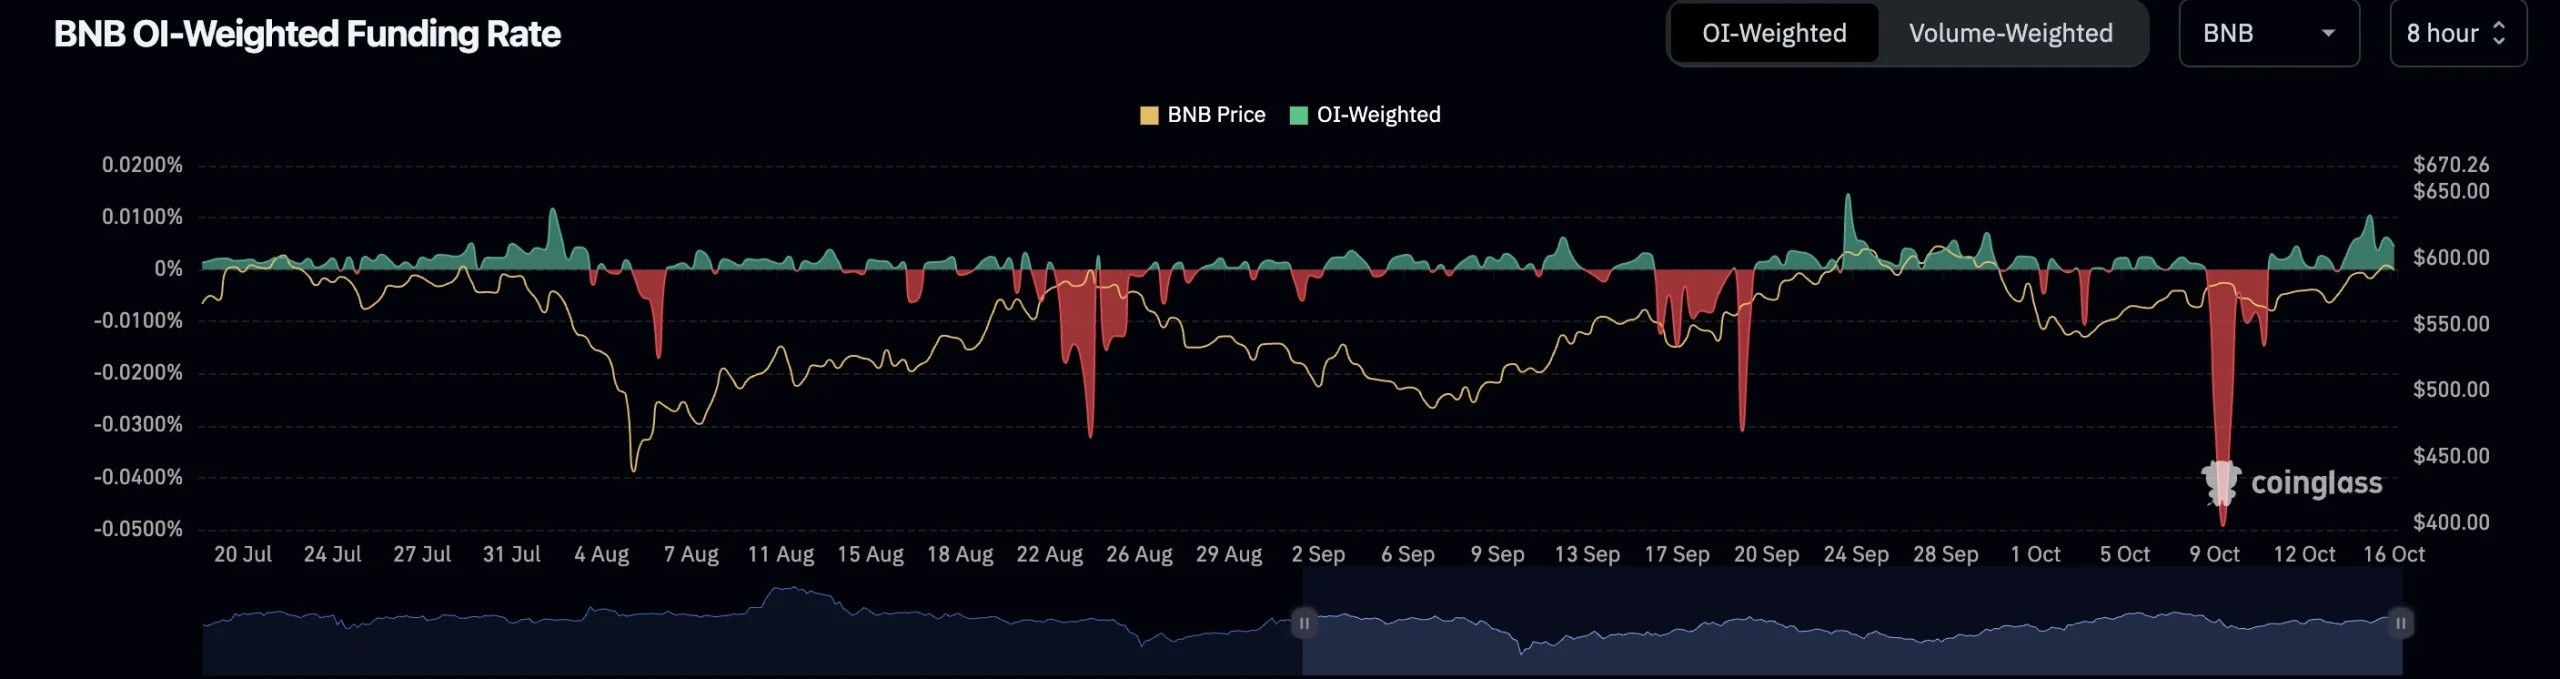
- On 9th October, we saw a massive ramp in the funding rate, heavily skewed to the negative, meaning sellers were paying a premium to be short. This has since rebalanced, and open interest has been relatively flat since June, with no major spikes.
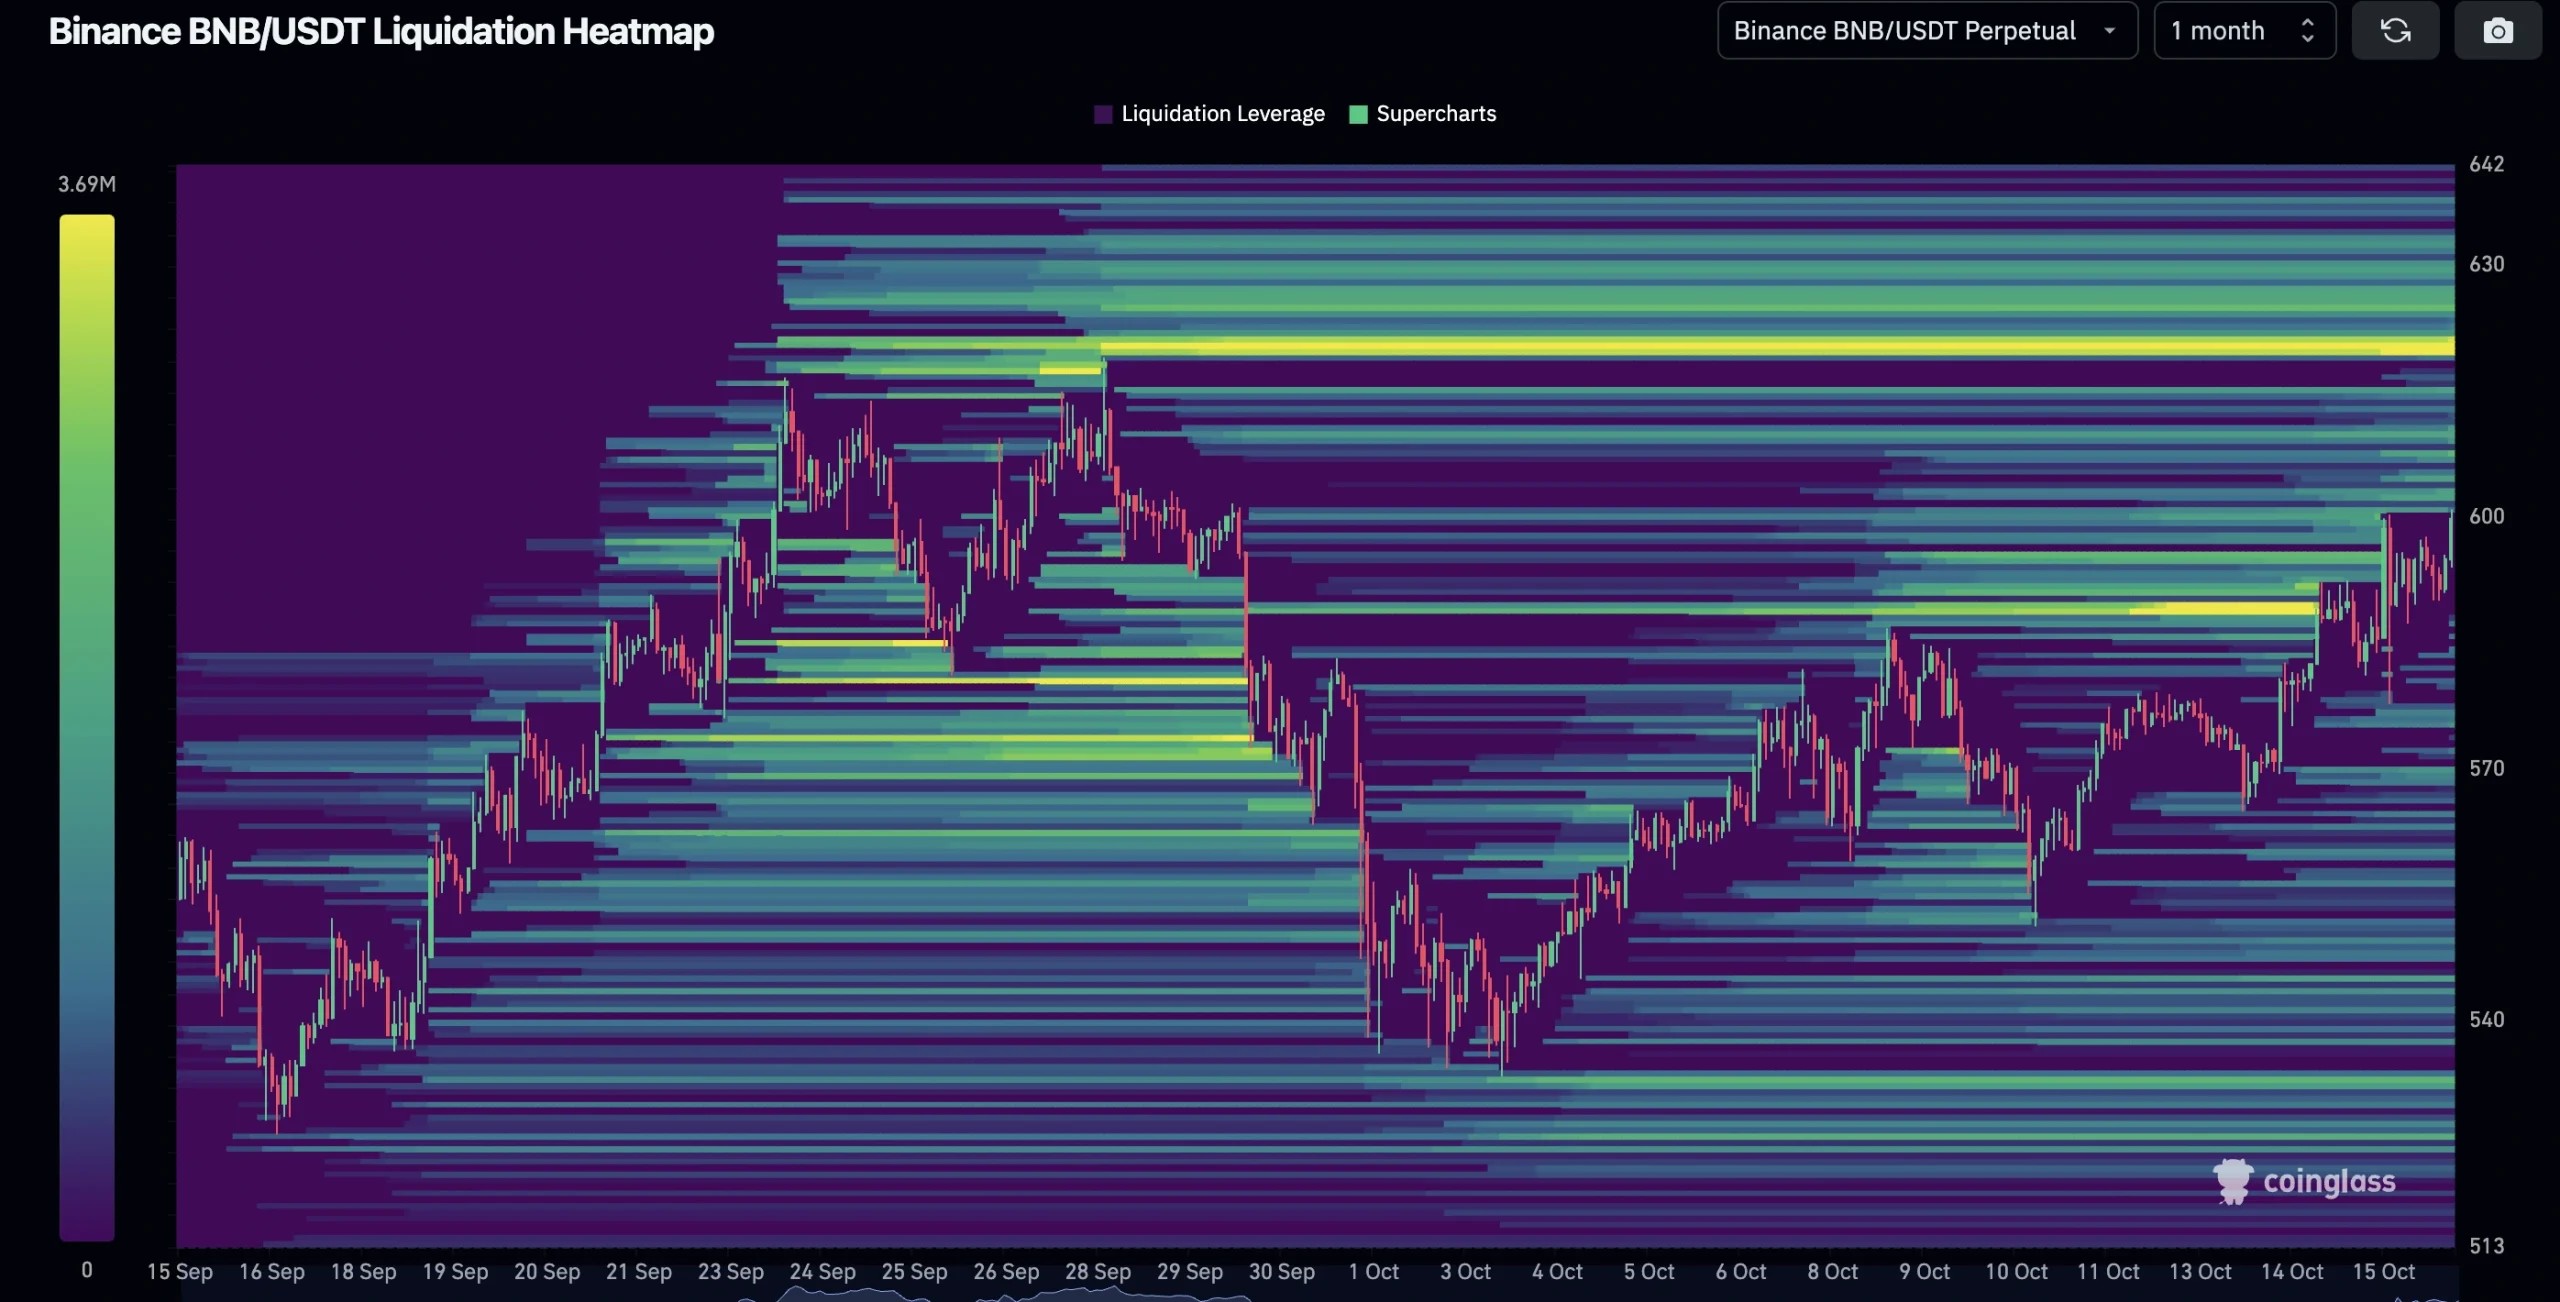
- The liquidation heat map shows a significant build-up of short positions above $600, which could be squeezed as we push upwards. There's even more liquidation potential just above $620, making this range particularly interesting for a potential squeeze.
Playbook
- If BNB can break and close strong above $622 and we see continued buying, then we'll be looking at a $622-$720 range. The wick from 3rd June correlates nicely to Bitcoin's push-up to approach its all-time highs.
- Currently, Bitcoin is rampaging at $68,000, back towards its 2021 all-time highs, which could carry BNB above $622. How long it stays there is uncertain, as there has been significant selling pressure between $622 and $720, much like Bitcoin's own struggles at its key levels.

Key levels
- $500-$622 (current range)
- $620-$720 (potential target after a breakout)
- Watch for short liquidations, and price squeezes above $600 and $620.
Risk management
We are at the top of a very key range, which may result in selling pressure. This is not the place to ape into any leverage long positions. Patience is key here. For those looking to accumulate, a DCA approach is good play in general. While BNB is approaching all-time highs, it may go into price discovery alongside Bitcoin and other majors. While not part of our CPRO picks, BNB has performed well this cycle.Cryptonary's take
BNB is on the brink of a significant breakout, especially with the support of Bitcoin's strong momentum. If it breaks through the $622 level, there's a solid chance it will move into the $620-$720 range and possibly into price discovery mode. While the fundamentals and market structure are strong, it's important to stay cautious, given the selling pressure historically seen around this level. DCA for spot accumulation looks ideal, but be patient with leverage positions as we sit at the top of a key range. Momentum is on BNB's side, but precision is key in managing risk.DOGE:
Market context
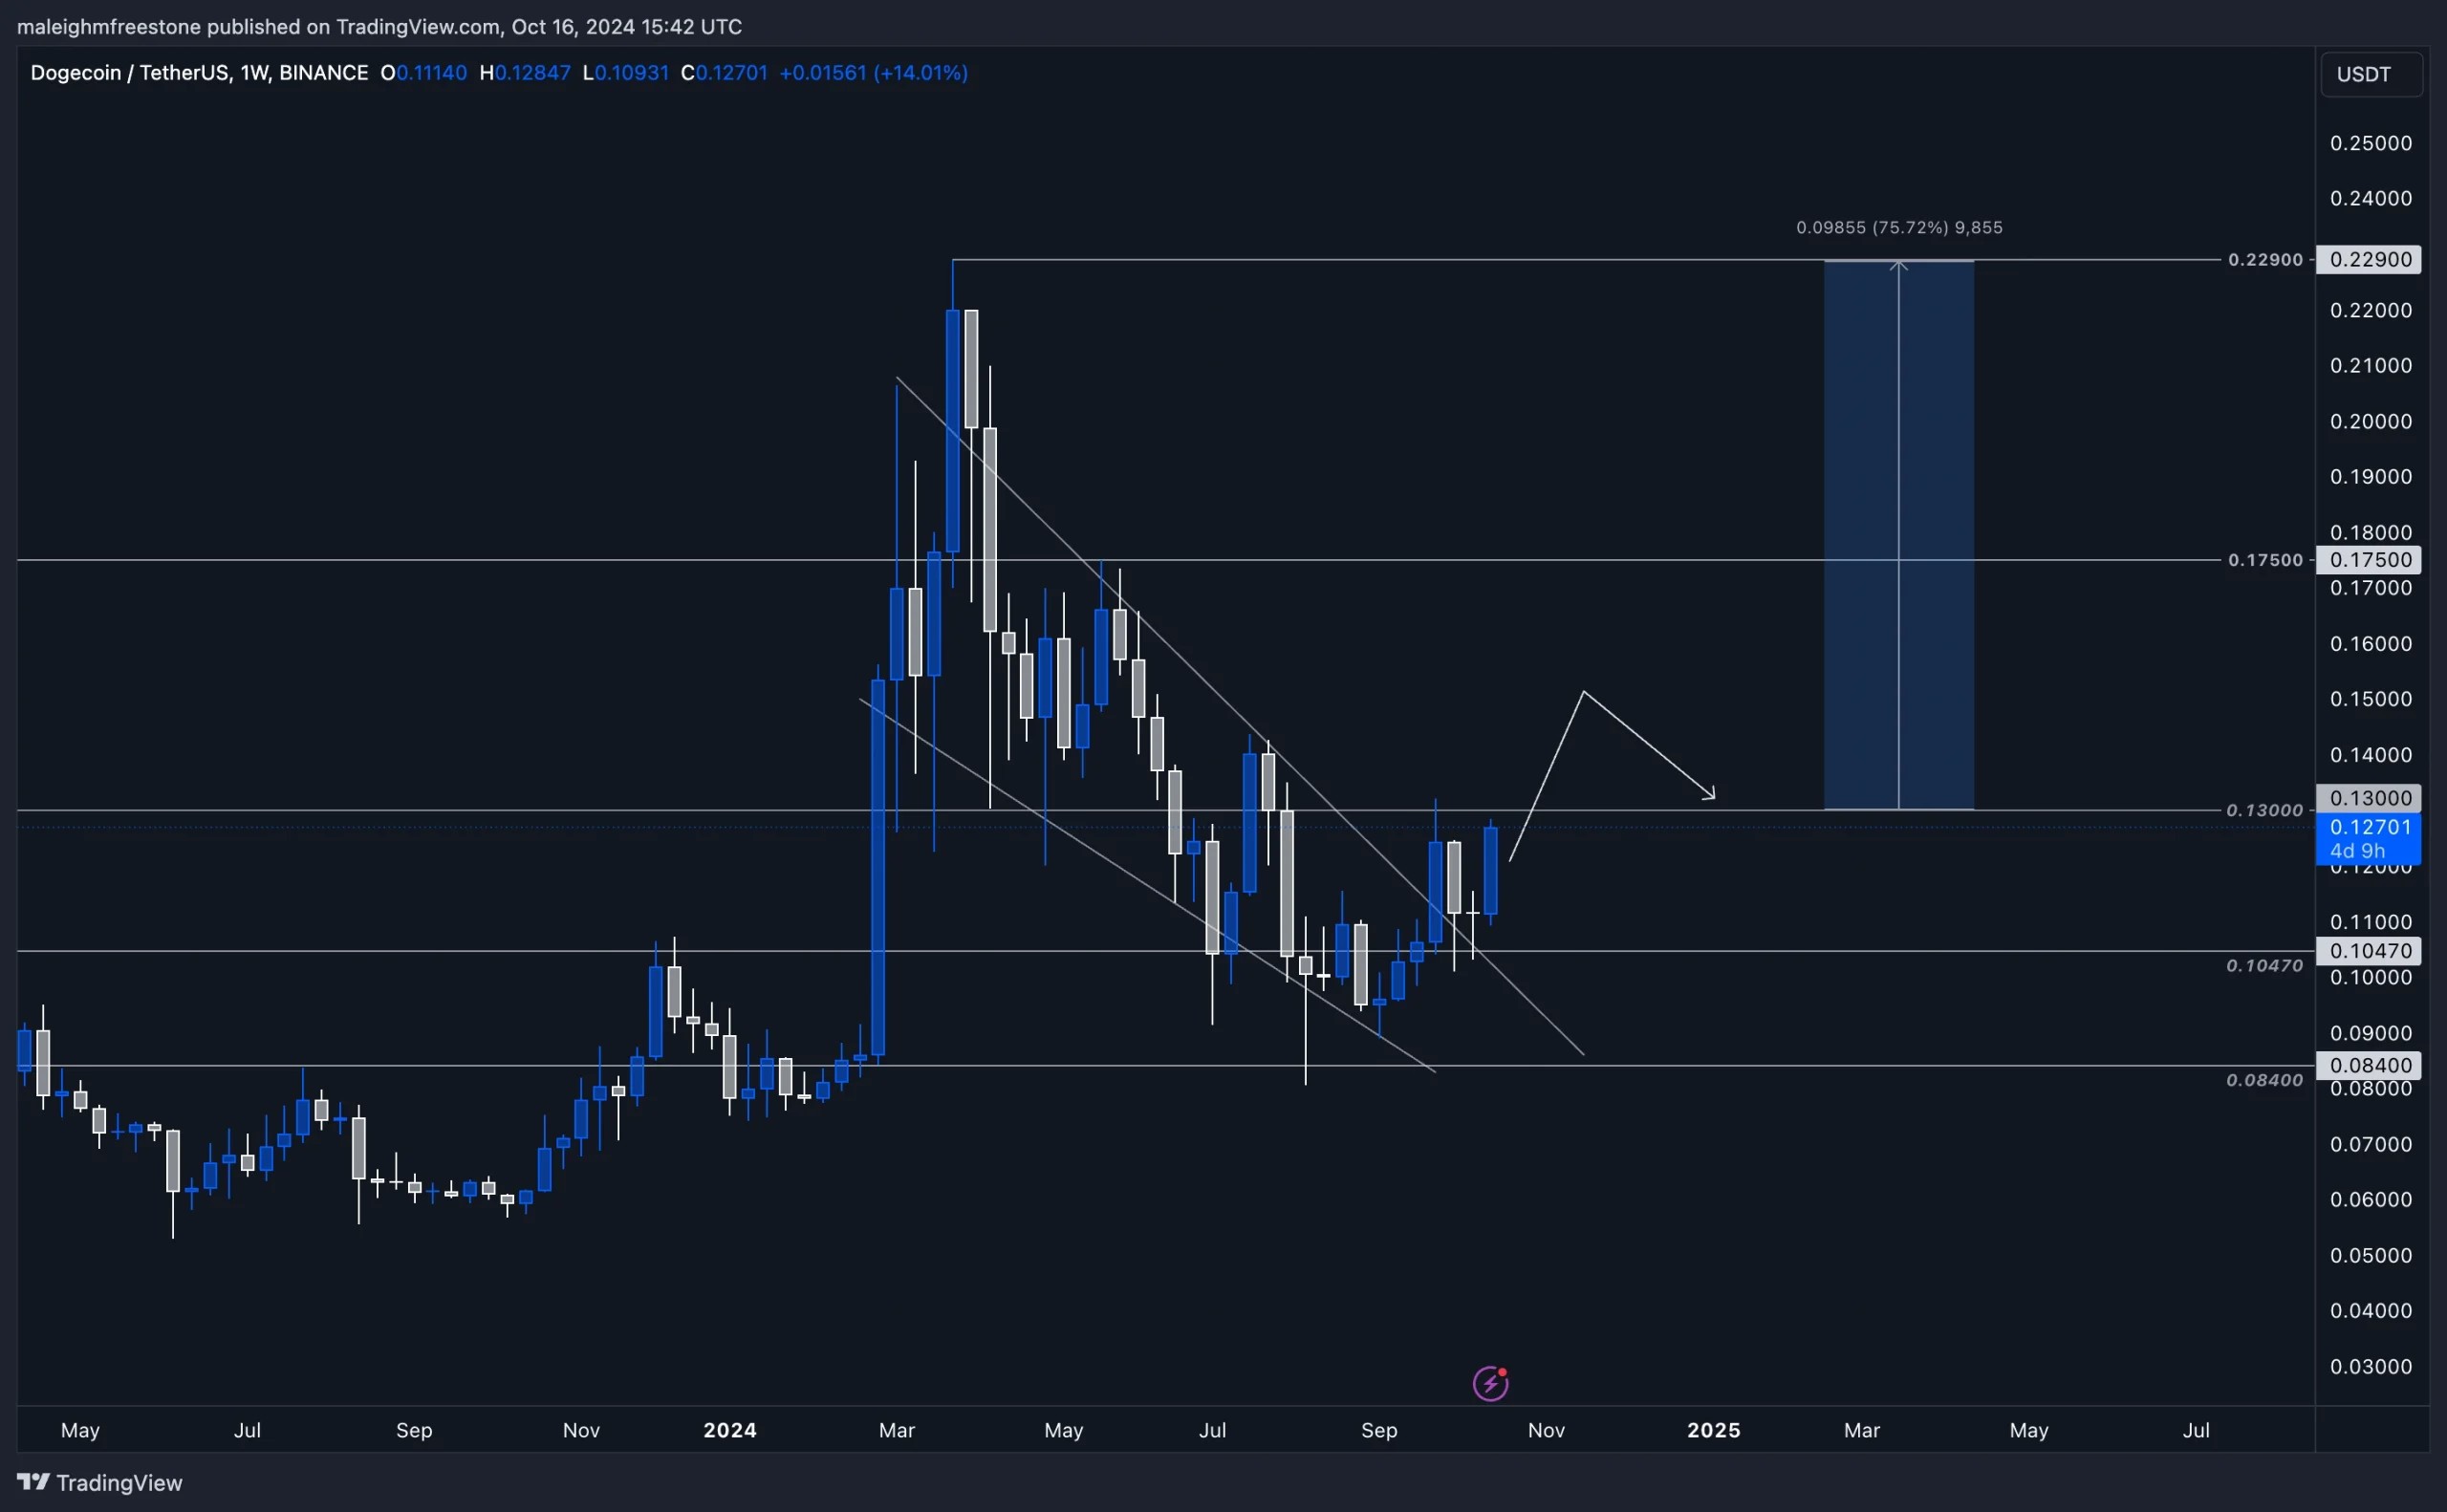
We've seen significant pressure building around the $0.13 level for Doge. On 23rd September, we observed a breakout, which indicates a potential shift in momentum. Breaking through this level is a critical point for Doge as we've also broken out of a downtrend line. The breakout on 23rd September held above the key level of $0.13, which has been an important support and resistance area in the past.Looking back at previous price action, we can see how Doge had to push through this level during prior moves, particularly back in March and before that. This gives us a strong indication that this breakout will be a bullish development, signalling potential further upside if we can sustain above this level.
Playbook
- If we maintain above $0.13, we could see further upside action. Bitcoin's momentum around the $68,000-$69,000 price point will be key in determining whether Doge and other similar assets break through their respective levels.
- Doge has a history of strong moves, such as the 175% move we saw earlier this year in Feb after breaking out. This makes Doge an asset worth watching closely in the current market conditions.
Key levels
- $0.13 (current critical level)
- $0.175 (next target if momentum continues)
Risk management
Given the strong historical price action around the $0.13 level, it's essential to remain cautious with leverage positions. Patience and a spot accumulation strategy could be a wise approach if you're looking to build exposure to Doge. Keep a close eye on Bitcoin's price action around the $68,000-$69,000 level, as it could drive Doge's next leg up.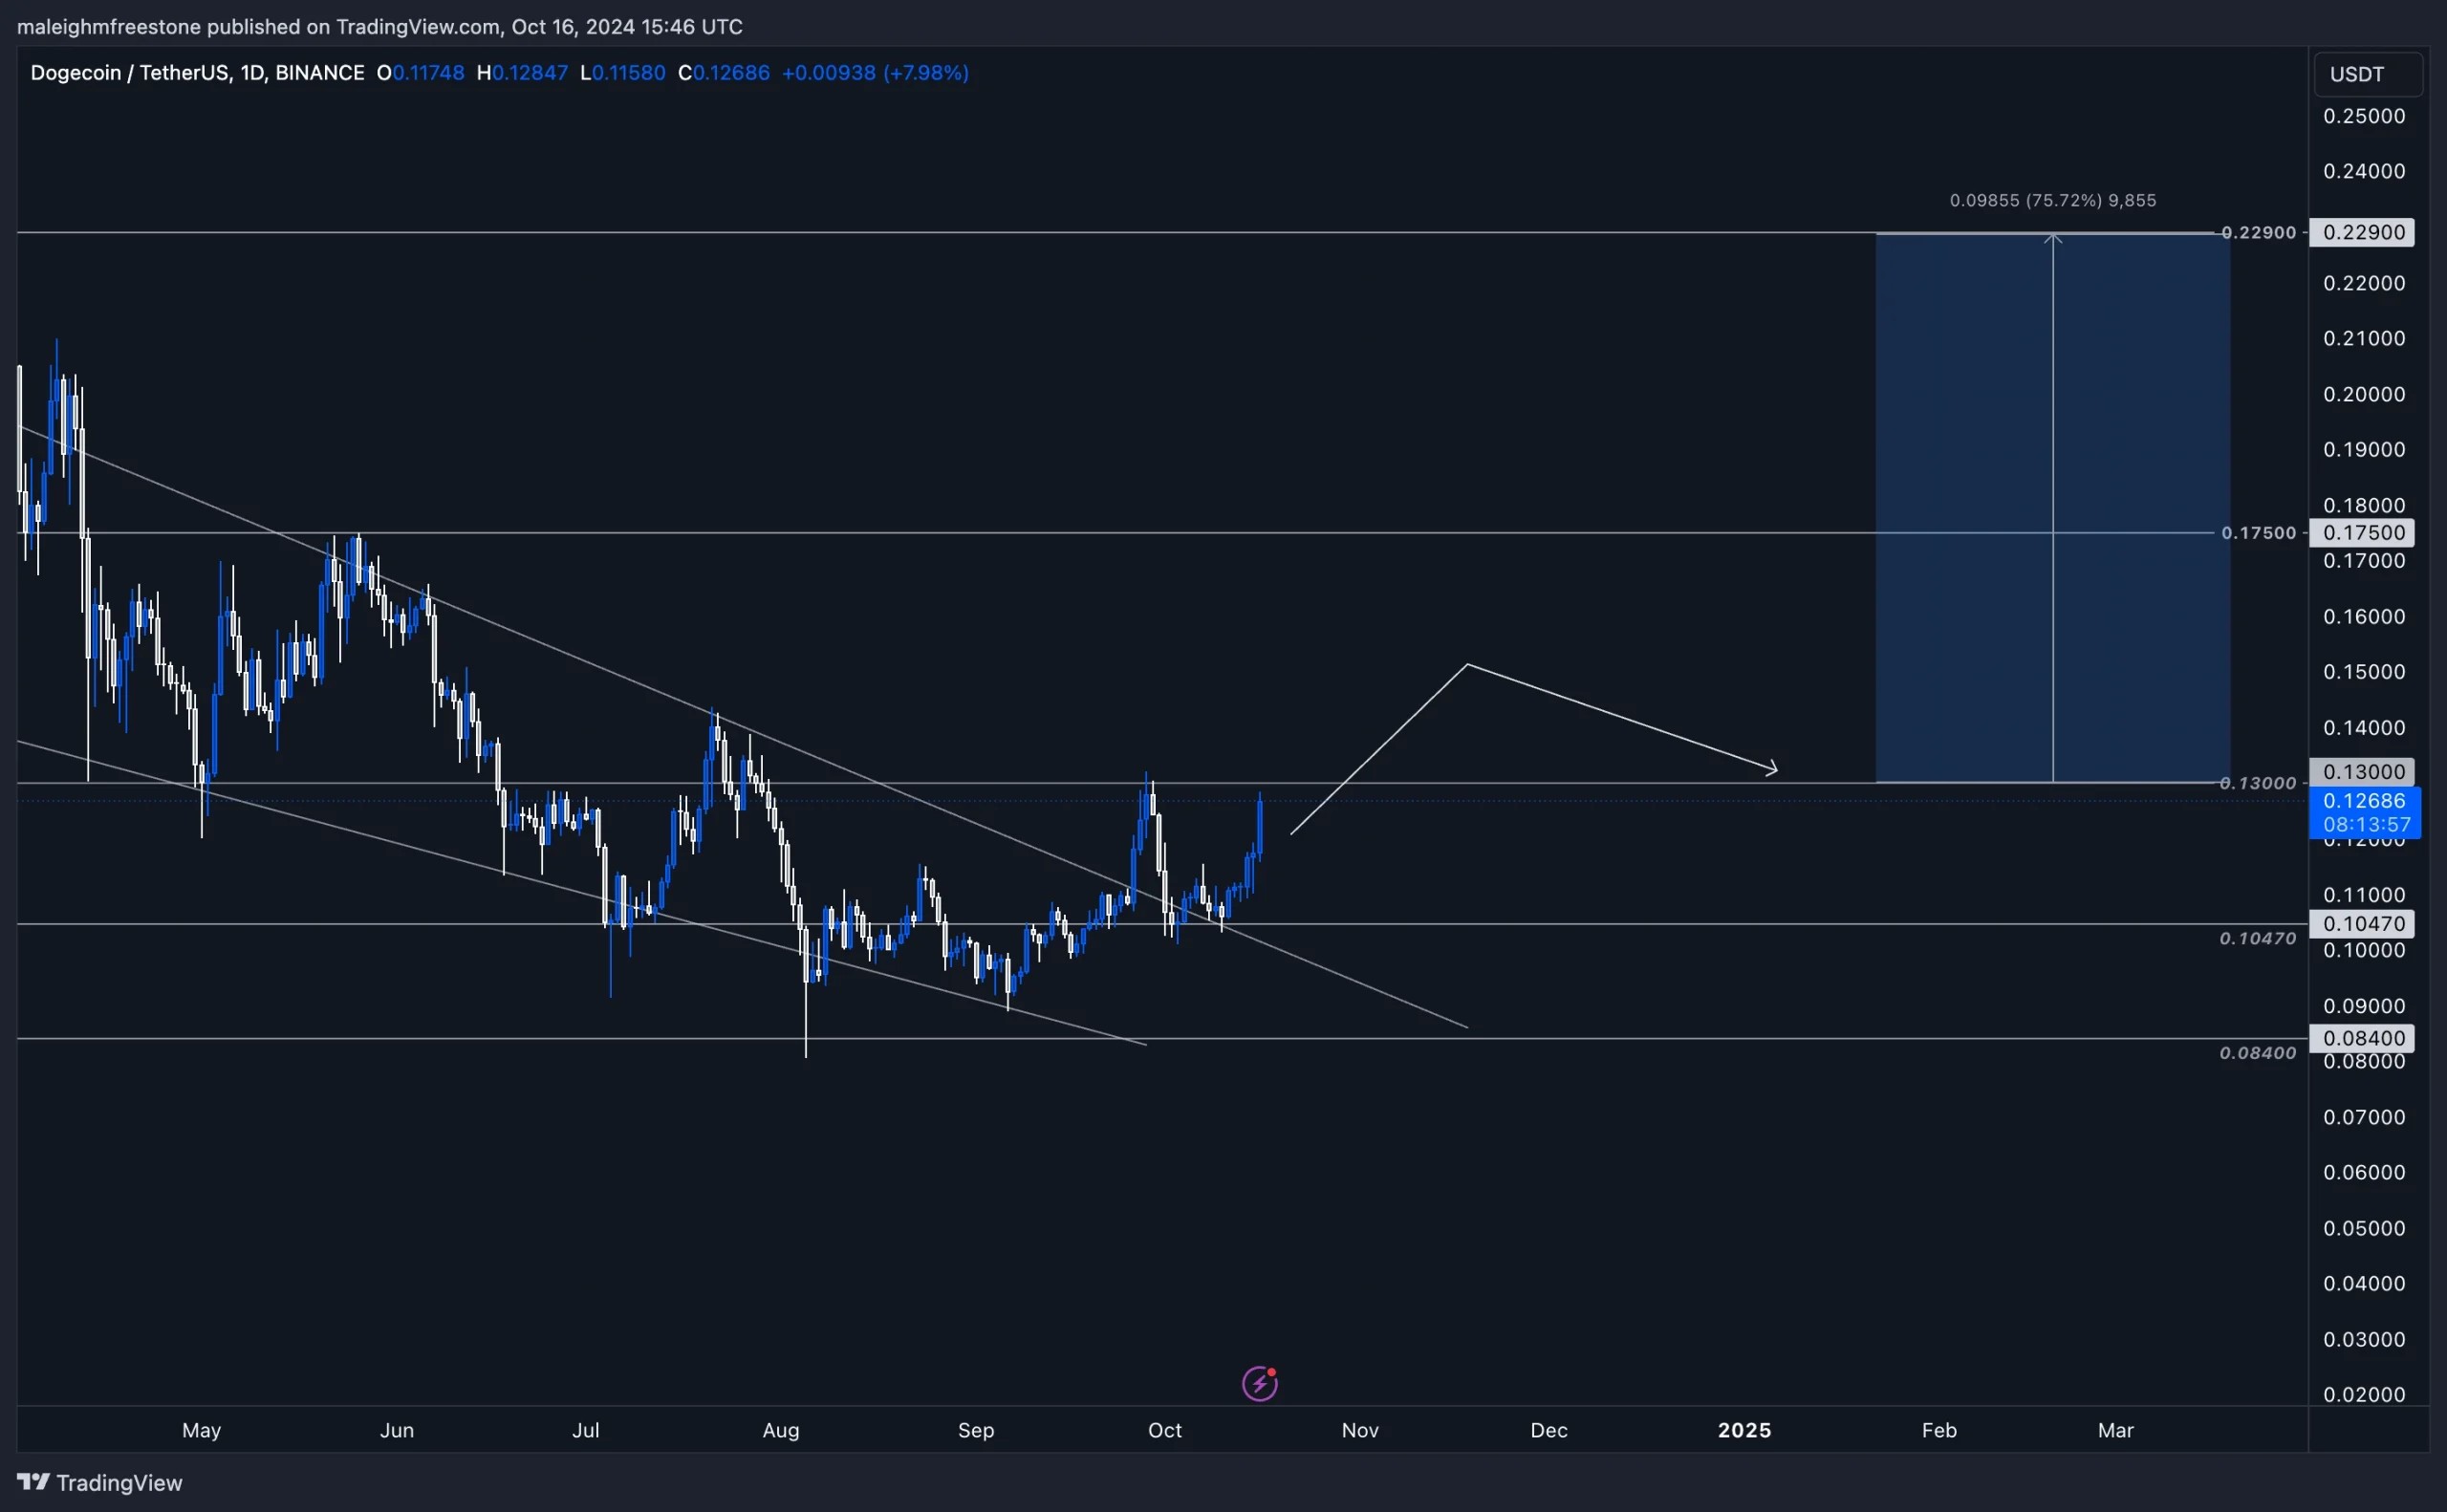
Cryptonary's take
Doge is in a pivotal moment. The breakout above $0.13 suggests potential for further gains, but it will largely depend on Bitcoin's ability to maintain momentum above its key levels. Doge has been a strong player before, and we may see it replicate its previous performance.Watch for continued strength above $0.13, with a potential move towards $0.175 in the near future. Stay patient and manage risk carefully, as this could be an opportunity for spot accumulation rather than leveraging too early.
Recommended from Cryptonary


