Save 23% ($351) & Get a Free 1-1 Call with our Team ⏰ : 0d 2h 59m 43s

Disclaimer: This is not financial or investment advice. You are responsible for any capital-related decisions you make, and only you are accountable for the results.
Jupiter:
Overview:
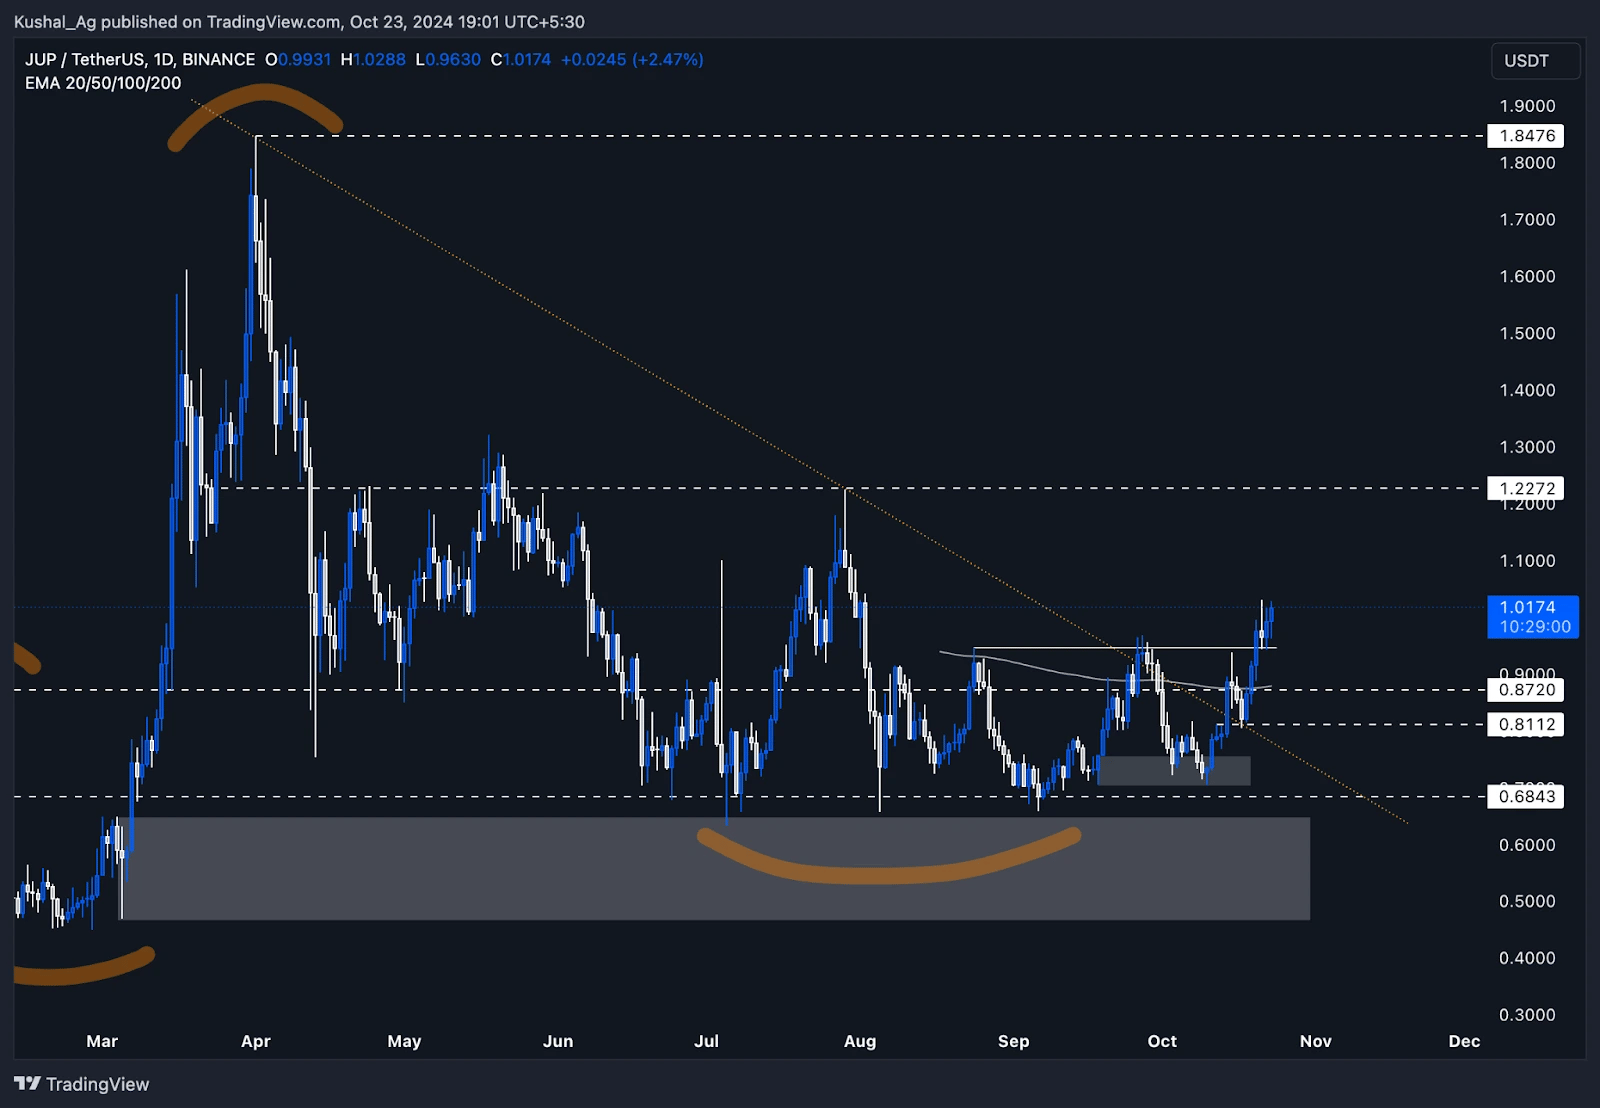
Jupiter ($JUP) has shown considerable strength since our last analysis when it was trading at $0.89 and facing resistance at the $0.94 level. Since then, the price has broken through this resistance level, and the key psychological resistance is now being tested at $1.This recent breakout indicates bullish momentum in the asset, especially as it establishes a base above the $0.94 support level. With the wider market also showing signs of strength, Jupiter's price action looks promising for further continuation in the medium term.
Current market outlook
During the daily timeframe, Jupiter demonstrated bullish momentum by breaking above the crucial $0.94 resistance, which now acts as a solid support zone. The next key resistance is the psychological $1 mark, which the price is currently battling.Holding above the $0.94 support level while consolidating at the $1 mark is a positive sign for Jupiter's short-term price action. If the asset can break above $1, it opens the door for a potential rally toward the next resistance at $1.22.
In the 4-hour timeframe, Jupiter attempts to form a base above the $0.94 level, which further solidifies the bullish sentiment. The ability to establish a support level here is crucial for maintaining upward momentum.
The key point to watch now is whether Jupiter can hold above the $0.94 level and push through the $1 psychological resistance, which would signal a continuation of the bullish trend.
Key levels
- Upside resistance:
- $1.00 (Psychological Resistance)
- $1.22 (Next Major Resistance Level)
- Downside support:
- First support: $0.94 (previous resistance turned support)
- Next support: $0.88 - $0.87 region, which aligns with the 200 EMA on the daily timeframe. This confluence between support and the 200 EMA makes it a strong area for potential buyers.
- Further support: $0.81 region, acting as a secondary support level if Jupyter fails to hold above $0.87.
Potential scenarios
- Bullish scenario:
- If Jupiter continues to sustain above the $0.94 level and breaks above the $1 psychological resistance, we could see a rally toward the $1.22 resistance level in the short to medium term.
- A confirmed close above the $1.22 level would open the door for further upside momentum and possibly higher targets in the long term.
- Bearish scenario:
- If Jupiter fails to hold above the $0.94 support, a pullback to the $0.87-$0.88 region is likely, with this zone providing a solid base due to its confluence with the 200 EMA on the daily timeframe.
- Should this support level break, the next strong support to watch will be the $0.81 region, which has historically acted as a strong base for price action.
Cryptonary's take
Jupiter ($JUP) has broken out from key resistance levels and is gaining momentum in the current market conditions. While the $1 psychological resistance poses a challenge, the bullish sentiment remains strong as long as the price sustains above the $0.94 support level.With the 200 EMA on the daily timeframe aligning with the $0.87 support zone, this area offers solid protection in the event of a pullback.
Given Jupiter's bullish structure and the potential for continued upside, it's worth monitoring the price action closely for either a breakout above $1 or a retest of lower support levels around $0.87. Although the asset looks strong, trade
Injective:
Daily timeframe analysis
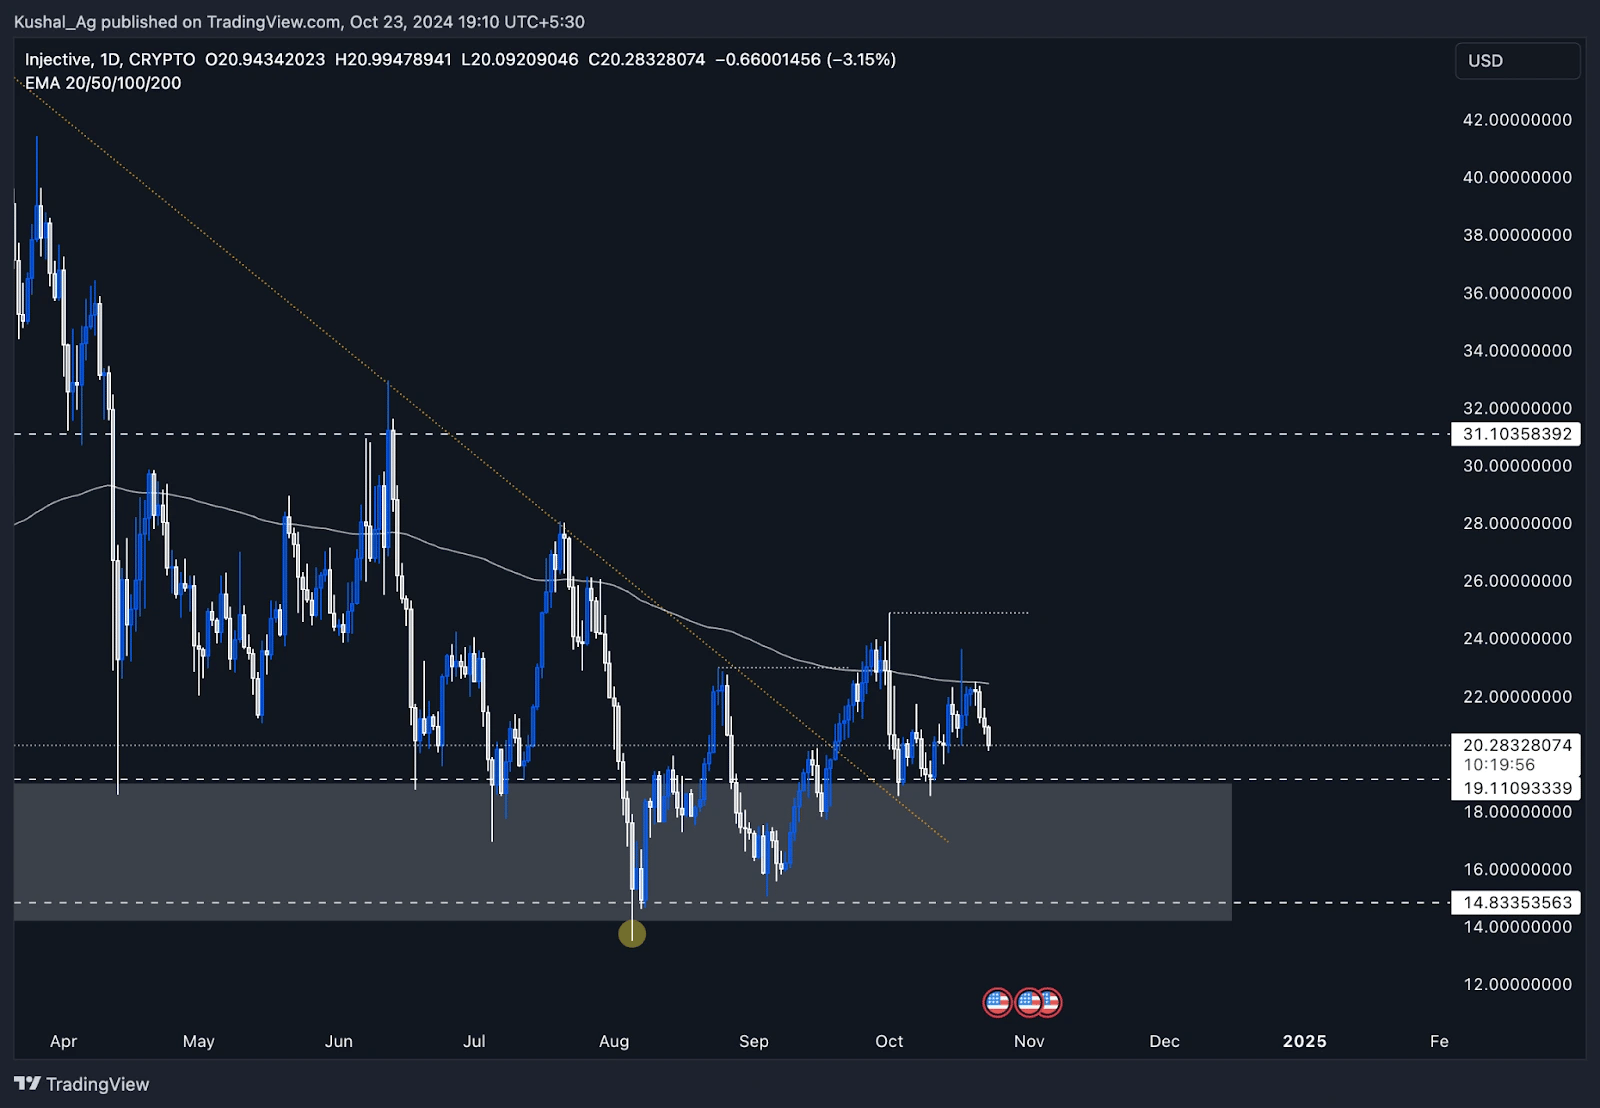
Injective ($INJ) is currently trading at $20.2 and struggling to break above the 200 EMA on the daily timeframe, which is sitting around $22.45. This EMA has acted as a strong resistance level, causing the price to squeeze into a tight range.Despite the rejection from the 200 EMA, Injective is still holding above the weekly demand zone, which ranges from $14.1 to $19.1. This demand zone has previously provided strong support for price action, making it a key level for potential accumulation and DCAs (Dollar-Cost Averaging) for traders.
Currently, INJ is experiencing consolidation, which aligns with the broader market trend, as many altcoins are also in a sideways phase. Although we are not seeing a strong bullish move yet, the fact that the price remains above this crucial demand zone shows there is still support for Injective in the market.
Key levels to watch
- Upside resistance:
- $22.45 (200 EMA on the daily) - This is the first key level that Injective needs to break to show any signs of bullish reversal.
- $24.8 - If the price breaks above the 200 EMA, this is the next major resistance level that could see injective testing at higher levels in the medium term.
- Downside support:
- $19.1 - This is the first major support level on the downside and the upper bound of the weekly demand zone.
- $14.1 - $19.1 - The entire weekly demand zone remains a strong area for accumulation, especially if the price pulls back further. Traders can look at this range for potential long positions if the wider market supports a bullish reversal.
Market outlook
At this stage, Injective is consolidating without showing any clear bullish divergence or momentum on the daily timeframe. However, as long as it continues to hold above the weekly demand zone, there is potential for upside once the price breaks through the 200 EMA.For now, it's a waiting game to see how Injective performs, especially if the broader market starts picking up momentum.
Cryptonary's take
Injective is in a crucial consolidation phase, and while it's struggling to break the 200 EMA, the support from the weekly demand zone is holding well. For those looking to accumulate, the weekly demand zone remains a strong area for long-term positioning.If the market sentiment turns bullish and Injective manages to break through the 200 EMA, we could see a rally toward $24.8 in the short term. However, patience is key, and traders should keep an eye on the broader market for signs of momentum before making any major moves.
Recommended from Cryptonary


