Save 23% ($351) & Get a Free 1-1 Call with our Team ⏰ : 0d 2h 59m 43s
Altcoins hold key support levels: breakouts await
Kaspa is currently holding near $0.13, while RUNE is testing the $3.3 mark. Both assets are getting close to important resistance levels, showing potential for a breakout soon. At the same time, LINK is testing $10, and OP is staying strong above $1.55, both hinting at possible upward moves.

Let's take a closer look at their price action.
Disclaimer: This is not financial or investment advice. You are responsible for any capital-related decisions you make, and only you are accountable for the results.
KASPA:
Market context
Kaspa has been one of the strongest assets this cycle in terms of structure, consistently respecting higher highs and higher lows. The 0.13 price point is the significant level in play, with the highs at 0.189 acting as resistance.We've seen consistent buying pressure around 0.13, where buyers have stepped in multiple times, making this a key area for accumulation. On the 6th of October and the 29th of September, spikes in open interest and funding rates led to some sell-offs.
Despite this, the positive funding rate during those periods indicated that buyers were still interested in accumulating Kaspa with leverage (risk on), which shows strong interest in the asset on the buy side. Now that the price is trading around 0.13 and the funding rate and open interest have reset to healthier levels, we could expect more bids to come in at this key level.
Historically, this level has shown strong buying activity, including a significant recovery on the 5th of August after a drastic sell-off, where Kaspa rebounded with a bullish candlestick that saw a 30% move. This is not an asset we're invested in, but its structure and price action make it one to watch, and with many requests on Kaspa, it's worth covering. The significant selling pressure at the 0.189 level suggests a key resistance zone that, if broken, could lead to significant upside.

Liquidation heat map
Over the last 3 months, there has been a significant build-up of short positions above the 0.18 level. This suggests that if Kaspa can break out above this price point, we could see a short squeeze, which would push the price higher. The 0.189 level is particularly key, as it has seen heavy selling pressure. If this level is cleared, it's likely we'll see a swift move upwards.
Weighted funding rate
Positive funding rate spikes on the 6th of October and 29th of September show that buyers were actively bidding on Kaspa with leverage. The current reset of the funding rate suggests a healthier state for fresh bids to come in.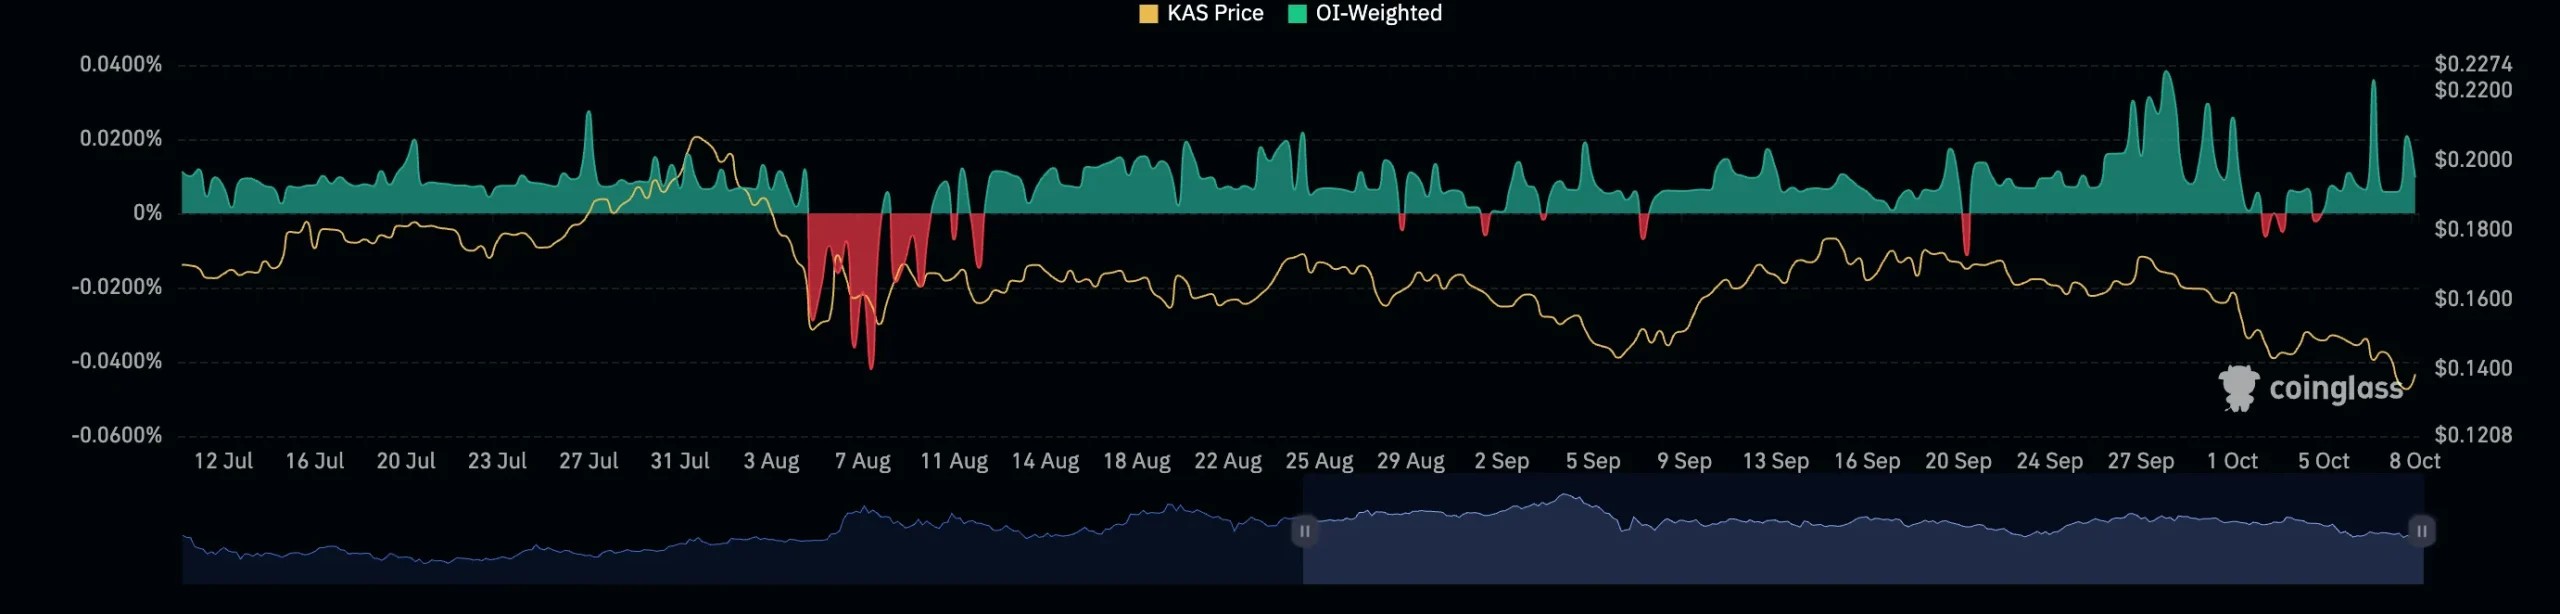
Open interest
During the sell-offs, open interest spiked, showing significant activity from both buyers and sellers. Now, with open interest resetting, it's likely we'll see more buying pressure at the 0.13 level.
Playbook
Key levels
- Support: 0.13
- Resistance: 0.189
- Long-term target: 0.3 (with potential upside after 0.189)
Spot setup
Kaspa is currently range-bound between 0.13 and 0.189. Accumulating around 0.13 provides a solid opportunity, with the potential for a breakout above 0.189 to target 0.3. If Kaspa can reclaim 0.189 and break into price discovery, we will likely see a move to these levels when BTC begins to gain more traction towards November, especially considering the build-up of short positions above 0.18.Risk management
The key is to accumulate around 0.13. If this level fails, it's a signal to reassess. A breakout above 0.189 would provide the confirmation needed for a larger bullish move. Failure to break 0.189 could result in more sideways action or a retrace.Market sentiment
Kaspa has shown strong buying pressure at key levels, and with the funding rate and open interest resetting, this is a healthy zone for accumulation. The potential for a short squeeze to short term liquidation levels on the 48 hour above 0.15, combined with bullish market structure, makes this asset one to keep an eye on, even if we aren't currently positioned in it.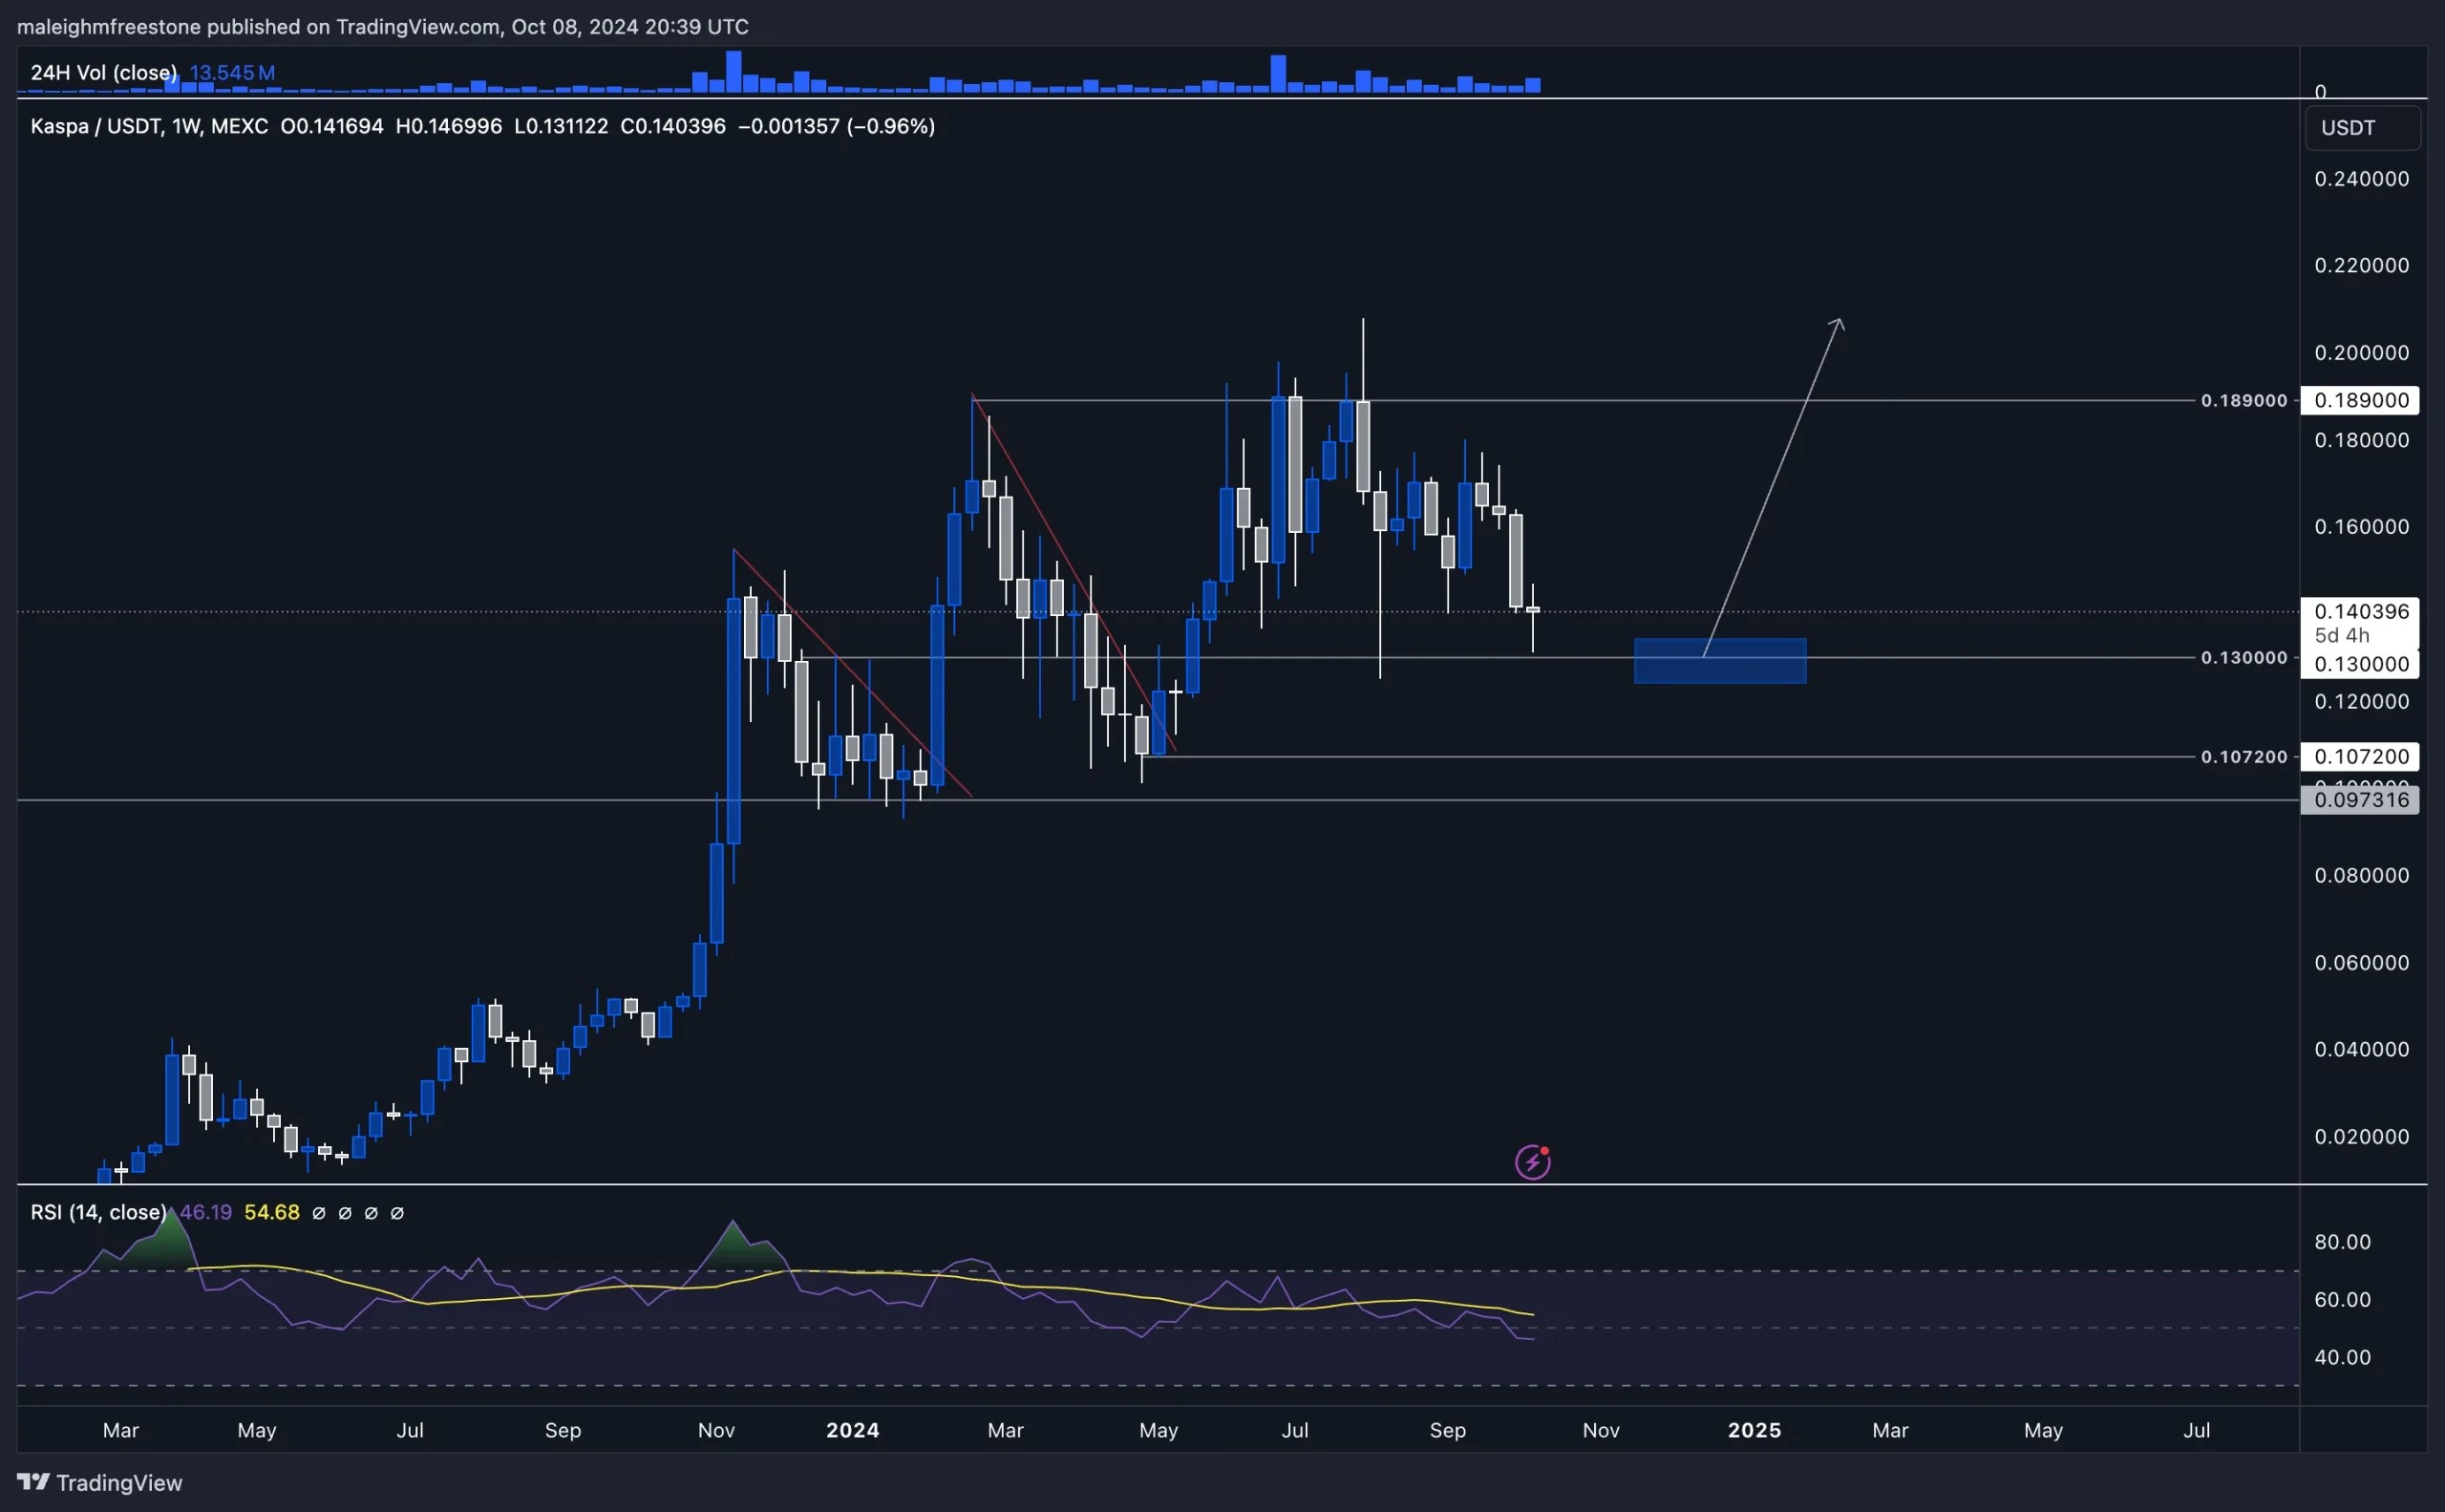
Cryptonary's take
Kaspa's price action is showing solid strength. With key levels at 0.13 and 0.189 in play, this is a strong accumulation zone. A breakout above 0.189 would signal a major shift, with the potential to target the highs and beyond. This is one to watch closely for the next move, as the asset is well-positioned for upside, provided it can break key resistance.RUNE:
Market context
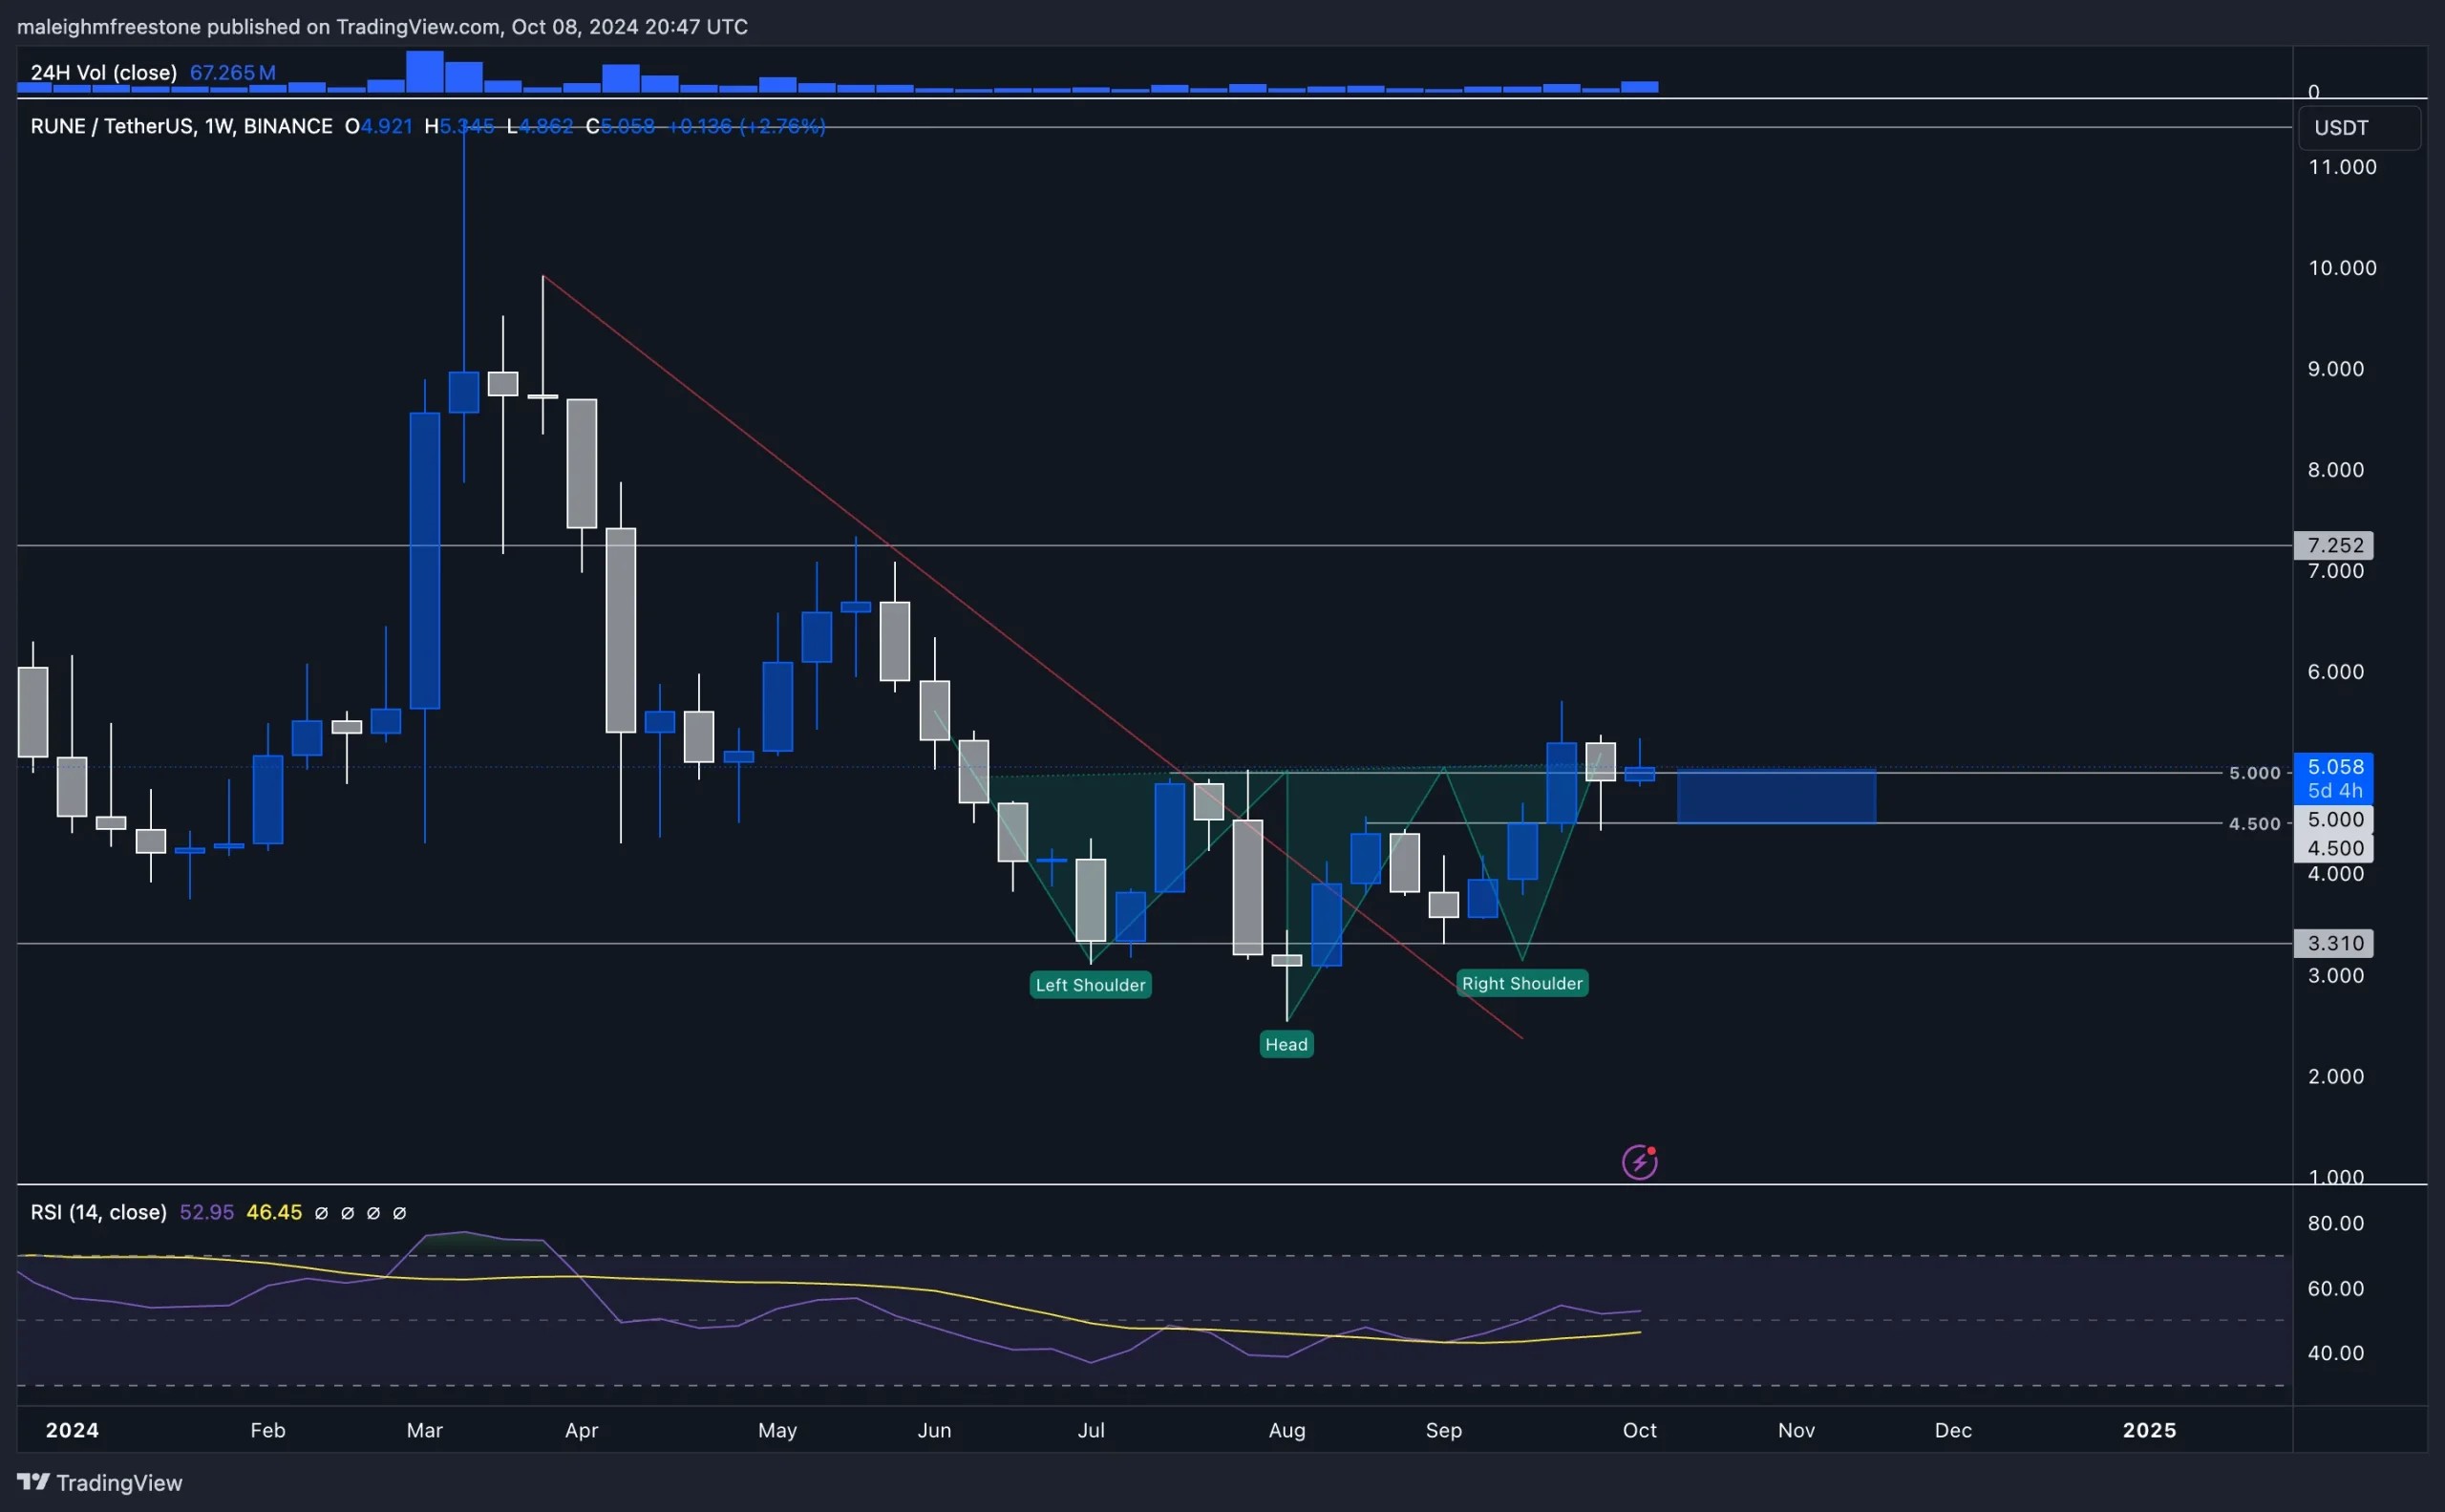
RUNE is an asset we've been watching closely, especially after the live video session with Abro, where we analyzed the significance of head and shoulder patterns. What we noticed during the live is that both a head and shoulders and an inverted head and shoulders have formed on RUNE.Since the 20th of May, when RUNE sold off from $7, it has been in a bearish structure. We set a swing low into the $3.3 price point, a swing high around $5, and then another swing low down to $2.5, forming the head of the head and shoulders pattern. The right shoulder formed around the $3.3 price point, which was again well-respected.
From there, RUNE bounced up over 75%, reclaiming key psychological levels at $4.5 and $5. These price points have been significant in previous price action, as seen with the buying pressure back in early March and around April. The fact that we are reclaiming these levels suggests that RUNE may be poised for a sharp move back toward $7.2.
If we break through that level, the next key target will be the highs around $11. Based on what we've discussed in the live session, this head and shoulders pattern represents a potential reversal, offering a key opportunity for a move to the upside.
With bullish momentum expected to return to the markets in November, this could present a strong setup to take advantage of, especially as capital flows increase. RUNE remains part of our C-Pro Picks, as it has strong fundamental utility and a solid community backing it.
Playbook
Key levels
- Support: $3.3
- Resistance: $4.5, $5, $7.2
- Mid-term target: $11
Trading setup
The $3.3 level has proven to be a key zone for accumulation, with prices bouncing 75% from this region. As RUNE continues to reclaim levels, a move up to $7.2 becomes more likely. Accumulating within the $4.5 and $5 range would position you for potential upside if we break through $7.2, with the next target being the $11 region.Risk management
The main area to watch is the $3.3 support zone. If this level fails, we'll need to reassess the structure. However, holding above this zone, with a reclaim of $5, provides a clear path toward $7.2 and possibly $11. Any pullbacks into the $4.5-$5 range could present a buying opportunity.Market sentiment
With strong buying pressure seen around key levels and the potential for capital flow to increase in Q4, RUNE is well-positioned for a bullish reversal. This head and shoulders pattern, combined with the broader market sentiment, sets RUNE up for a potential move to $7.2 and beyond.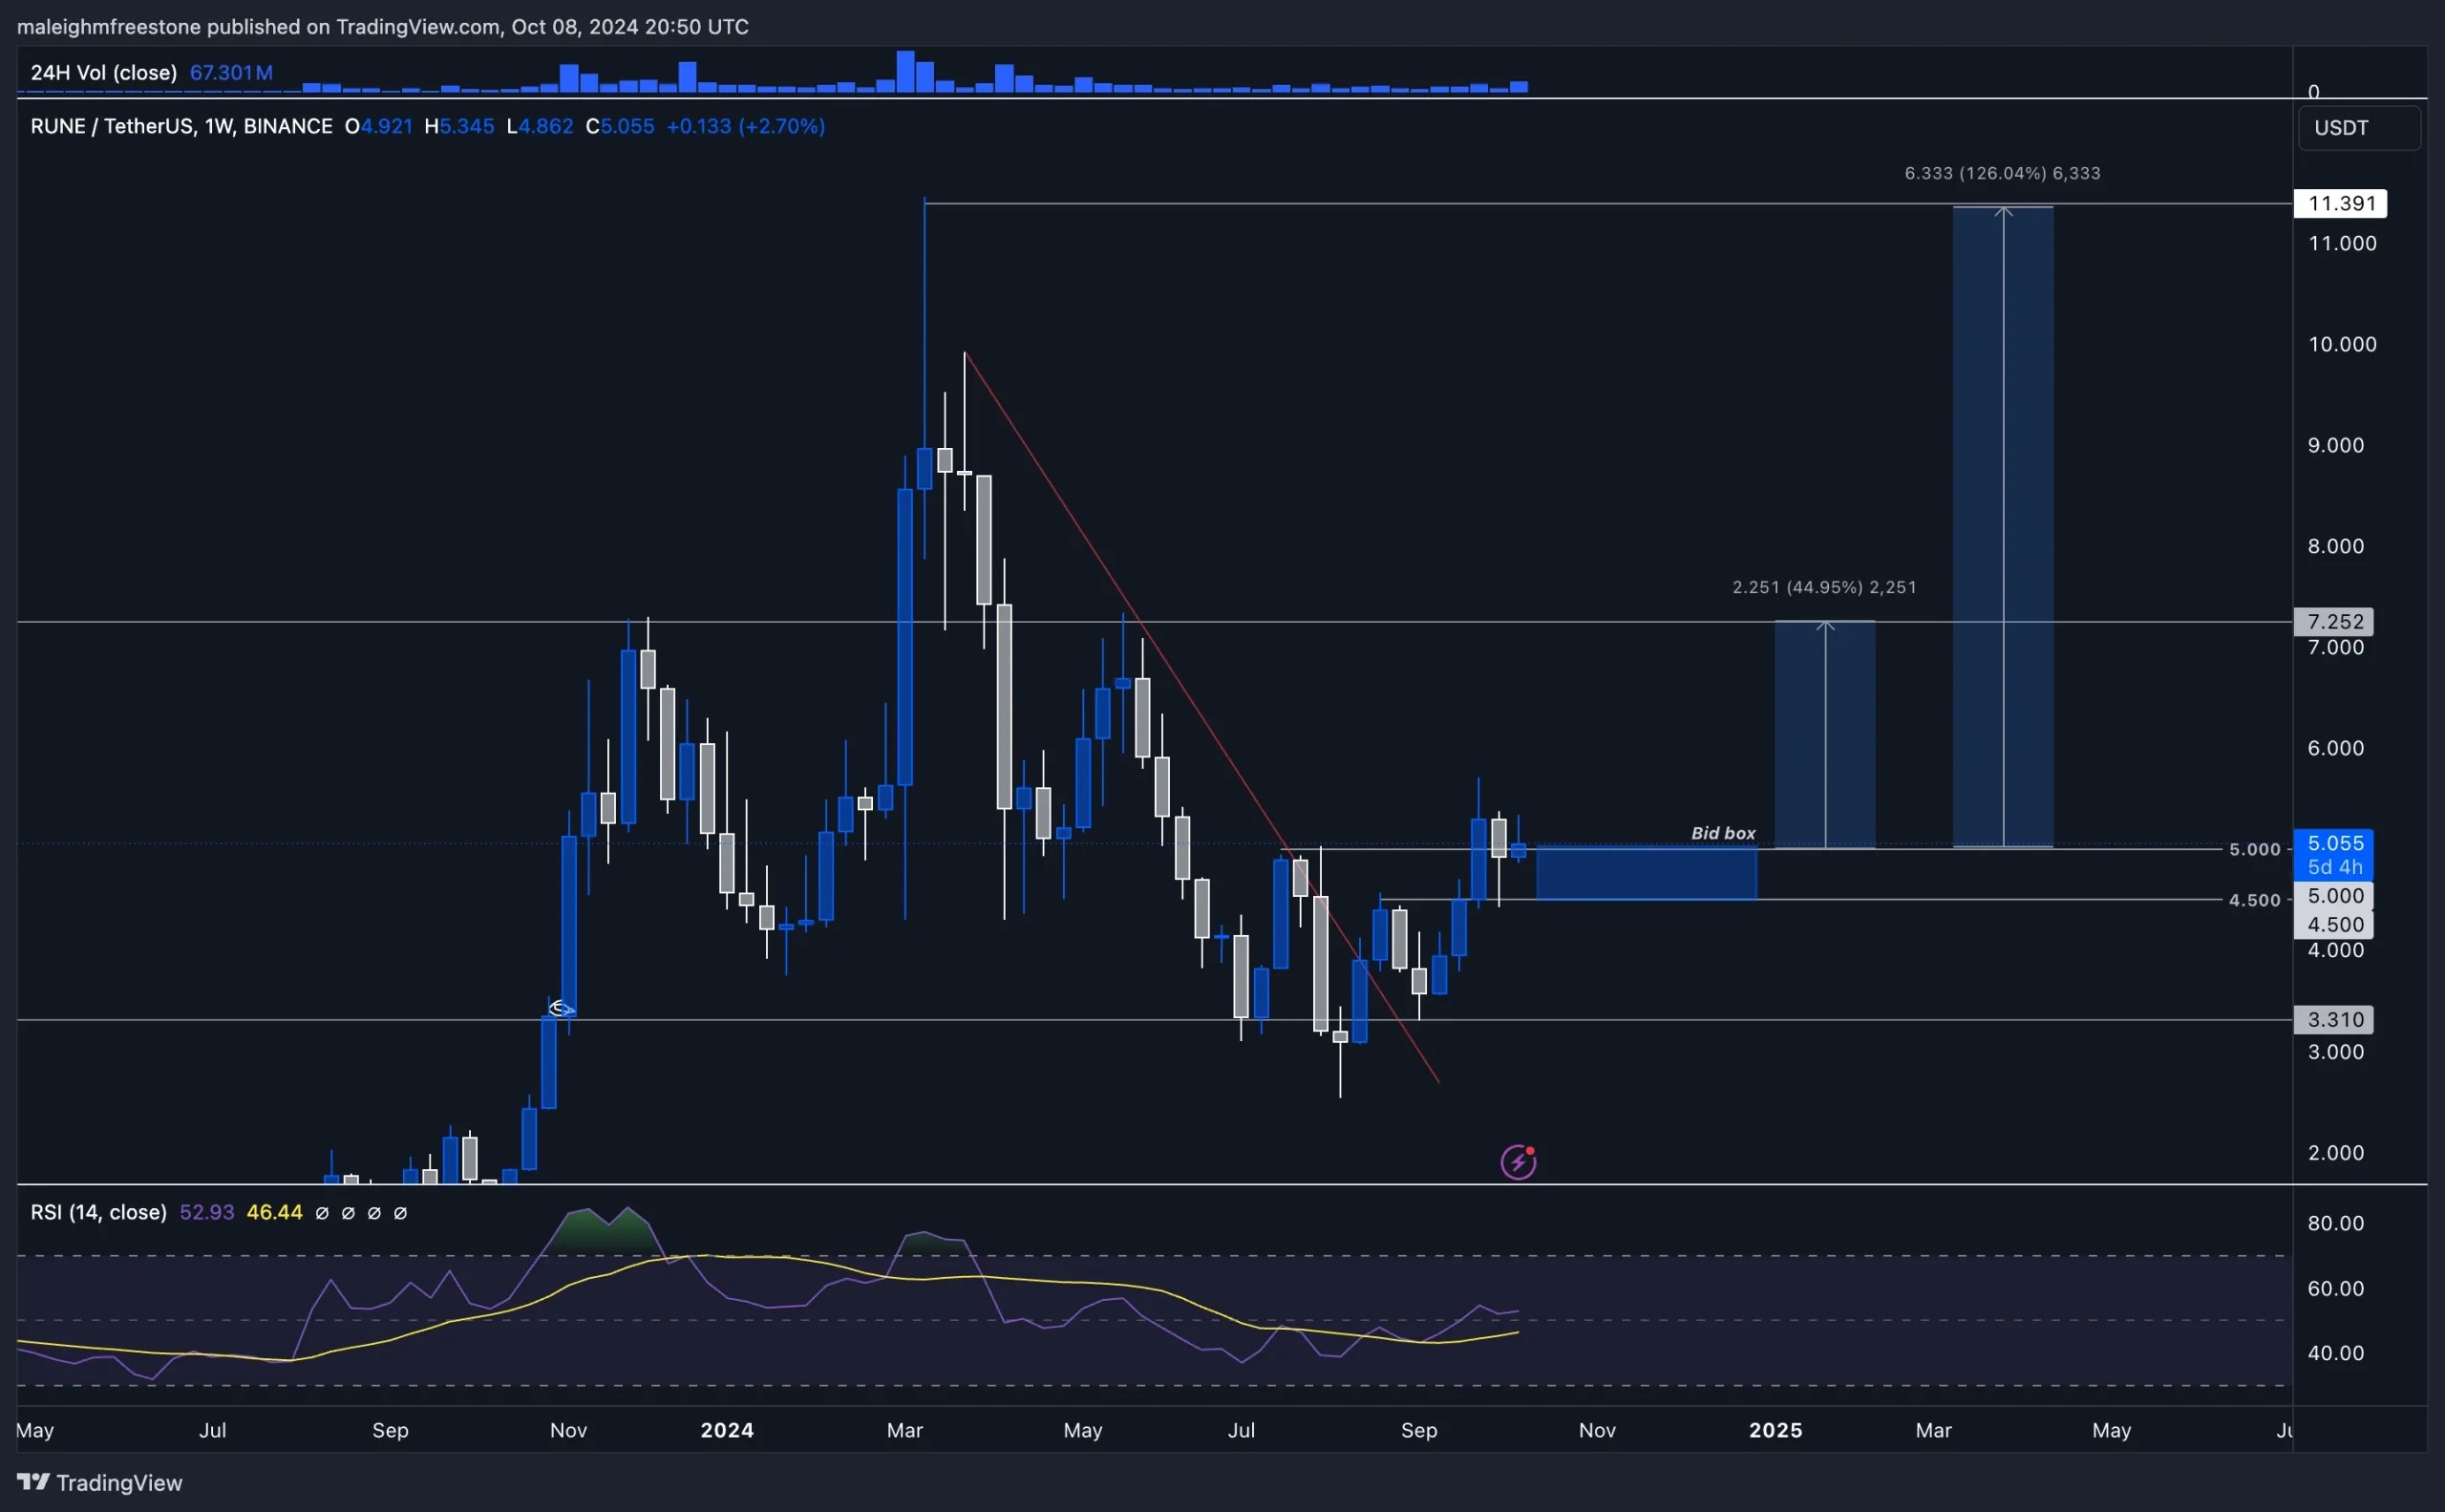
Cryptonary's take
RUNE is showing strong signs of a potential reversal, with key levels like $3.3, $4.5, and $5 being reclaimed. A breakout above $7.2 would provide confirmation for further upside, with $11 as the next target. The asset is part of our C-Pro Picks due to its strong fundamentals and dedicated community, making this a potential opportunity to capitalize on the upcoming bullish momentum as discussed on the Tom & Asads live.LINK:
Market context
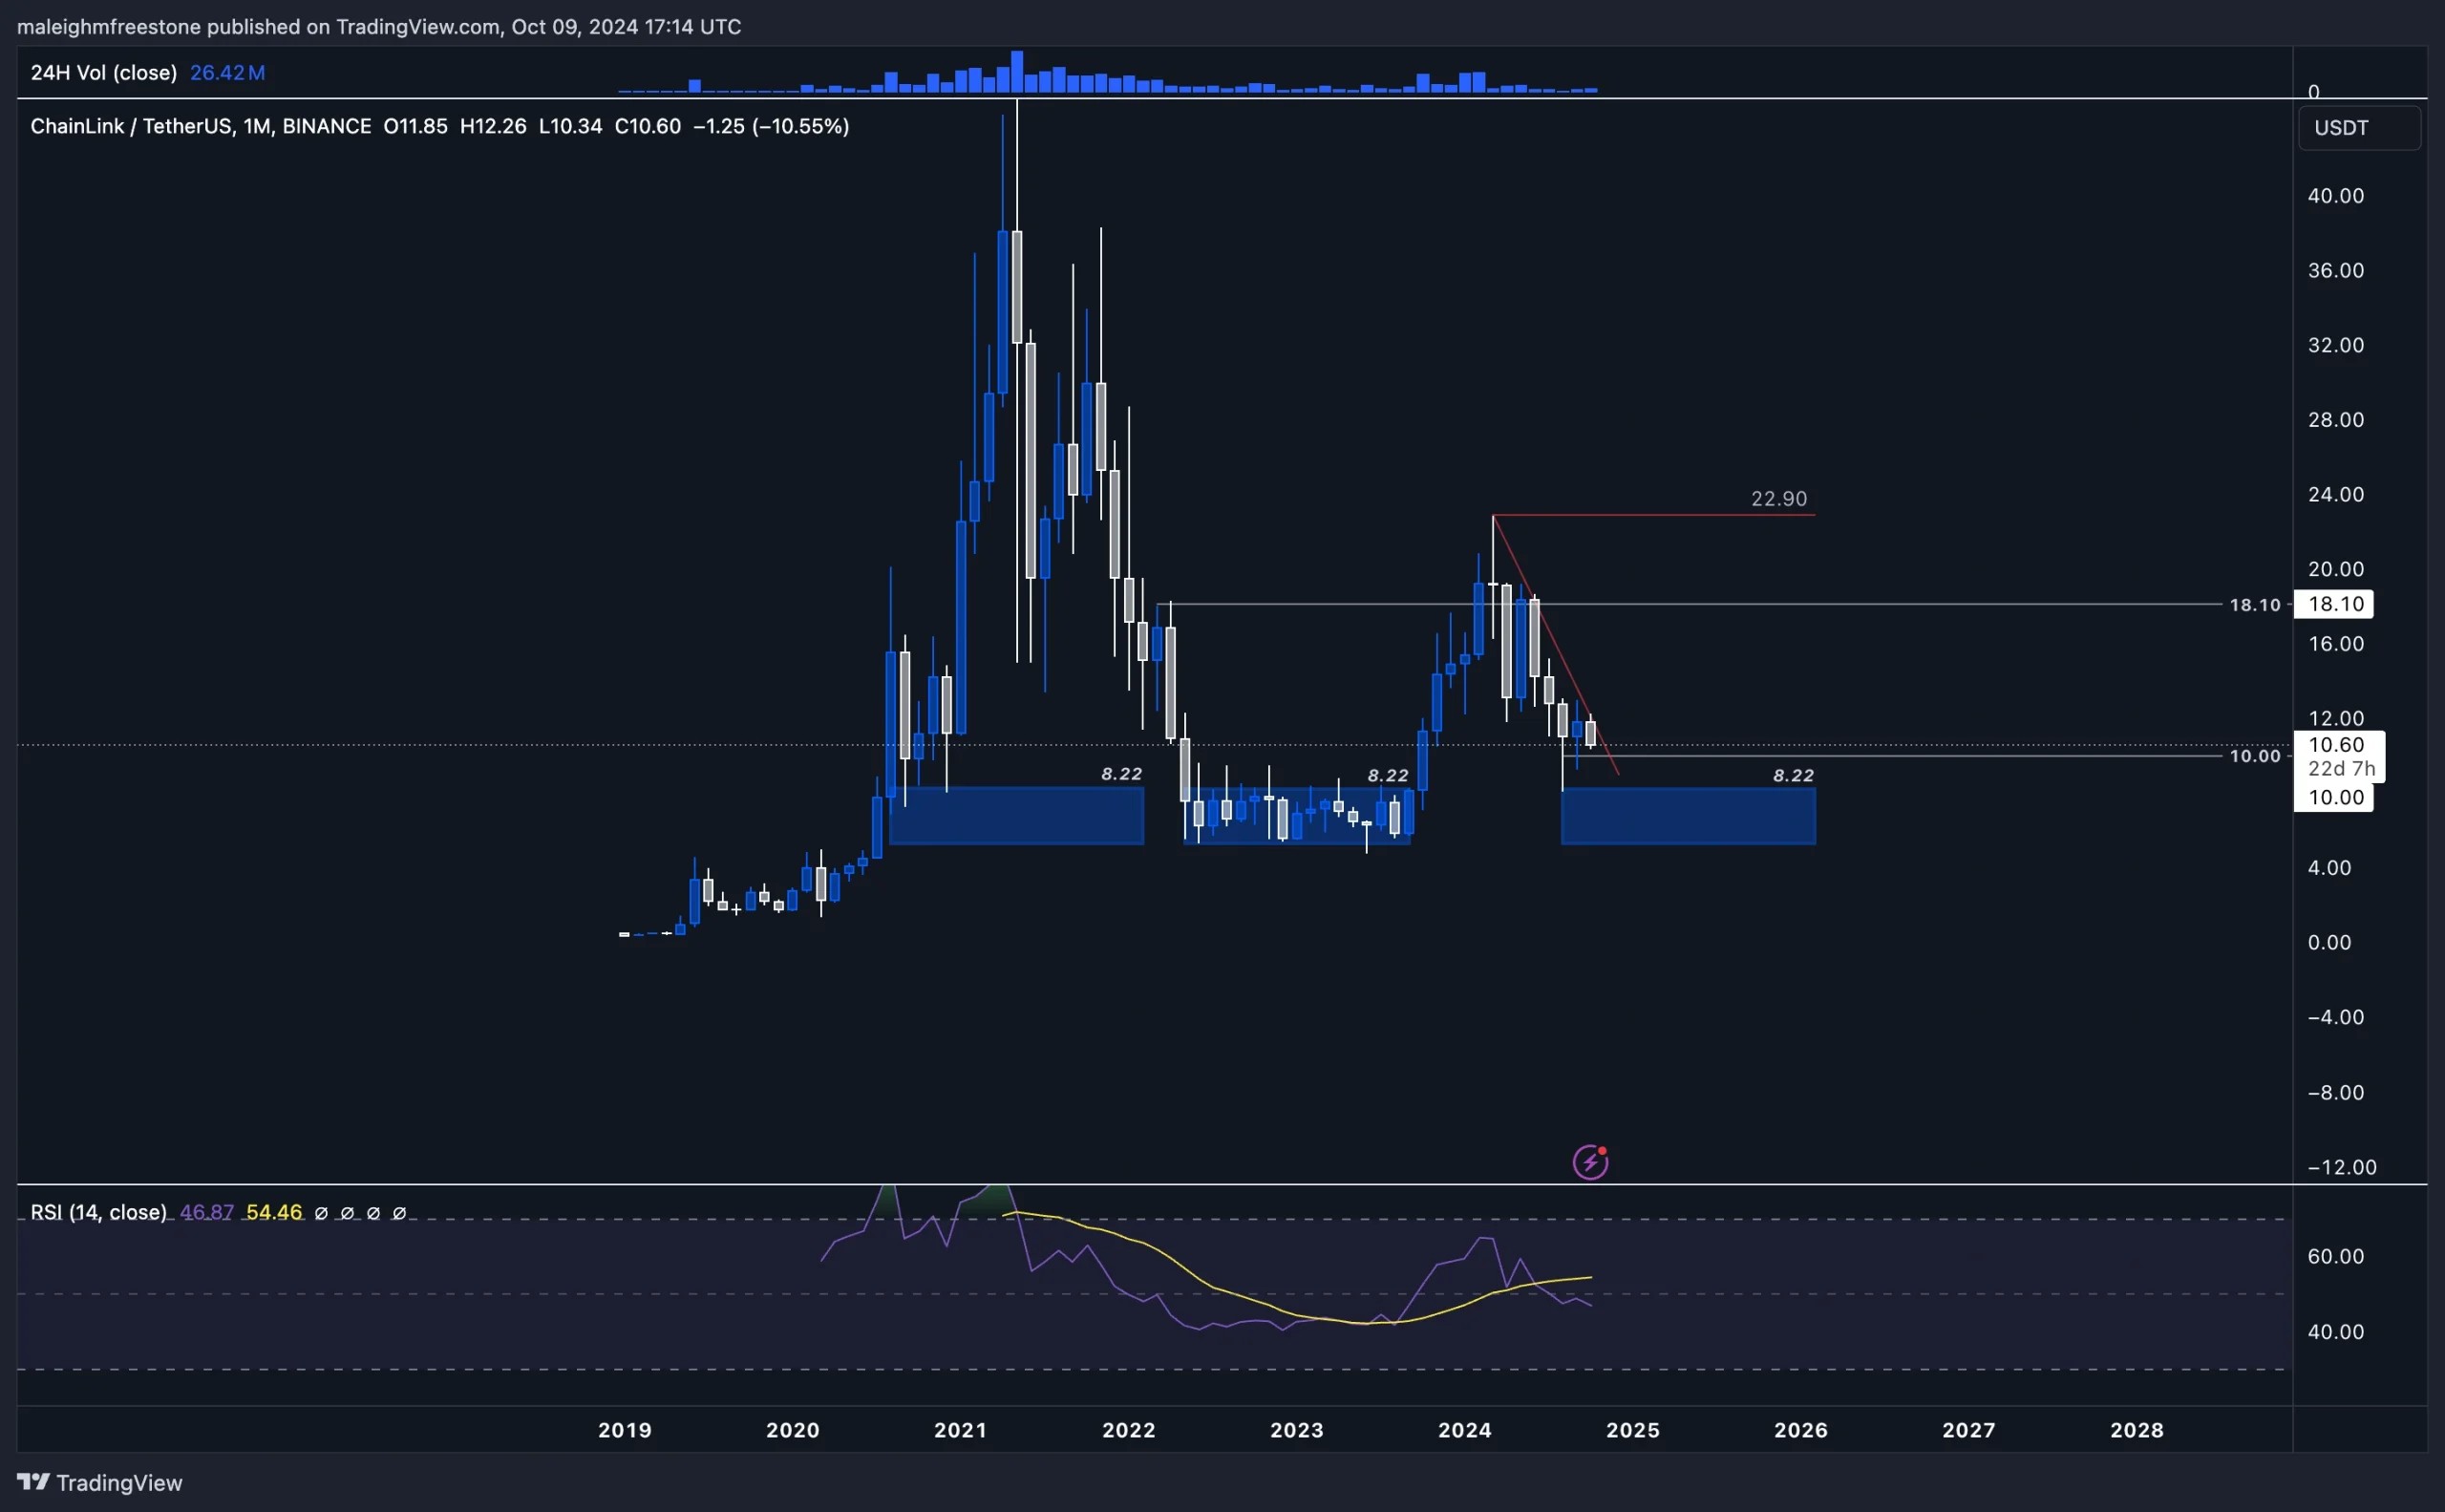
When we look at LINK on the monthly timeframe, the $8.22 price point stands out as a key level. Back in December 2020, we saw the price wick down to this level before setting off on a parabolic bull run. Since then, this area has remained significant, with prices consolidating above it for over 500 days during the 2023 and late 2022 bull market, acting as resistance.In October of last year, we broke out from this zone, with prices swinging 170% up to $22.90 as bullish momentum returned to the market. More recently, we've seen prices return to this level on the 1st of October and the 1st of August 2024, which is quite interesting. The formation of a shooting star candlestick on the monthly suggests buying pressure is still present, similar to the pattern we saw back in 2020.
Buyers have been holding prices up at this level, creating a potential magnetization zone, but we're now seeing a strong bearish candle on the monthly timeframe.
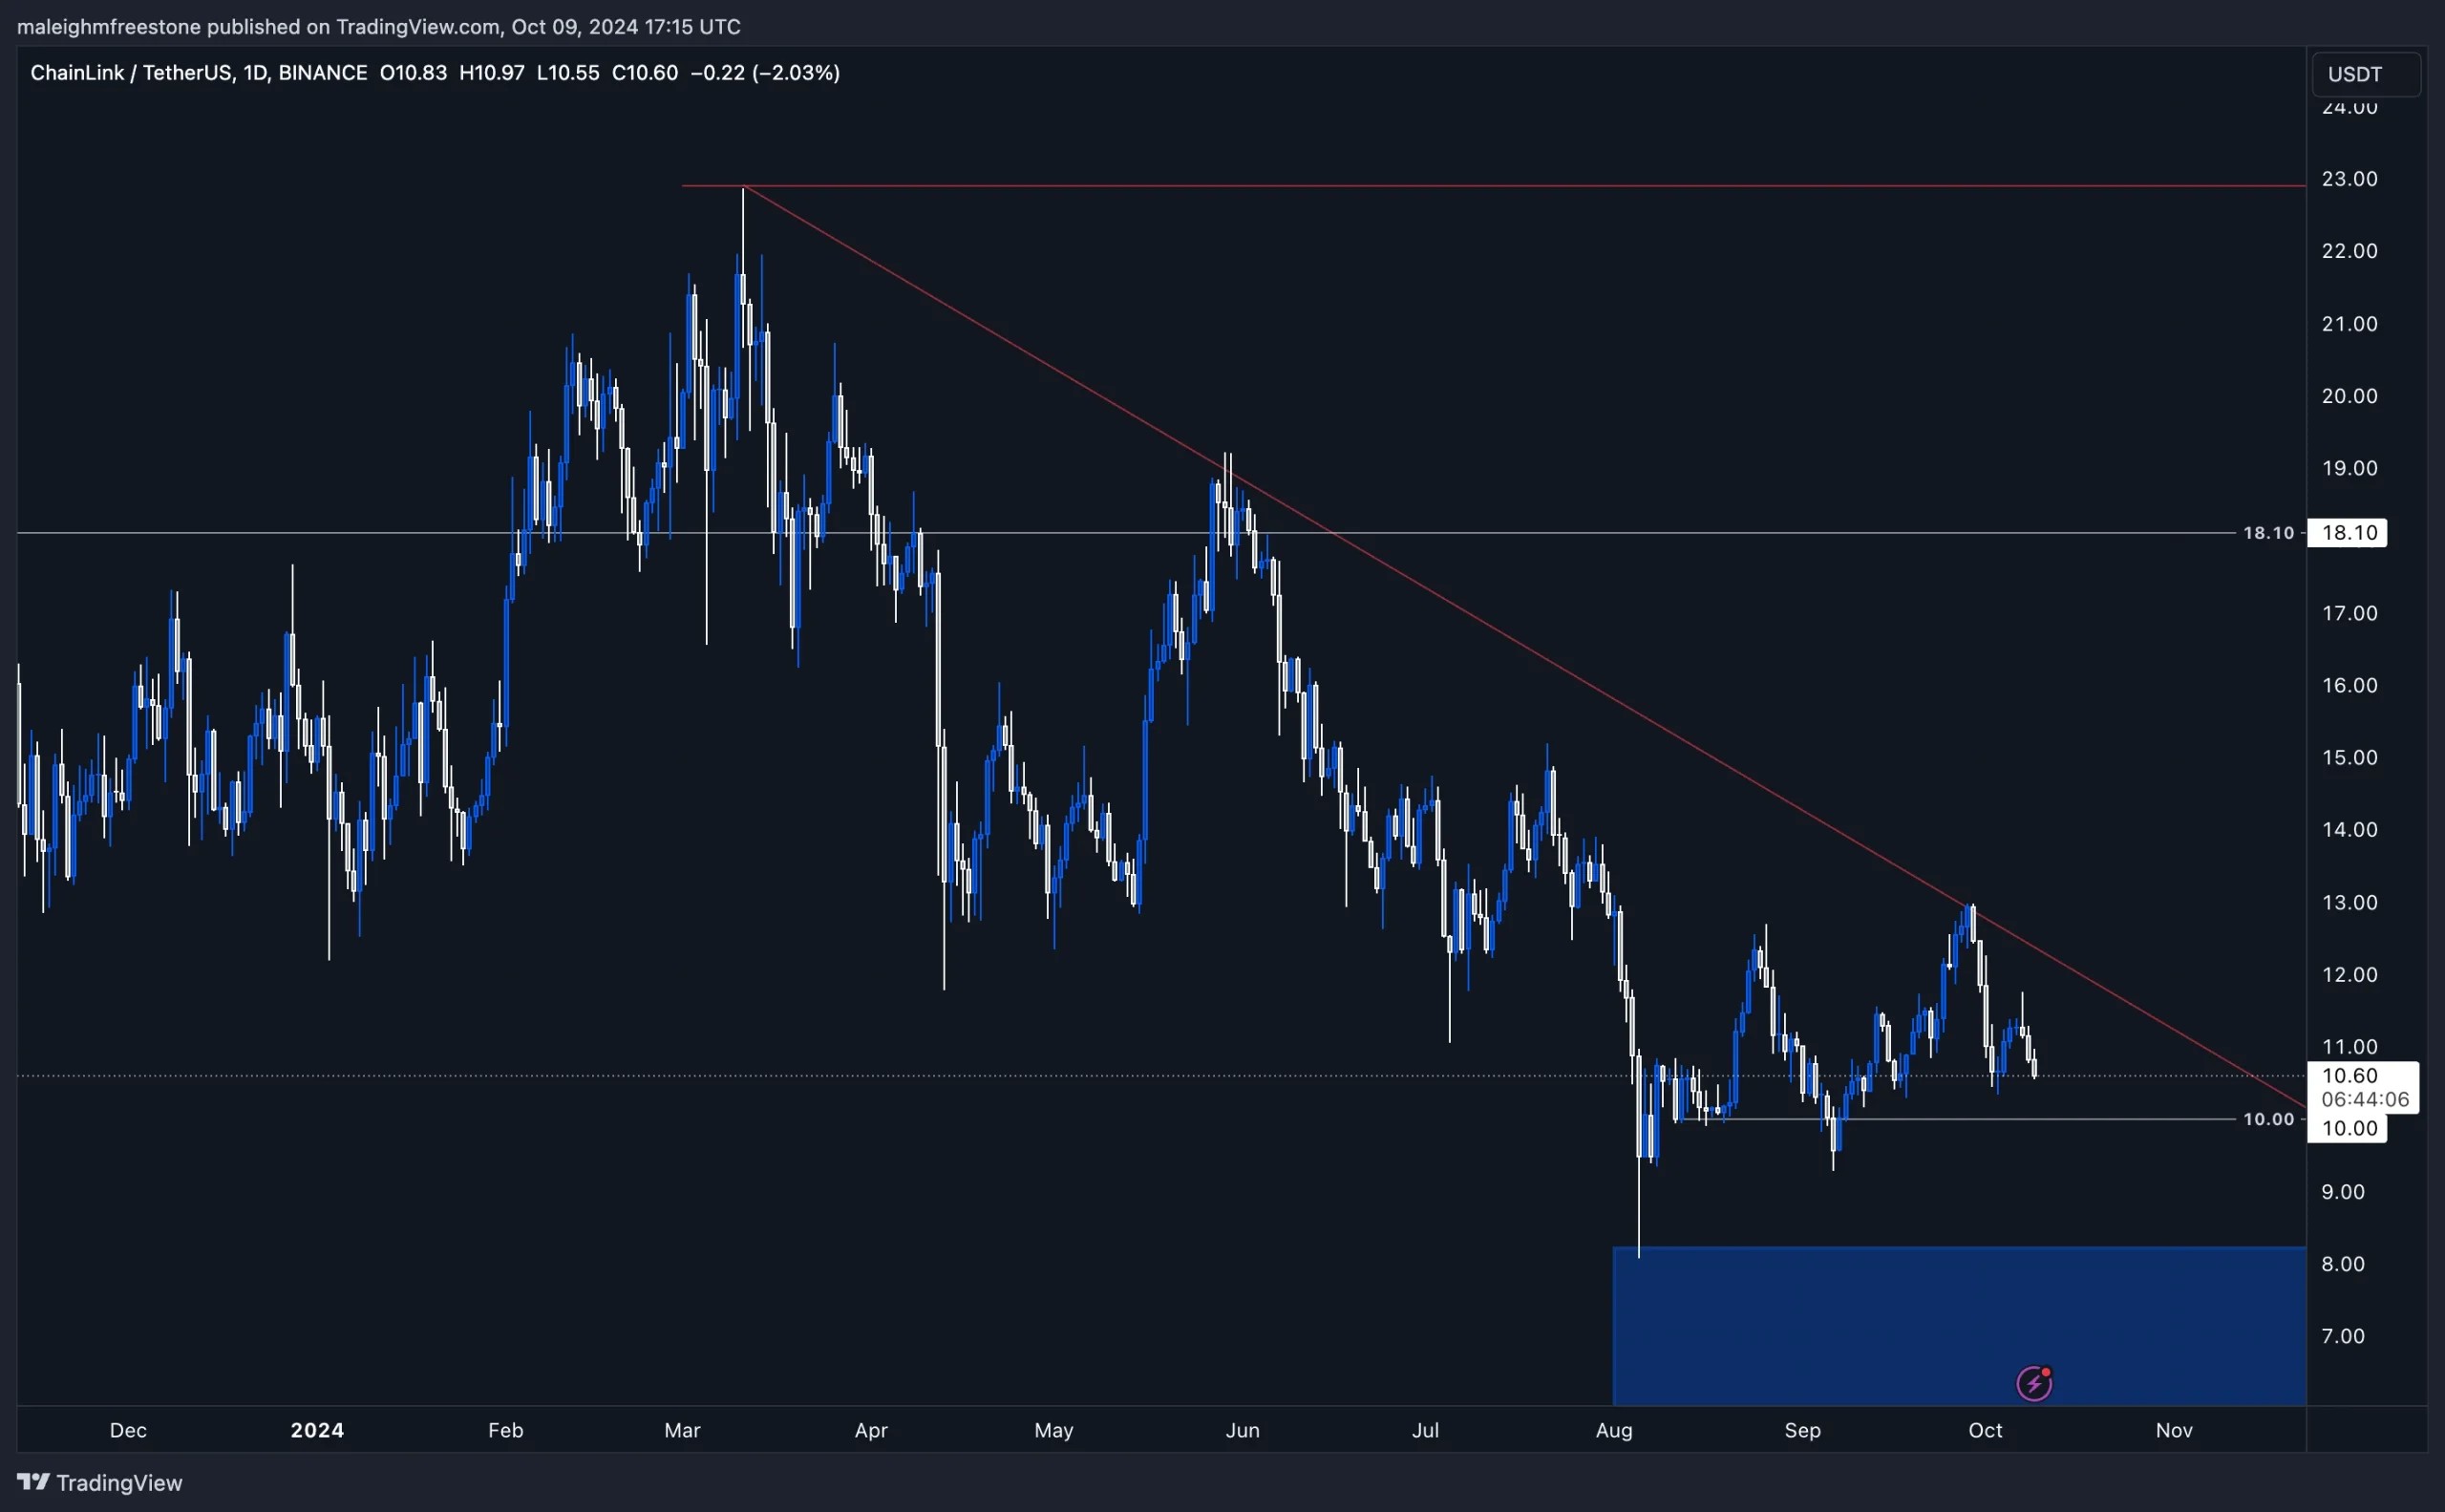
Switching to the daily timeframe
we can see that $10 has acted as key support over the last few weeks. This is interesting because, despite the bearish trendline still being respected, the price could be forming a wedge pattern. If bidders continue to hold the $10 level, this could be the area where we see a reversal and a push toward higher prices, with $18.10 being a significant target.This level served as the sell-off point in April-March 2022 for LINK and was also tested at the end of May this year. If the price manages to break above $10 and regain momentum, a mid-term target of $22.90 is in play. However, if the price breaks down below $10, we'll look toward $8.22 as the next strong bidding area, which could provide a stronger return.
LINK is part of our CPRO picks, and while it's not currently something we're invested in, it's a strong contender. The fact that it has broken the April-March 2022 sell-off within its context highlights its potential for strong performance this cycle. Buyers have shown enough demand at key levels, and this sets up the opportunity for a decent move.
Playbook
Key levels
- Support: $10, $8.22
- Resistance: $18.10, $22.90
Trading setup
The $10 level is key for accumulation. If the price holds here and breaks above the bearish trendline, we could see a move toward $18.10, with a mid-term target of $22.90. If the price breaks down, $8.22 would be the next strong bidding zone.Risk Management
Accumulating around $10 provides a solid risk-to-reward setup, but failure to hold this level would mean a reassessment of the position. Below $10, $8.22 would be the next level to target for bids.Market sentiment
LINK has shown strength in reclaiming levels and remains part of our CPRO picks. The potential for a reversal at $10, combined with significant levels like $18.10 and $22.90 as targets, makes this asset one to watch closely. The bearish trendline is still in play, but the structure shows signs of a potential breakout.Cryptonary's take
LINK is at a key point, and while we're not currently positioned in it, the potential for a strong move is clear. A hold above $10 and a push toward $18.10 could allow for a significant upside, with $22.90 as a mid-term target. As always, we're monitoring the asset for opportunities, and buyers should be aware of key levels, like $8.22 for accumulation if we see a breakdown.OP:
Overview
Optimism ($OP) has consistently presented strong trading setups, and it's one of those assets that I've closely followed over the years. Back in Q4 2023, I (Kushal) captured a great opportunity when $OP found support from a key demand zone it had established earlier that year. At the time, $OP had pulled back and showed strength while consolidating, making it an ideal swing trade setup.Now, in 2024, we're seeing a similar structure emerge. $OP continues to exhibit a prolonged bullish trend with clear higher highs and retracements into key demand zones. As of now, $OP is trading within the crucial demand zone between $1.14 - $1.46, an area that previously marked a strong accumulation base. Given the current bullish market sentiment, it appears that we could be approaching another significant upward move.
Weekly timeframe analysis
On the weekly chart, $OP has consistently maintained a bullish structure since its launch, with higher highs followed by retracements into key demand zones before continuing its upward trajectory. This pattern reflects the coin's ability to build strong bases of support, propelling its next moves higher.Right now, $OP is trading at $1.55 trading, just above its demand zone, ranging from $1.14 to $1.46, an area that has historically provided a solid foundation for upward movement. This current zone is critical as it aligns with a demand area created back in September/October 2023 (marked by the orange circle).
Coincidentally, this was around the time when I initially took longs on $OP because I recognized it taking support from an earlier demand zone created in December 2022 (marked by the purple circle). This repeat of history shows how $OP has been moving within a well-defined structure, constantly using these demand zones to reset, accumulate, and push higher.
By sticking to this well-established higher-high and higher-low pattern, $OP's price action reflects market support, keeping it well-positioned in this prolonged bullish cycle.
Key observations
- Demand zone: $1.14 - $1.46 remains a crucial accumulation area.
- Support strength: If the price continues to hold in this area, we could see a solid move upward.
- Potential risks: A break below $1.14 could lead to further downside, with the next key support area around $0.95.

Daily timeframe analysis
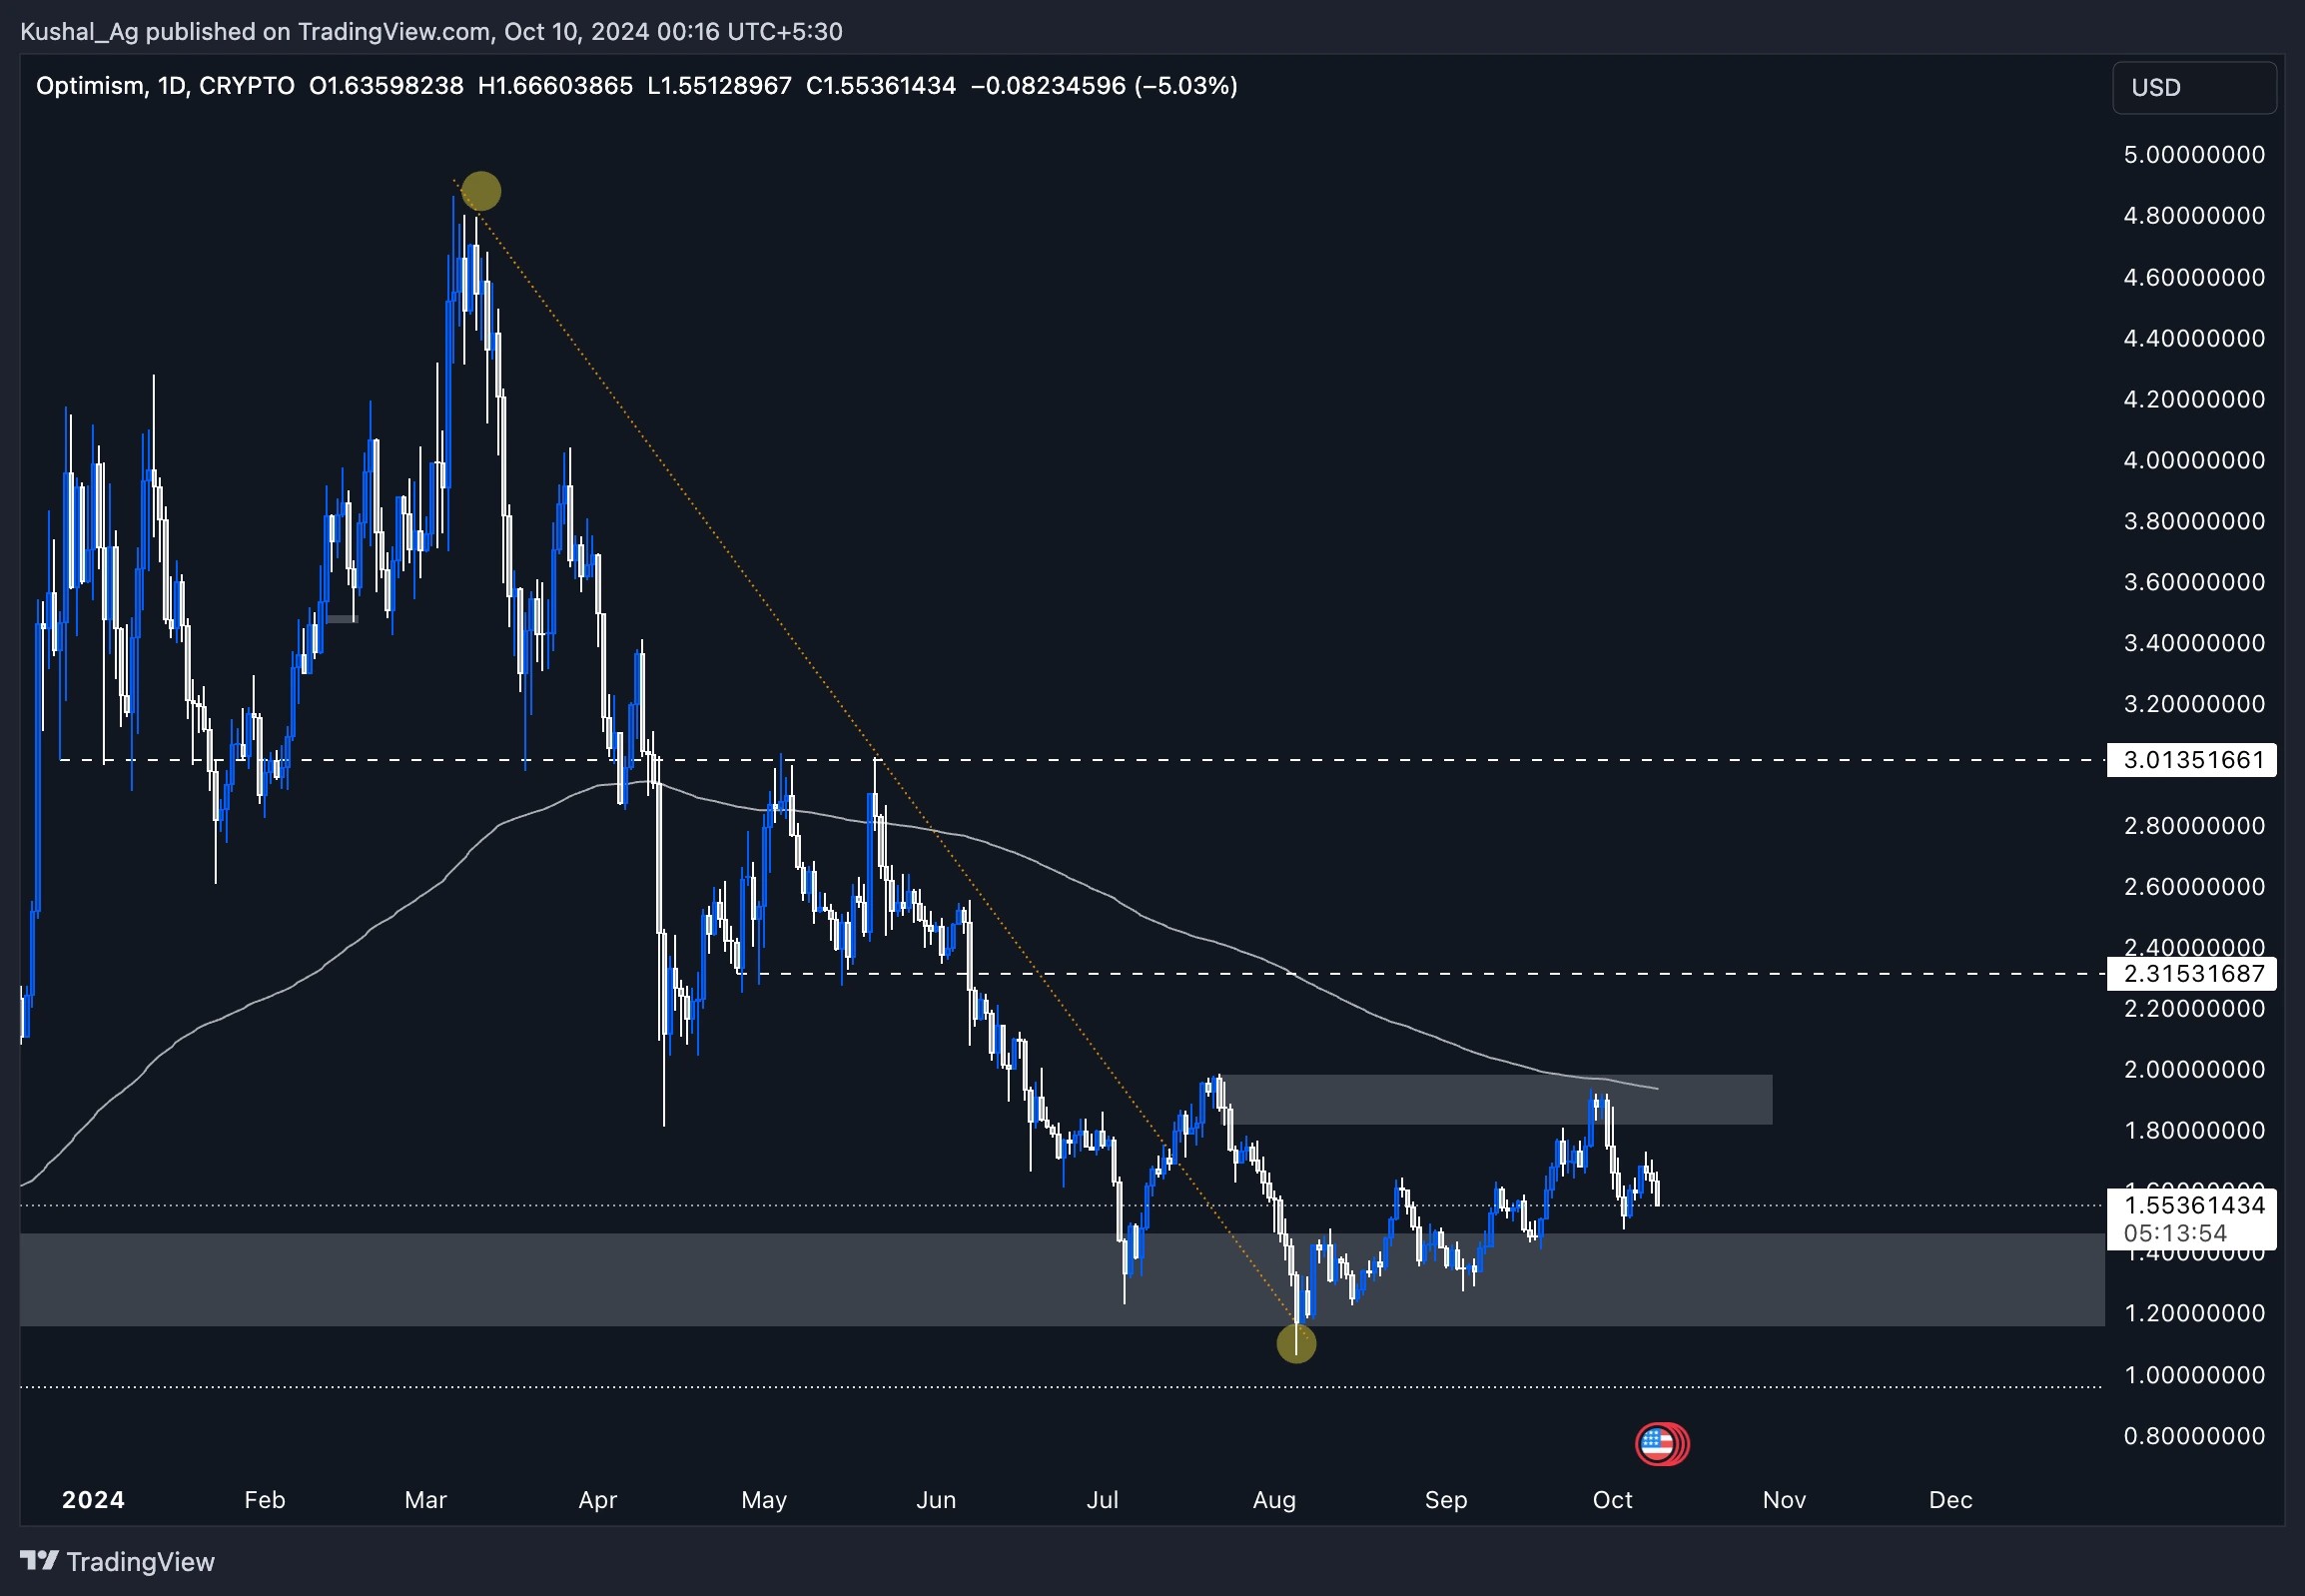
On the daily chart, we've seen some significant developments with $OP recently. Back in mid-July, $OP broke out from a persistent downtrend that had been in place ever since the all-time high (ATH) of $4.86 back in March 2024.
The breakout wasn't just a quick run either; it gave a solid retest to the trendline in early August, which, in my experience, adds serious confluence to the setup.
Right now, $OP is facing some resistance from a supply zone that's marked between $1.98 - $1.81, and this is where things get interesting. Not only is the price fighting this zone, but we've got the 200 EMA sitting right around $1.93, too. That makes this zone a critical level to watch. In my opinion, flipping this zone and turning it into support is essential if $OP is going to shift fully bullish and make those bigger moves we're anticipating.
If $OP manages to break above and hold, the next immediate resistance is sitting at $2.31. And if we flip that, we're likely talking about a move to $3+ in the medium term. Those are the targets we'd be eyeing for swing opportunities.
On the downside, the weekly demand zone between $1.14 - $1.46 remains our strong support level. If we do see a retracement or failure to break the current resistance, this demand zone should act as a solid area for accumulation. For me, the confluence of the 200 EMA and the supply zone makes this a very key area to watch. If we flip it, I wouldn't be surprised to see some decent swing setups in the near future.
Cryptonary's take
The price action for $OP is shaping up similarly to the setups we saw in late 2023. The current retracement to a critical demand zone, along with the wider market becoming bullish, offers a potentially strong upside for $OP. Flipping key resistance levels will be crucial for confirming this bullish thesis, but the setup looks promising for possible swing opportunities in the medium term.Recommended from Cryptonary


