Save 23% ($351) & Get a Free 1-1 Call with our Team ⏰ : 0d 2h 59m 44s
Technical Analysis
Kaspa ($KAS) price prediction: Is $0.137 support key for bullish move?
Kaspa ($KAS) stands out as one of the few tokens maintaining a bullish structure on the daily timeframe despite the underperformance of many altcoins. This consistent bullish behavior indicates strong market confidence.

Current state
The higher high and higher low bullish structure of $KAS is evident from the red dots marking swings. The grey boxes represent key demand zones where $KAS retraces, accumulates, and shifts to create new higher highs. Currently, $KAS is trading at $0.163, having wicked down to its demand zone, attempting to form a local bottom around $0.12.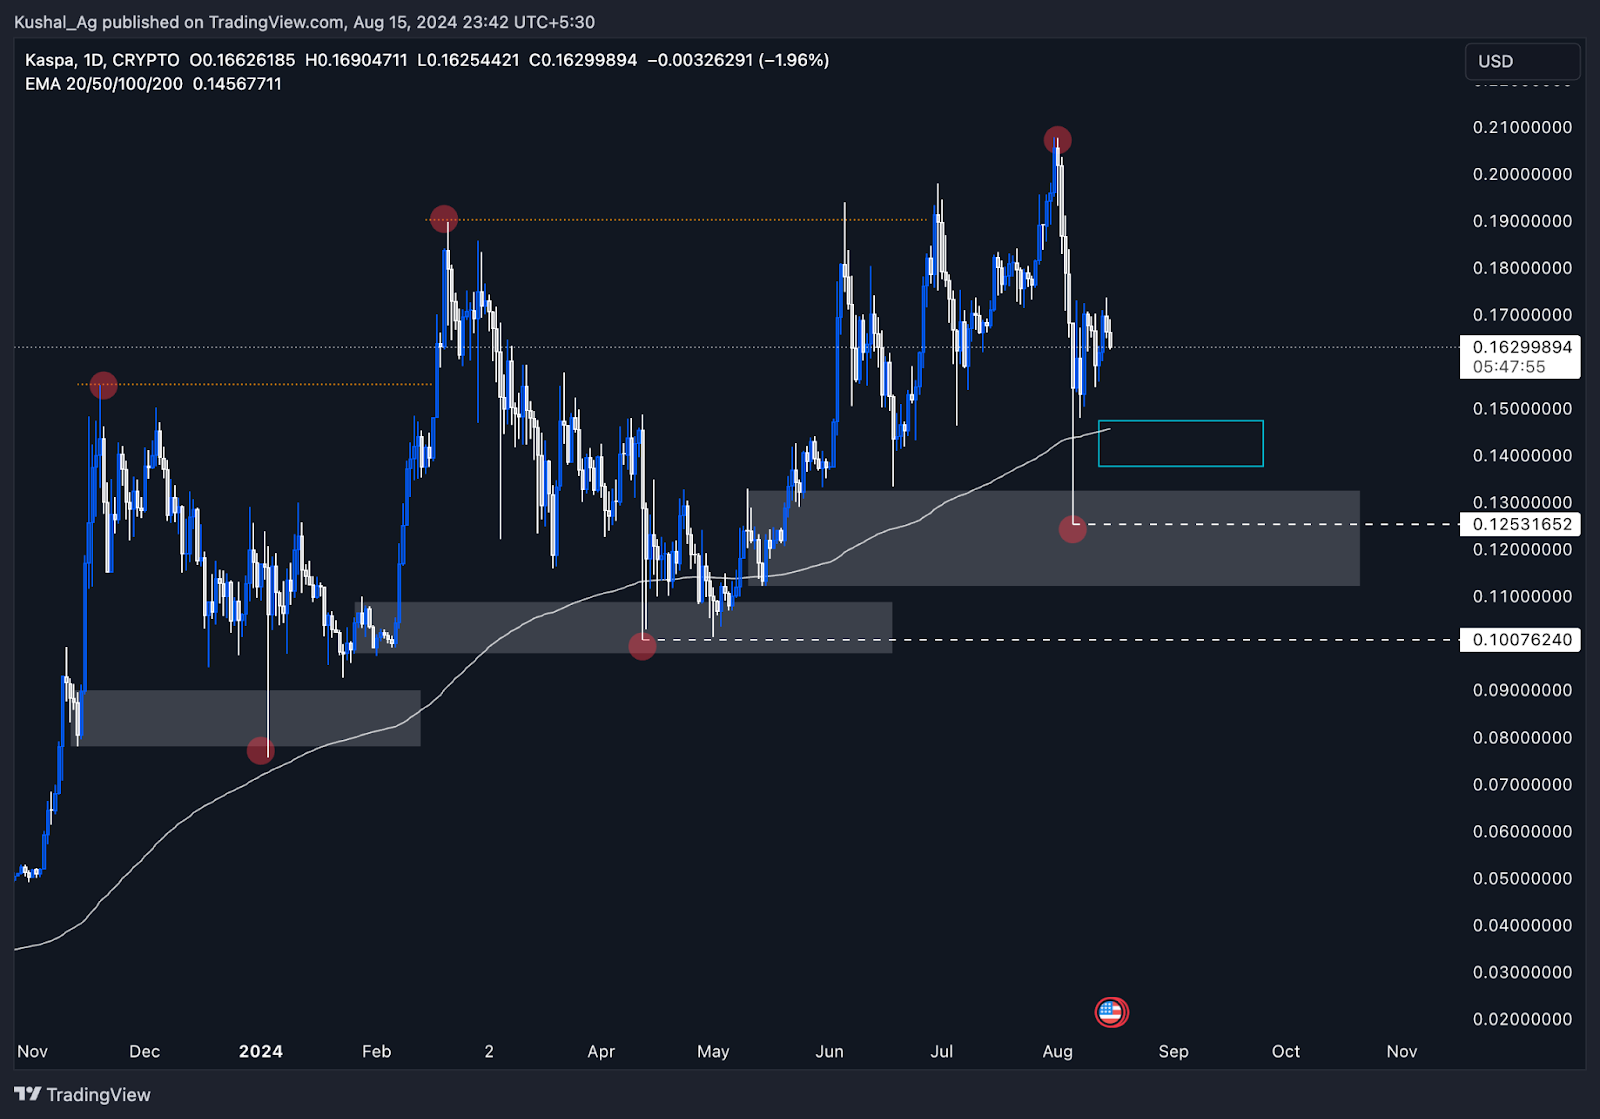
Key observations: support levels
The 200 EMA, a significant support level, is positioned just below the current price around $0.145, reinforcing the strength of the blue box zone ($0.137-$0.147) as an ideal DCA area.Demand zone
Deeper wicks below this area are expected, with $0.10 identified as the next downside support that must hold to sustain the bullish momentum.Potential scenarios: Bullish continuation
If $KAS holds above the $0.137-$0.147 zone and the 200 EMA, it may continue its bullish trend.Disclaimer: This is not financial or investment advice. You are responsible for any capital-related decisions you make, and only you are accountable for the results.
Deeper retracement
A break below $0.137 could lead to a retracement to $0.10, a key support level.Conclusion
$KAS is currently positioned within a strong support zone, making it an ideal candidate for DCA. The asset's consistent bullish structure suggests that holding above the $0.137-$0.147 area and the 200 EMA could lead to further upside. However, a break below this zone could trigger a deeper retracement to $0.10, which would be a key level to watch.
Recommended from Cryptonary


PRO
Market Direction
11 min read
Mar 24, 2026

PRO
Market Updates
8 min read
Mar 23, 2026
PRO
Market Direction
13 min read
Mar 20, 2026
