Log in

Home
Research
Analysis
Community
  1. Cryptonary
  2. Market Analysis
  3. Kaspa technical analysis: Can $0.189 resistance be broken?
Technical Analysis

Kaspa technical analysis: Can $0.189 resistance be broken?

Published: Oct 9, 2024
0
Share:

Kaspa is consolidating at $0.13 support, targeting $0.189 resistance. Can this accumulation zone lead to a breakout? Let's explore the technical analysis and key levels.

Post Feature Image

Disclaimer: This is not financial or investment advice. You are responsible for any capital-related decisions you make, and only you are accountable for the results.


Market context

Kaspa has been one of the strongest assets this cycle in terms of structure, consistently respecting higher highs and higher lows. The 0.13 price point is the significant level in play, with the highs at 0.189 acting as resistance.

We've seen consistent buying pressure around 0.13, where buyers have stepped in multiple times, making this a key area for accumulation. On the 6th of October and the 29th of September, spikes in open interest and funding rates led to some sell-offs.

Despite this, the positive funding rate during those periods indicated that buyers were still interested in accumulating Kaspa with leverage (risk on), which shows strong interest in the asset on the buy side. Now that the price is trading around 0.13 and the funding rate and open interest have reset to healthier levels, we could expect more bids to come in at this key level.

Historically, this level has shown strong buying activity, including a significant recovery on the 5th of August after a drastic sell-off, where Kaspa rebounded with a bullish candlestick that saw a 30% move. This is not an asset we're invested in, but its structure and price action make it one to watch, and with many requests on Kaspa, it's worth covering. The significant selling pressure at the 0.189 level suggests a key resistance zone that, if broken, could lead to significant upside.

1.-Kaspa-weekly-chart-showing-key-support-at-_0.13-and-resistance-at-_0

Liquidation heat map

Over the last 3 months, there has been a significant build-up of short positions above the 0.18 level. This suggests that if Kaspa can break out above this price point, we could see a short squeeze, which would push the price higher. The 0.189 level is particularly key, as it has seen heavy selling pressure. If this level is cleared, it's likely we'll see a swift move upwards.

2.-Liquidation-heatmap-for-Kaspa-showing-accumulation-of-short-positions-above-_0

Weighted funding rate

Positive funding rate spikes on the 6th of October and 29th of September show that buyers were actively bidding on Kaspa with leverage. The current reset of the funding rate suggests a healthier state for fresh bids to come in.
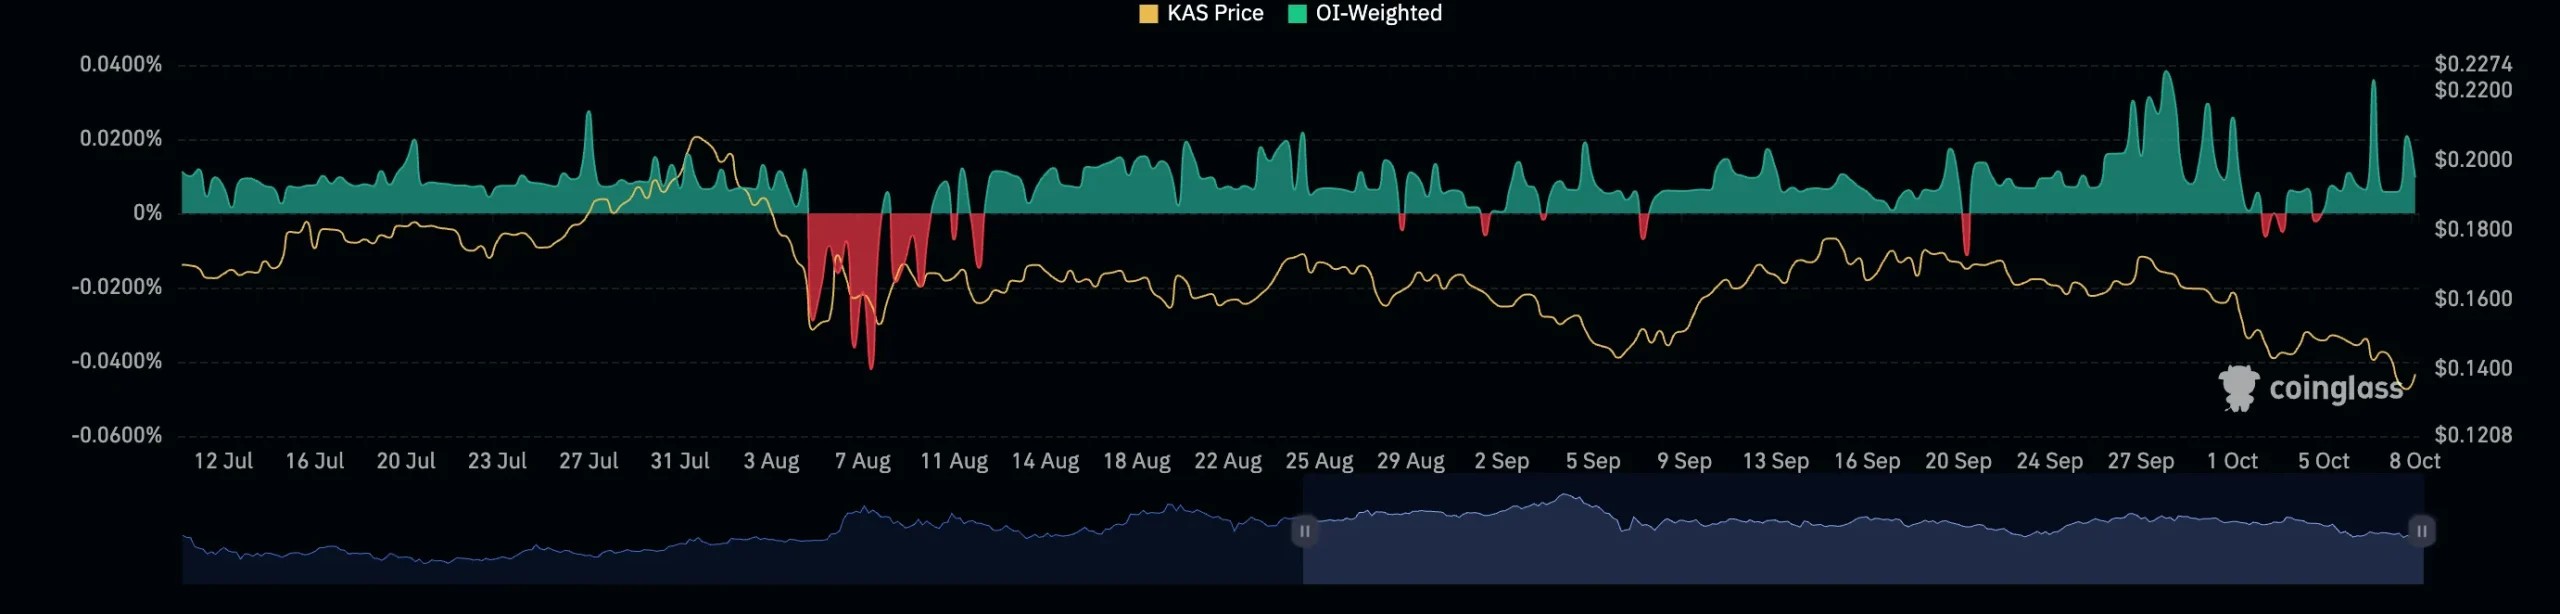
3. Chart showing Kaspa's weighted funding rate fluctuations with significant spikes and price movements between July and October

Open interest

During the sell-offs, open interest spiked, showing significant activity from both buyers and sellers. Now, with open interest resetting, it's likely we'll see more buying pressure at the 0.13 level.

4. Kaspa open interest chart displaying correlation between price and open interest levels from March to October

Playbook

Key levels

  • Support: 0.13
  • Resistance: 0.189
  • Long-term target: 0.3 (with potential upside after 0.189)

Spot setup

Kaspa is currently range-bound between 0.13 and 0.189. Accumulating around 0.13 provides a solid opportunity, with the potential for a breakout above 0.189 to target 0.3. If Kaspa can reclaim 0.189 and break into price discovery, we will likely see a move to these levels when BTC begins to gain more traction towards November, especially considering the build-up of short positions above 0.18.

Risk management

The key is to accumulate around 0.13. If this level fails, it's a signal to reassess. A breakout above 0.189 would provide the confirmation needed for a larger bullish move. Failure to break 0.189 could result in more sideways action or a retrace.

Market sentiment

Kaspa has shown strong buying pressure at key levels, and with the funding rate and open interest resetting, this is a healthy zone for accumulation. The potential for a short squeeze to short term liquidation levels on the 48 hour above 0.15, combined with bullish market structure, makes this asset one to keep an eye on, even if we aren't currently positioned in it.
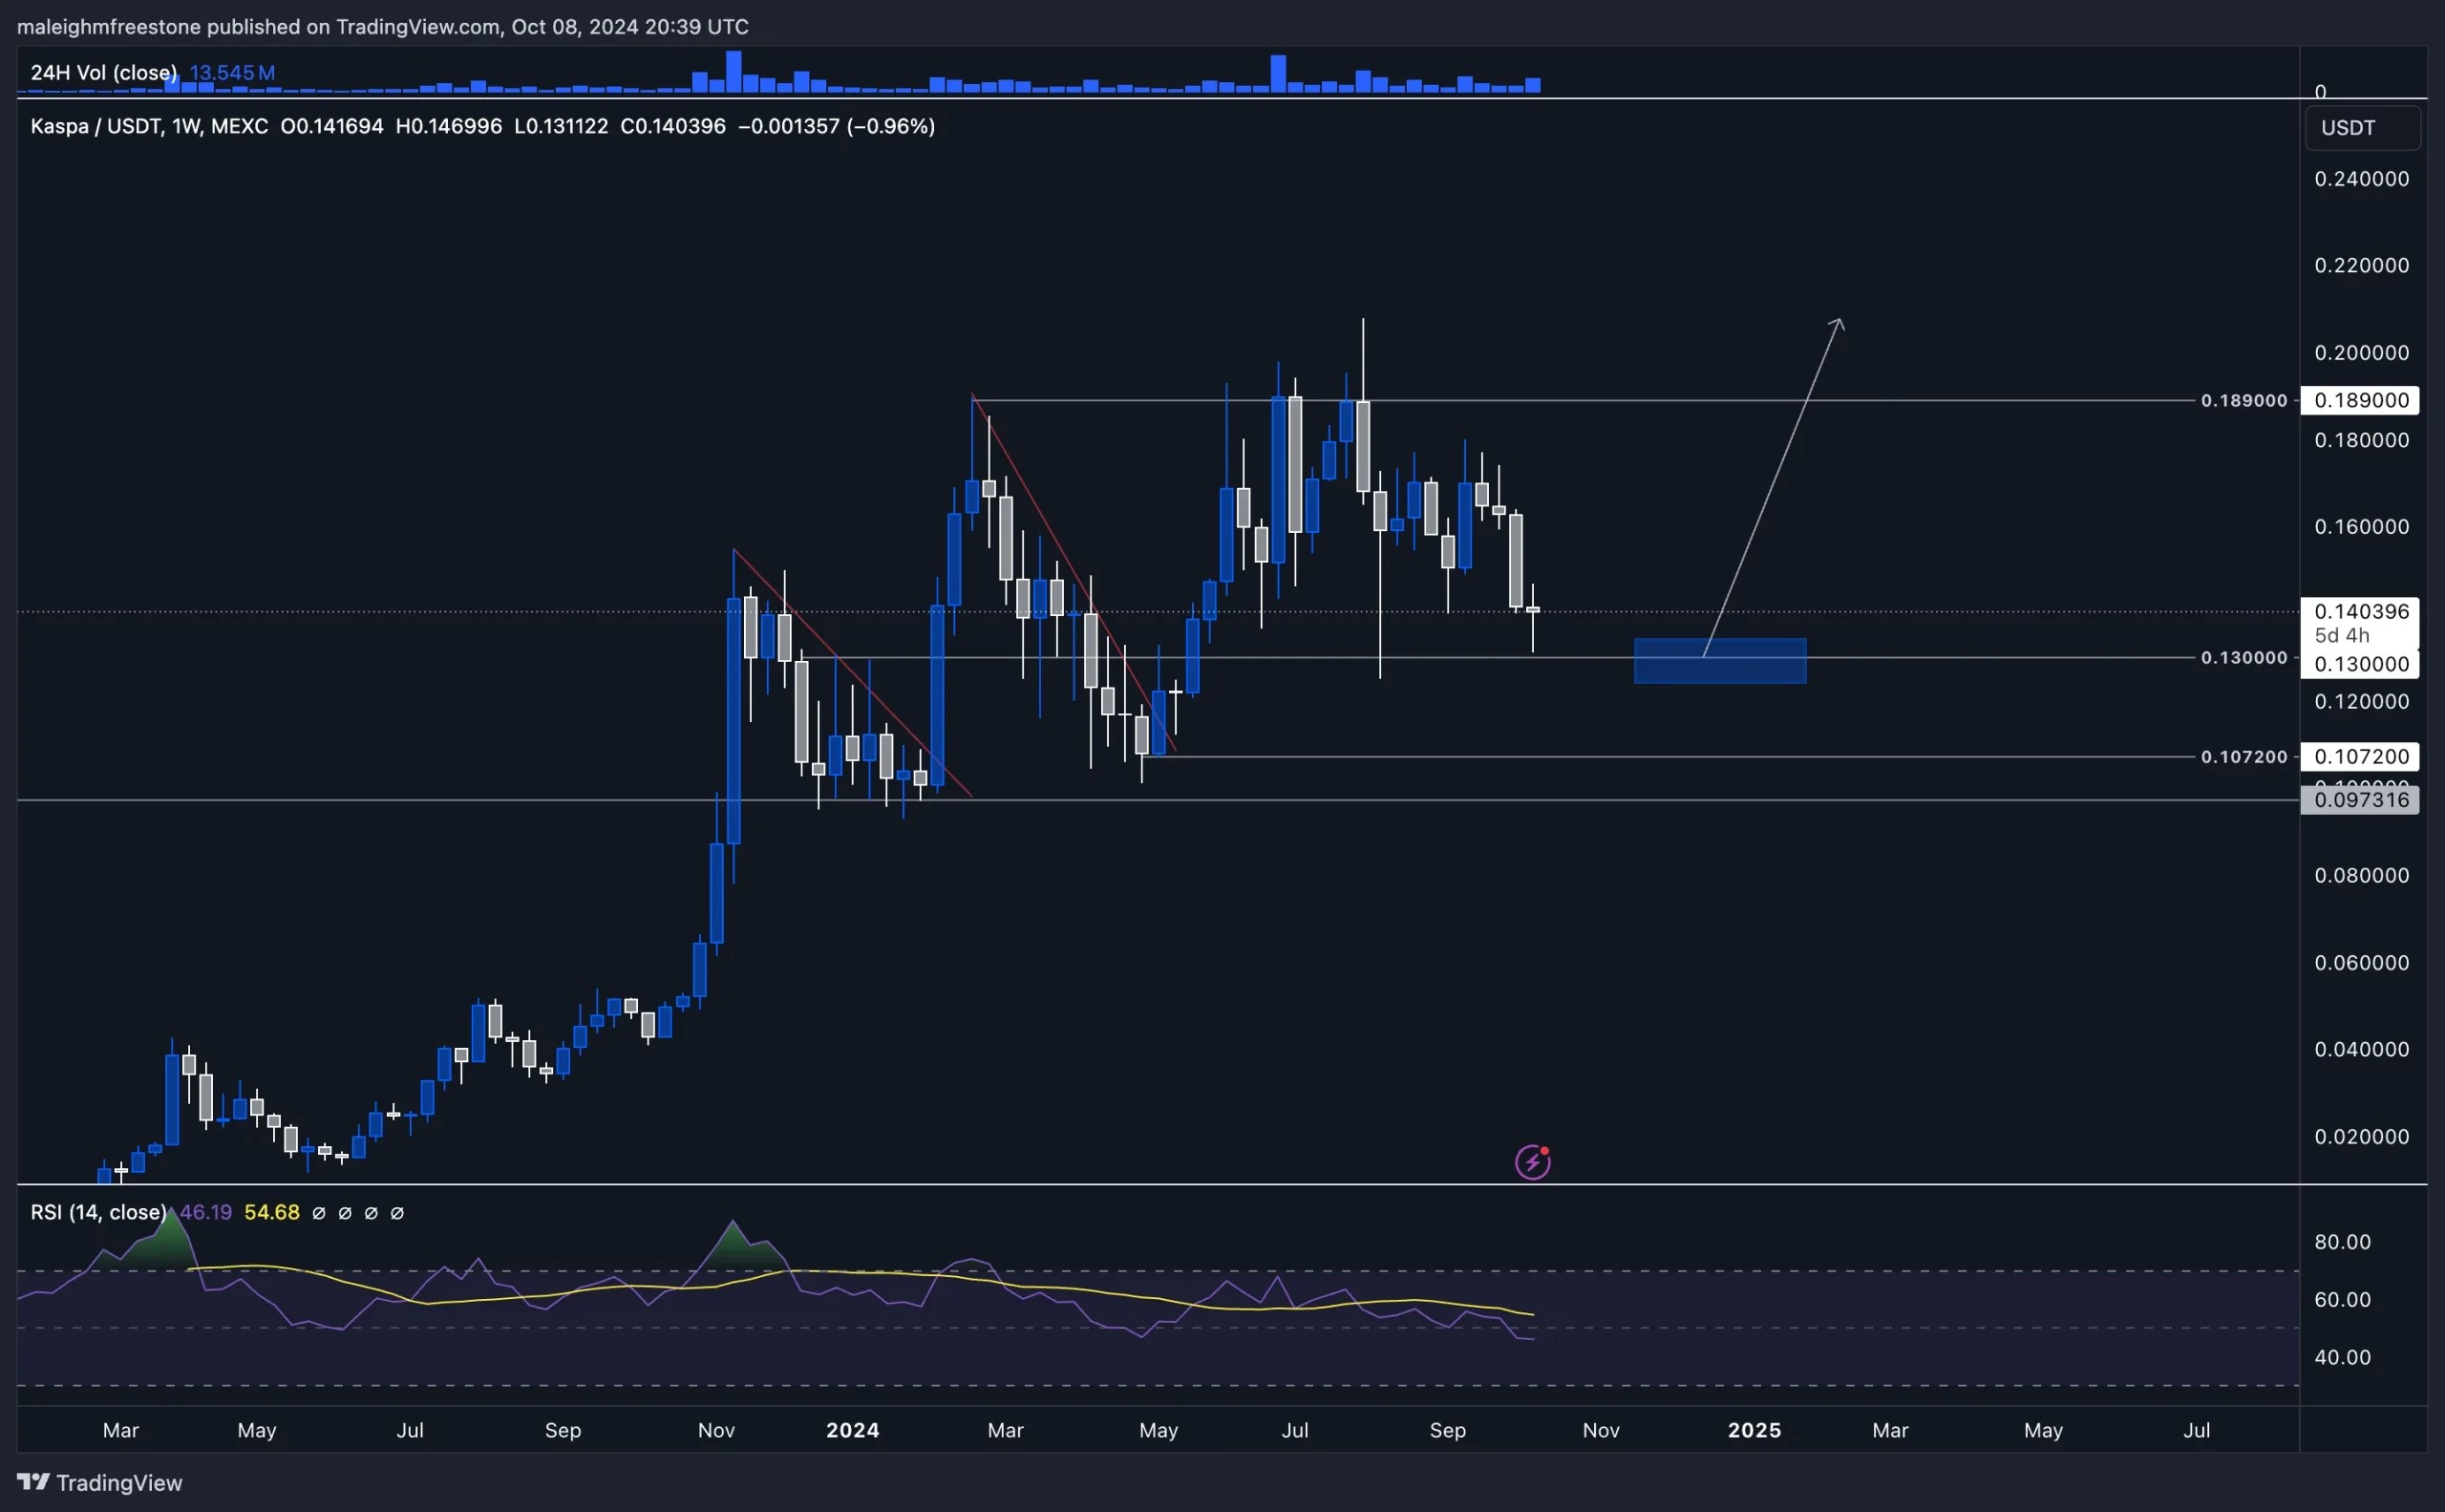
5. Kaspa chart projecting potential breakout from $0.13 support toward $0.189 resistance with highlighted bid zone

Cryptonary's take

Kaspa's price action is showing solid strength. With key levels at 0.13 and 0.189 in play, this is a strong accumulation zone. A breakout above 0.189 would signal a major shift, with the potential to target the highs and beyond. This is one to watch closely for the next move, as the asset is well-positioned for upside, provided it can break key resistance.

Get started for free

Create your free account or log in to read the full article.

​

Germany

By signing up, you agree to our Terms & Conditions
Recommended from Cryptonary
Market Pulse: Inflation Undershoots Forecast, Rate Cut Odds Rise
PRO
Market Pulse
Market Pulse: Inflation Undershoots...Inflation prints delivered a slight downside surprise, opening the door for Fed cuts sooner than exp...
3 min read
Feb 13, 2026
Market Pulse: Jobs Data Surges, Rate Cut Odds Recede
PRO
Market Pulse
Market Pulse: Jobs Data Surges, Rat...Nonfarm payrolls smashed expectations, sending traders scrambling to reprice rate cut timelines. Wit...
3 min read
Feb 11, 2026
BTC, ETH and More: Relief Rally Stalls, Downside Risks Emerge
PRO
Market Direction
BTC, ETH and More: Relief Rally Sta...Last week’s relief rally played out with precision across majors, but the follow-through never came....
10 min read
Feb 10, 2026
BTC, ETH and More: Downside Risks Grow Across Majors
PRO
Market Direction
BTC, ETH and More: Downside Risks G...Relief rallies are becoming weaker. Each push into resistance is seeing less expansion, shorter foll...
12 min read
Feb 17, 2026
Market Update: What We're Watching This Week?
PRO
Market Updates
Market Update: What We're Watching ...This is where patience pays. Macro conditions are slowly aligning, but price action is still trapped...
7 min read
Feb 16, 2026
BTC, ETH and More: Relief Bounce in Play
PRO
Market Direction
BTC, ETH and More: Relief Bounce in...Downside targets across majors have been fulfilled, and price is attempting to hold key support zone...
10 min read
Feb 13, 2026
Market Pulse: Inflation Undershoots Forecast, Rate Cut Odds Rise
PRO
Market Pulse
Market Pulse: Inflation Undershoots...Inflation prints delivered a slight downside surprise, opening the door for Fed cuts sooner than exp...
3 min read
Feb 13, 2026
Market Pulse: Jobs Data Surges, Rate Cut Odds Recede
PRO
Market Pulse
Market Pulse: Jobs Data Surges, Rat...Nonfarm payrolls smashed expectations, sending traders scrambling to reprice rate cut timelines. Wit...
3 min read
Feb 11, 2026
BTC, ETH and More: Relief Rally Stalls, Downside Risks Emerge
PRO
Market Direction
BTC, ETH and More: Relief Rally Sta...Last week’s relief rally played out with precision across majors, but the follow-through never came....
10 min read
Feb 10, 2026
Research
Top PicksDeep DivesPassive IncomeAirdrop Reports
Analysis
Market UpdatesMarket DirectionMarket PulseLivestreams
Tools
Market DirectionAssets & PicksAirdropsPortfolio Tracker
Cryptonary
Affiliate programEducationPrivacy PolicyTerms & ConditionsContact UsWrite for usTeam
Stay connected
Disclaimer: The information provided on this website is for educational and informational purposes only and does not constitute financial, investment, legal, or tax advice. Cryptonary is not a licensed financial advisor. All content is shared without any guarantee of accuracy or completeness. You are solely responsible for your investment decisions. Always do your own research and consult with a licensed professional before making financial choices. Past performance is not indicative of future results.

×
popupimage
Our Latest Utility Token Research ReportPreviously locked for Pro members, now available to read in full.
  • tickThe utility token we're tracking closely
  • tickWhy we believe it's still early in the cycle
  • tickWhat we're watching to confirm a structural shift
​
Germany

No spam. No hype. Just the research.