Save 23% ($351) & Get a Free 1-1 Call with our Team ⏰ : 0d 2h 59m 43s

Disclaimer: This is not financial or investment advice. You are responsible for any capital-related decisions you make, and only you are accountable for the results.
Optimism ($OP):
Overview
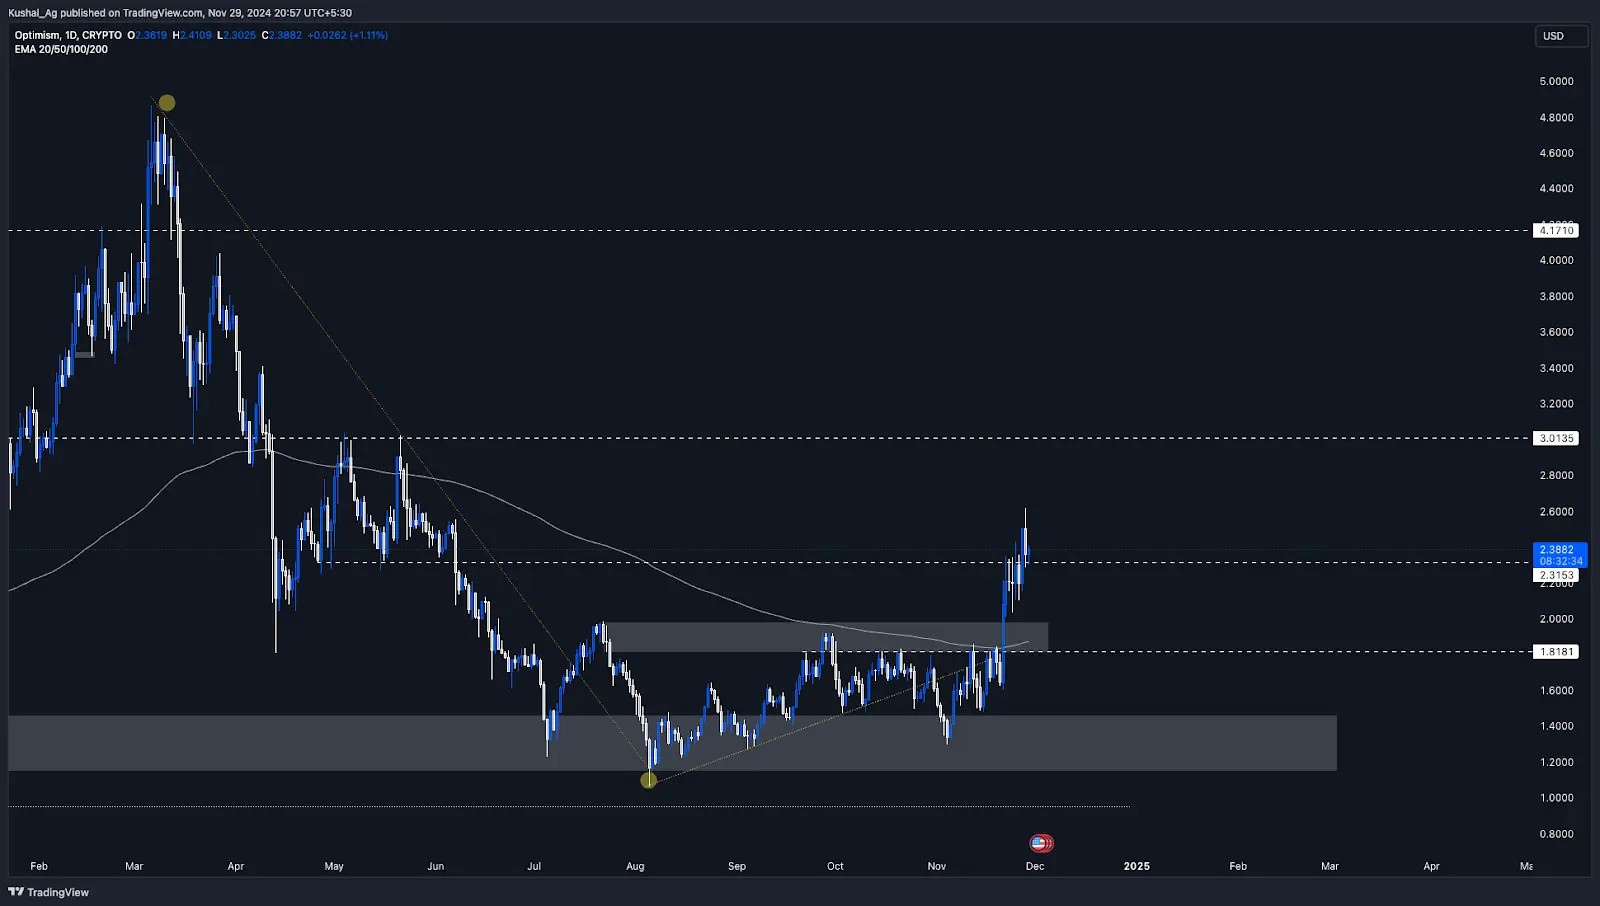
Optimism ($OP) is showing strong signs of reversal and bullish momentum. With Ethereum turning bullish and gaining traction, its L2s, including Optimism, are likely to benefit from increased inflows. $OP has made significant progress by breaking multiple resistance levels, marking a potential shift in structure to bullish.Currently, $OP is trading at $2.34, above its key resistance at $2.31, which has now turned into support. Furthermore, it successfully reclaimed the 200 EMA in the daily time frame, which was a critical resistance at $1.86. This breakout, coupled with its ability to sustain above the supply zone, highlights its growing strength.
Daily timeframe analysis
- Key levels and breakout:
- $OP broke above its $2.31 resistance, a level mentioned in the prior analysis, and is now attempting to make a base above it.
- The 200 EMA on the daily time frame, previously acting as resistance at $1.86, is now a support following the breakout a week ago.
- Current momentum:
- Optimism surged through a significant grey supply zone, signalling renewed buying interest.
- The price now faces a resistance level at $3.00, with clean space above to target $4.17 in the medium term if it gains momentum.
- Support levels:
- Immediate support lies at $2.31, a previously broken resistance.
- Below this, the 200 EMA at $1.86 serves as a strong secondary support.
Cryptonary's take
Optimism is finally showing signs of bullish strength, benefiting from Ethereum's momentum and the increasing demand for L2 solutions. The recent breakout above $2.31 and the 200 EMA marks a pivotal moment for $OP. If it continues to build a base above these levels, we can anticipate a rally toward $3.00 in the short term and $4.17 in the medium term.However, it's crucial for Optimism to hold above the $2.31 support zone to maintain its bullish structure. Any breakdown below this level could trigger a retest of the $1.86 area. For now, $OP looks strong technically and offers a favourable setup for bullish continuation.
Tron ($TRX):
Overview
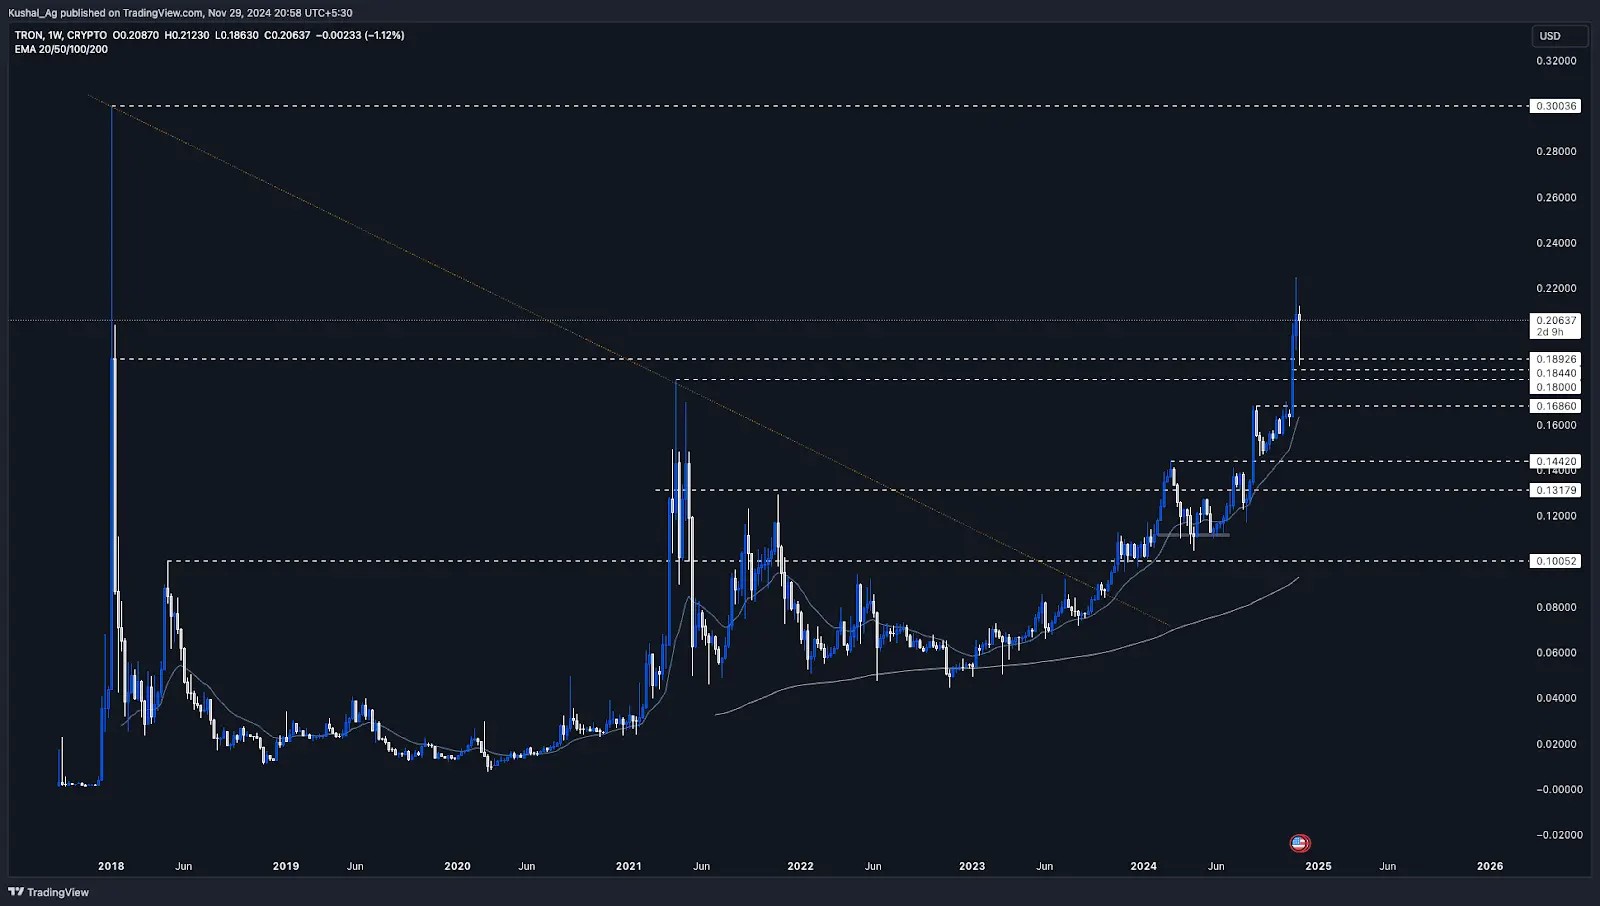
Tron ($TRX) continues to showcase exceptional strength, positioning itself as one of the most bullish assets in the market. Breaking out from its 2021 all-time high of $0.179, $TRX has confirmed its upward trajectory, moving with strong higher highs and higher lows on the weekly time frame. Currently trading at $0.207, Tron has successfully tested and rebounded from the $0.189 support level, signalling strong buyer interest at these levels.Daily timeframe analysis
- Recent breakout: Tron broke out from its 2021 ATH of $0.179 and has shown sustained momentum above this level, confirming the breakout with strong price action.
- Support test and reaction:
- The price recently went down to $0.189 to retest this level as support.
- A swift reaction from this level resulted in a 10.5% bounce, with $TRX now trading at $0.207.
- Open space ahead:
- Tron faces minimal resistance until the $0.3 region, the 2018 all-time high, which presents significant upside potential if the current momentum continues.
- Key resistance:
- The immediate resistance lies at the $0.225 local high, marked in the recent rally. A break above this level could set the stage for a move toward $0.3.
- Key support:
- The $0.189 level, now acting as confirmed support, will be critical for maintaining bullish momentum.
Cryptonary's take
Tron ($TRX) displays a textbook bullish structure, with consistently higher highs and higher lows in the weekly time frame. The successful breakout above its 2021 ATH and the strong reaction from the $0.189 support zone are clear indicators of continued bullish momentum.If $TRX can break above the $0.225 resistance, it is poised to target the $0.3 level in the coming weeks/months. However, holding above $0.189 will be critical to sustaining this rally. With its robust price action and open space on the upside, Tron remains a strong contender in the current market landscape.
PARCL:
Market context
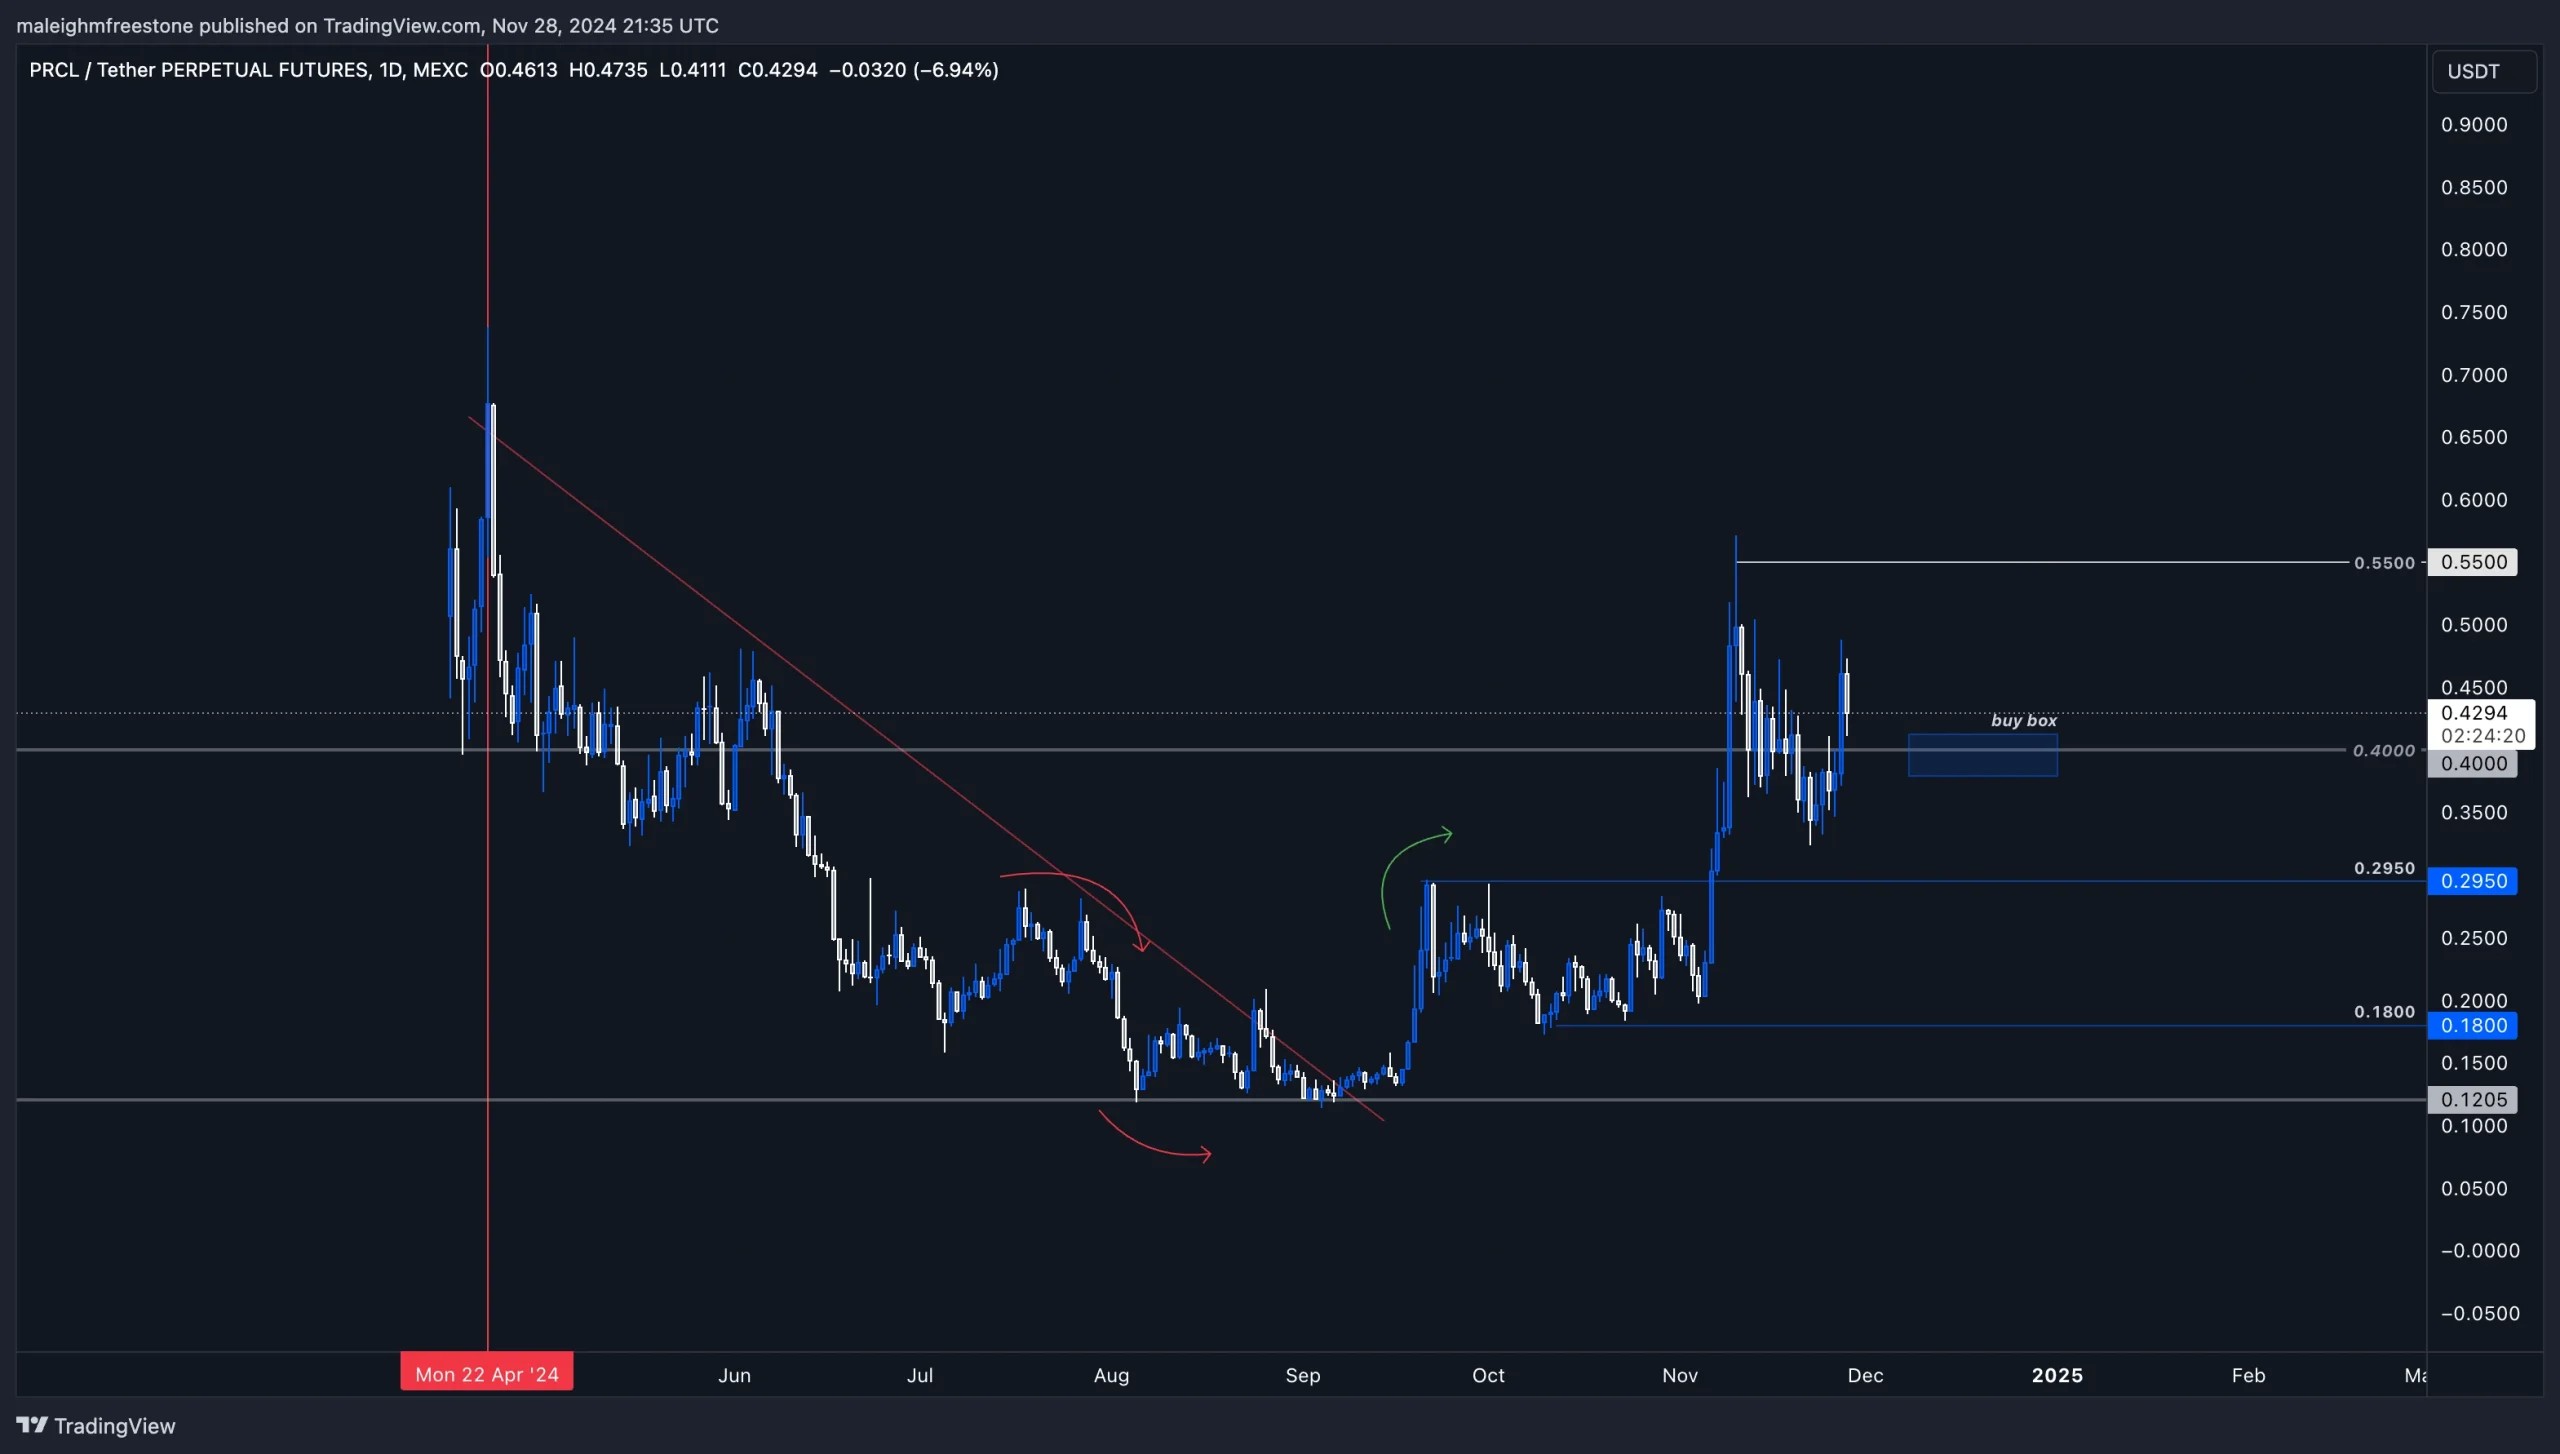
Parcl is an interesting case right now because we've seen a strong daily candlestick showing aggressive buying back to the $0.40 level. The $0.40 level has been a key support zone for years, particularly in April and May and even into early June before we traded below it.This structure has historically been significant for price action and interest. The fact that we've come back to reclaim this level shows that Parcel is essentially "back to square one."
After all the aggressive selling and downward movement, we've now retraced to a point where we're seeing bullish interest resume. At this stage, $0.40 acts as the baseline support level. It's where the rally began when the market shifted into an accumulation phase.
Above, $0.55 stands out as a critical resistance zone. If we can break and hold above $0.55, then we start targeting higher levels and a potential return to bullish momentum.
Playbook
Objective: Accumulate at the best possible levels within the context- Spot accumulation zone: $0.40 is the key level for accumulation, as it's a major support zone. Use any retests to build a position.
- Breakout target: If Parcl pushes past $0.55 with conviction, it confirms a shift into bullish territory, and we can target higher levels.
Key levels
- $0.40: Key support zone and baseline level for accumulation.
- $0.55: Key resistance level that, if broken, signals a move toward bullish continuation.
- Above $0.55: Watch for price discovery and follow momentum for further upside potential.
Cryptonary's take
Parcl is an intriguing setup as it reclaims key levels of interest. The bounce back to $0.40 is notable, and if the broader market continues to support bullish sentiment, Parcel could provide a strong recovery trade. It's a textbook case of watching for reclaim scenarios and leveraging those zones to build positions.LINK:
Market context
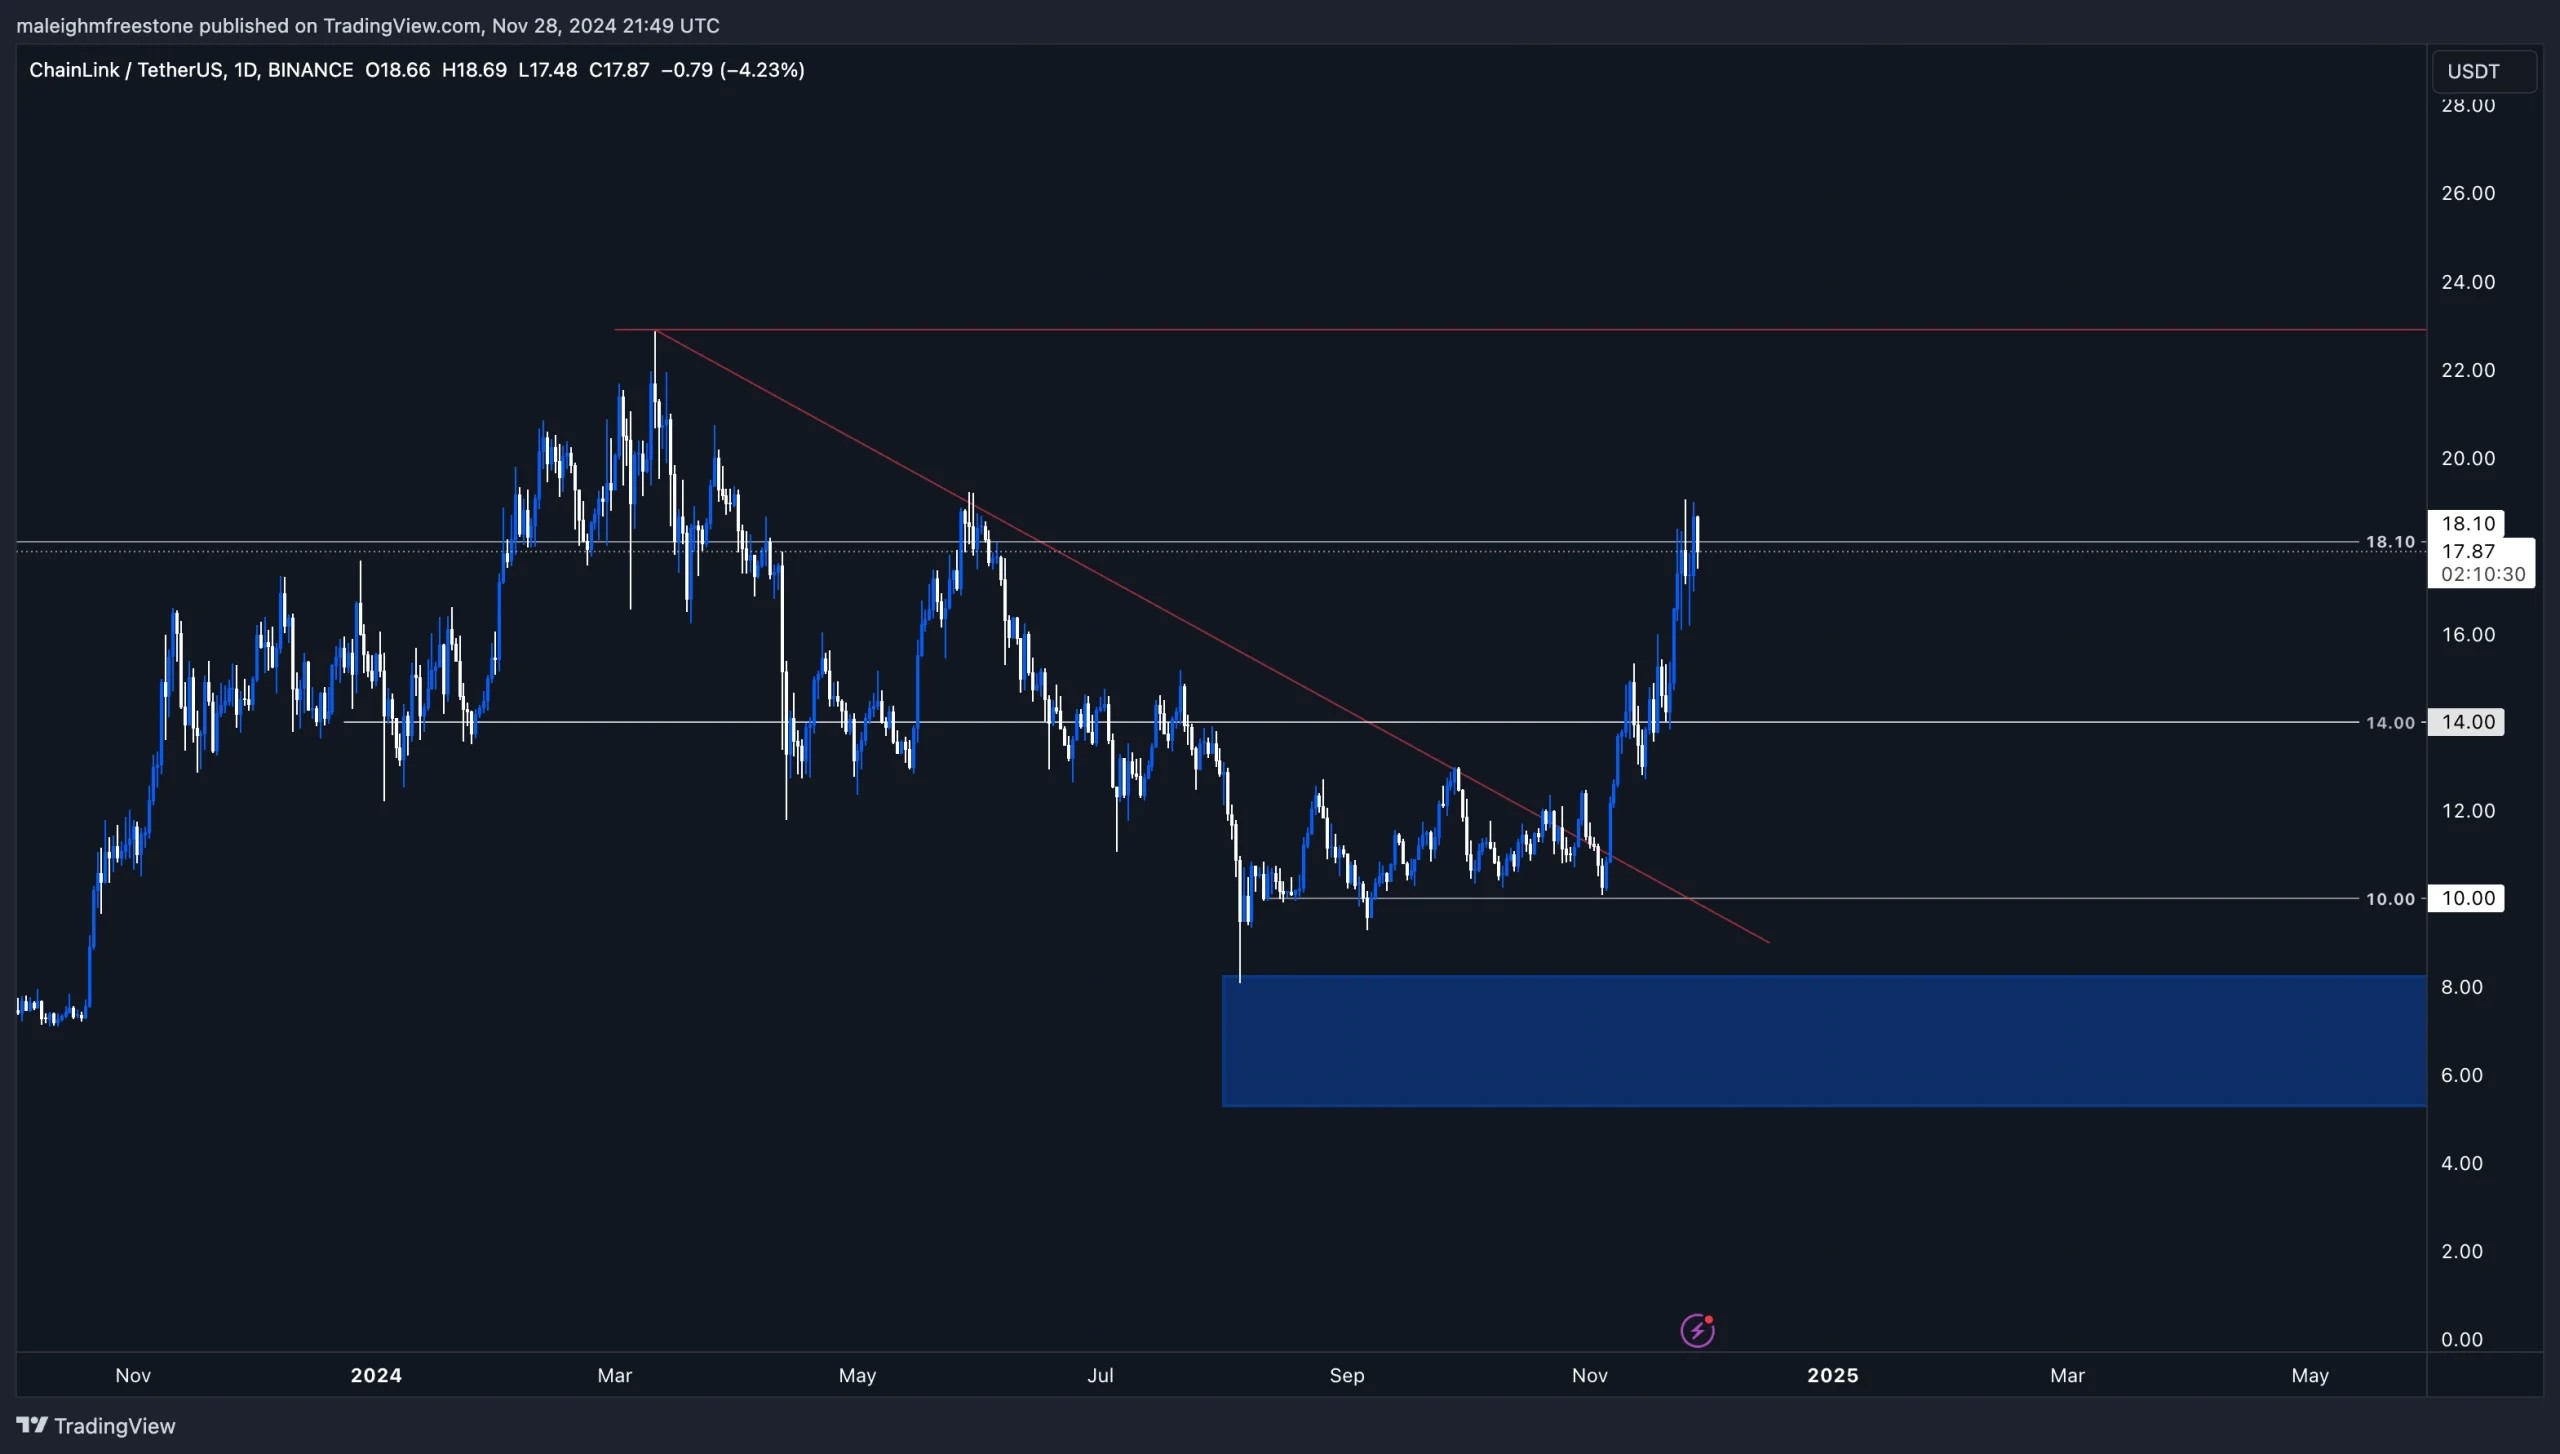
LINK has been moving in an interesting range recently. We saw swing highs on May 10, May 30, and September 27. After that, the price retested the $10 level, which brought in solid demand and pushed the price back up to $18. The $10 level has proven to be a strong support zone, while $18 is where the selling pressure has kicked in so far.Right now, we're watching how LINK plays out between these levels. The $14 zone has been a solid area of support in the past, and if the price comes back to it, we could see a good opportunity to step in. On the upside, $18 is where we'll be keeping an eye out for demand to push LINK further.
Playbook
Objective: Trade LINK based on how it reacts around these key levels.- Spot Accumulation Zone: Look for entries around $14, as it's been a reliable support level historically.
- Breakout Target: If LINK gets above $18 with strength and holds, it could be gearing up for a bigger move to the upside.
Key levels
- $10: A strong support level from the previous bounce.
- $14: Key support level for possible accumulation.
- $18: A level to watch closely for a breakout or rejection.
- Above $18: Look for momentum to build, with higher levels like $22 in sight.
Cryptonary's take
LINK isn't in our main holdings, but the way it's moving between these levels makes it worth keeping on the radar. Watching how it reacts at $14 and $18 will be important. A bounce off $14 offers an entry opportunity, while a strong move past $18 could signal a bigger shift to the upside. We'll keep tracking it to see how this plays out and adjust the plan as needed for those invested.Recommended from Cryptonary


