Save 23% ($351) & Get a Free 1-1 Call with our Team ⏰ : 0d 2h 59m 43s

Technical analysis
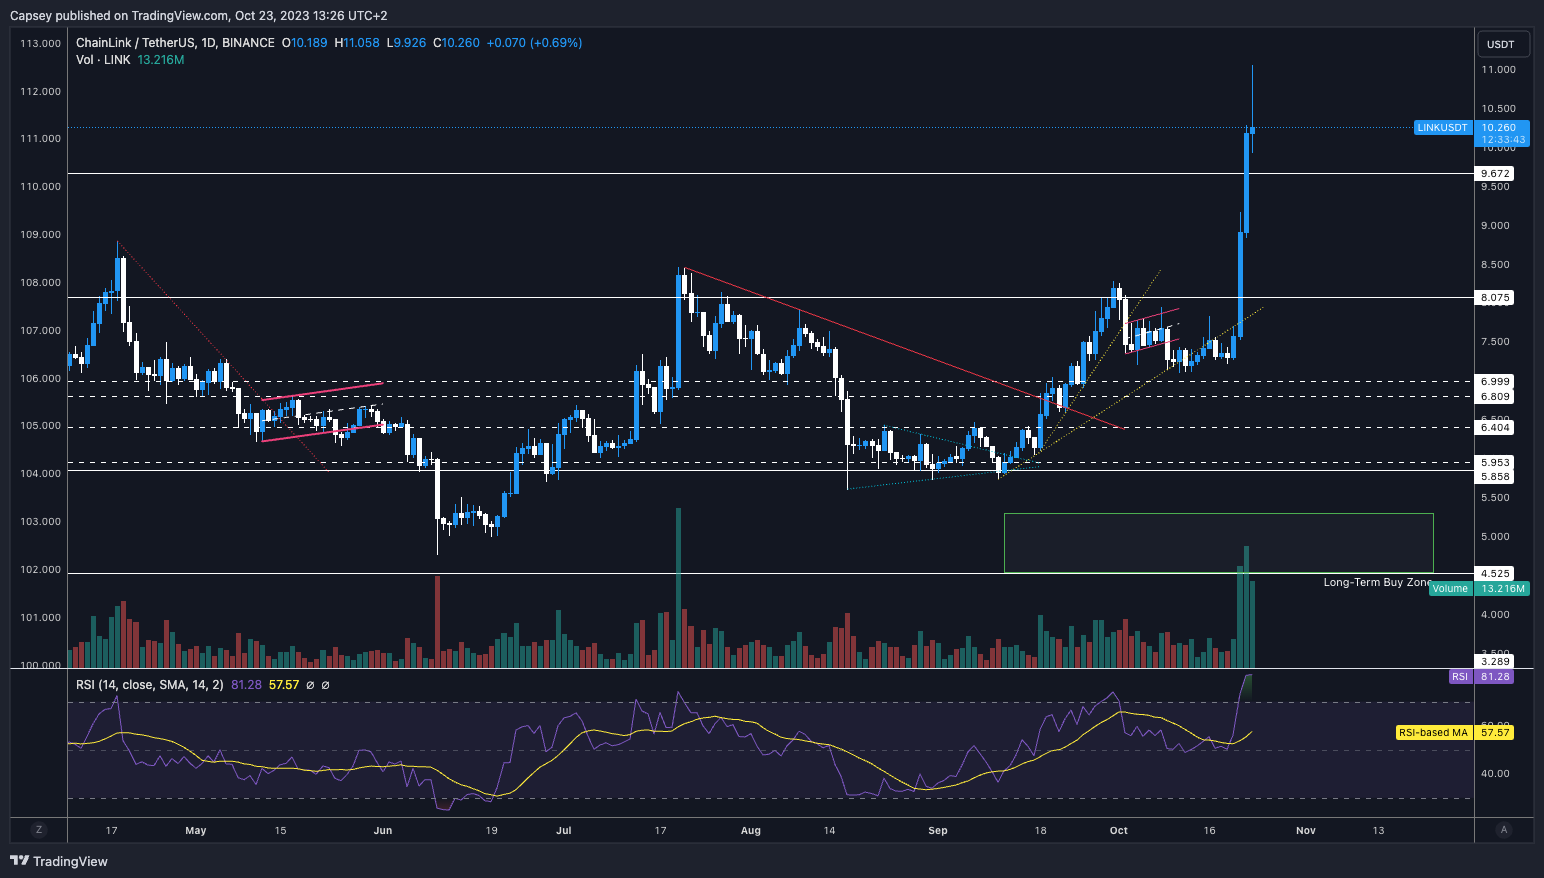
Following the bear flag breakdown, LINK built a base around $7.20, which led to LINK getting a complete lift-off on Saturday, having broken above the horizontal resistance at $8.07 and the $8.50 level, another local resistance. LINK is now up 42% in 3 days.We need to ideally see more data on LINK, i.e. more days worth of price action. Does this form a bull flag? What technical formation does it begin to form at these higher levels, or does it just begin to reject?
Price action-wise, LINK has gone straight up essentially, so it’s hard to see this going more meaningfully higher, and you would expect a retest of a lower level. This may be the $9.67 horizontal level on a more local timeframe.
We need to see more from this in terms of more days' worth of action to use this new information to formulate where LINK’s price may go next.
RSI and funding rates
The daily RSI is at 81… 81. It’s big. This is very over-bought here despite the move being on really strong volume, but just because of how over-bought this is, you have to be cautious on LINK at this price, particularly considering how it has moved up. These kinds of moves are generally unsustainable.What we may need to be aware of and look out for is if price does make local highs, how does this look on the RSI? Does it create that bearish divergence? Getting something like this could set us up for a short.
The funding rate is very positive, indicating many more longs than shorts. In terms of open interest, on average, it’s been at $145M this year. It’s now at $381M. This is being longed hard.
Conclusion on trading LINK
Already, this is beginning to set up for a short. However, we would want to see if today’s upside wick gets more filled (up to, say, the $11 point).We certainly wouldn’t be fomo’ing in here with fresh longs/buys; if anything, we’d be trimming our position and taking profits.
We wouldn’t be surprised to see this back down at the low $8’s in the next 4 to 6 weeks.
Action
- If we owned LINK here, we would be booking profits on some of our size.
- Regarding shorting this, waiting for more information (more days’ worth of price action) before going for it is wiser. However, a lot of the factors are already aligning and are supportive of a short.
- Overall, we remain cautious on this here, and certainly, we’re not looking to add any size to the current price. It is far too overbought for us here.
Recommended from Cryptonary


