Save 23% ($351) & Get a Free 1-1 Call with our Team ⏰ : 0d 2h 59m 43s

Disclaimer: This is not financial or investment advice. You are responsible for any capital-related decisions you make, and only you are accountable for the results.
Chainlink ($LINK):
Overview
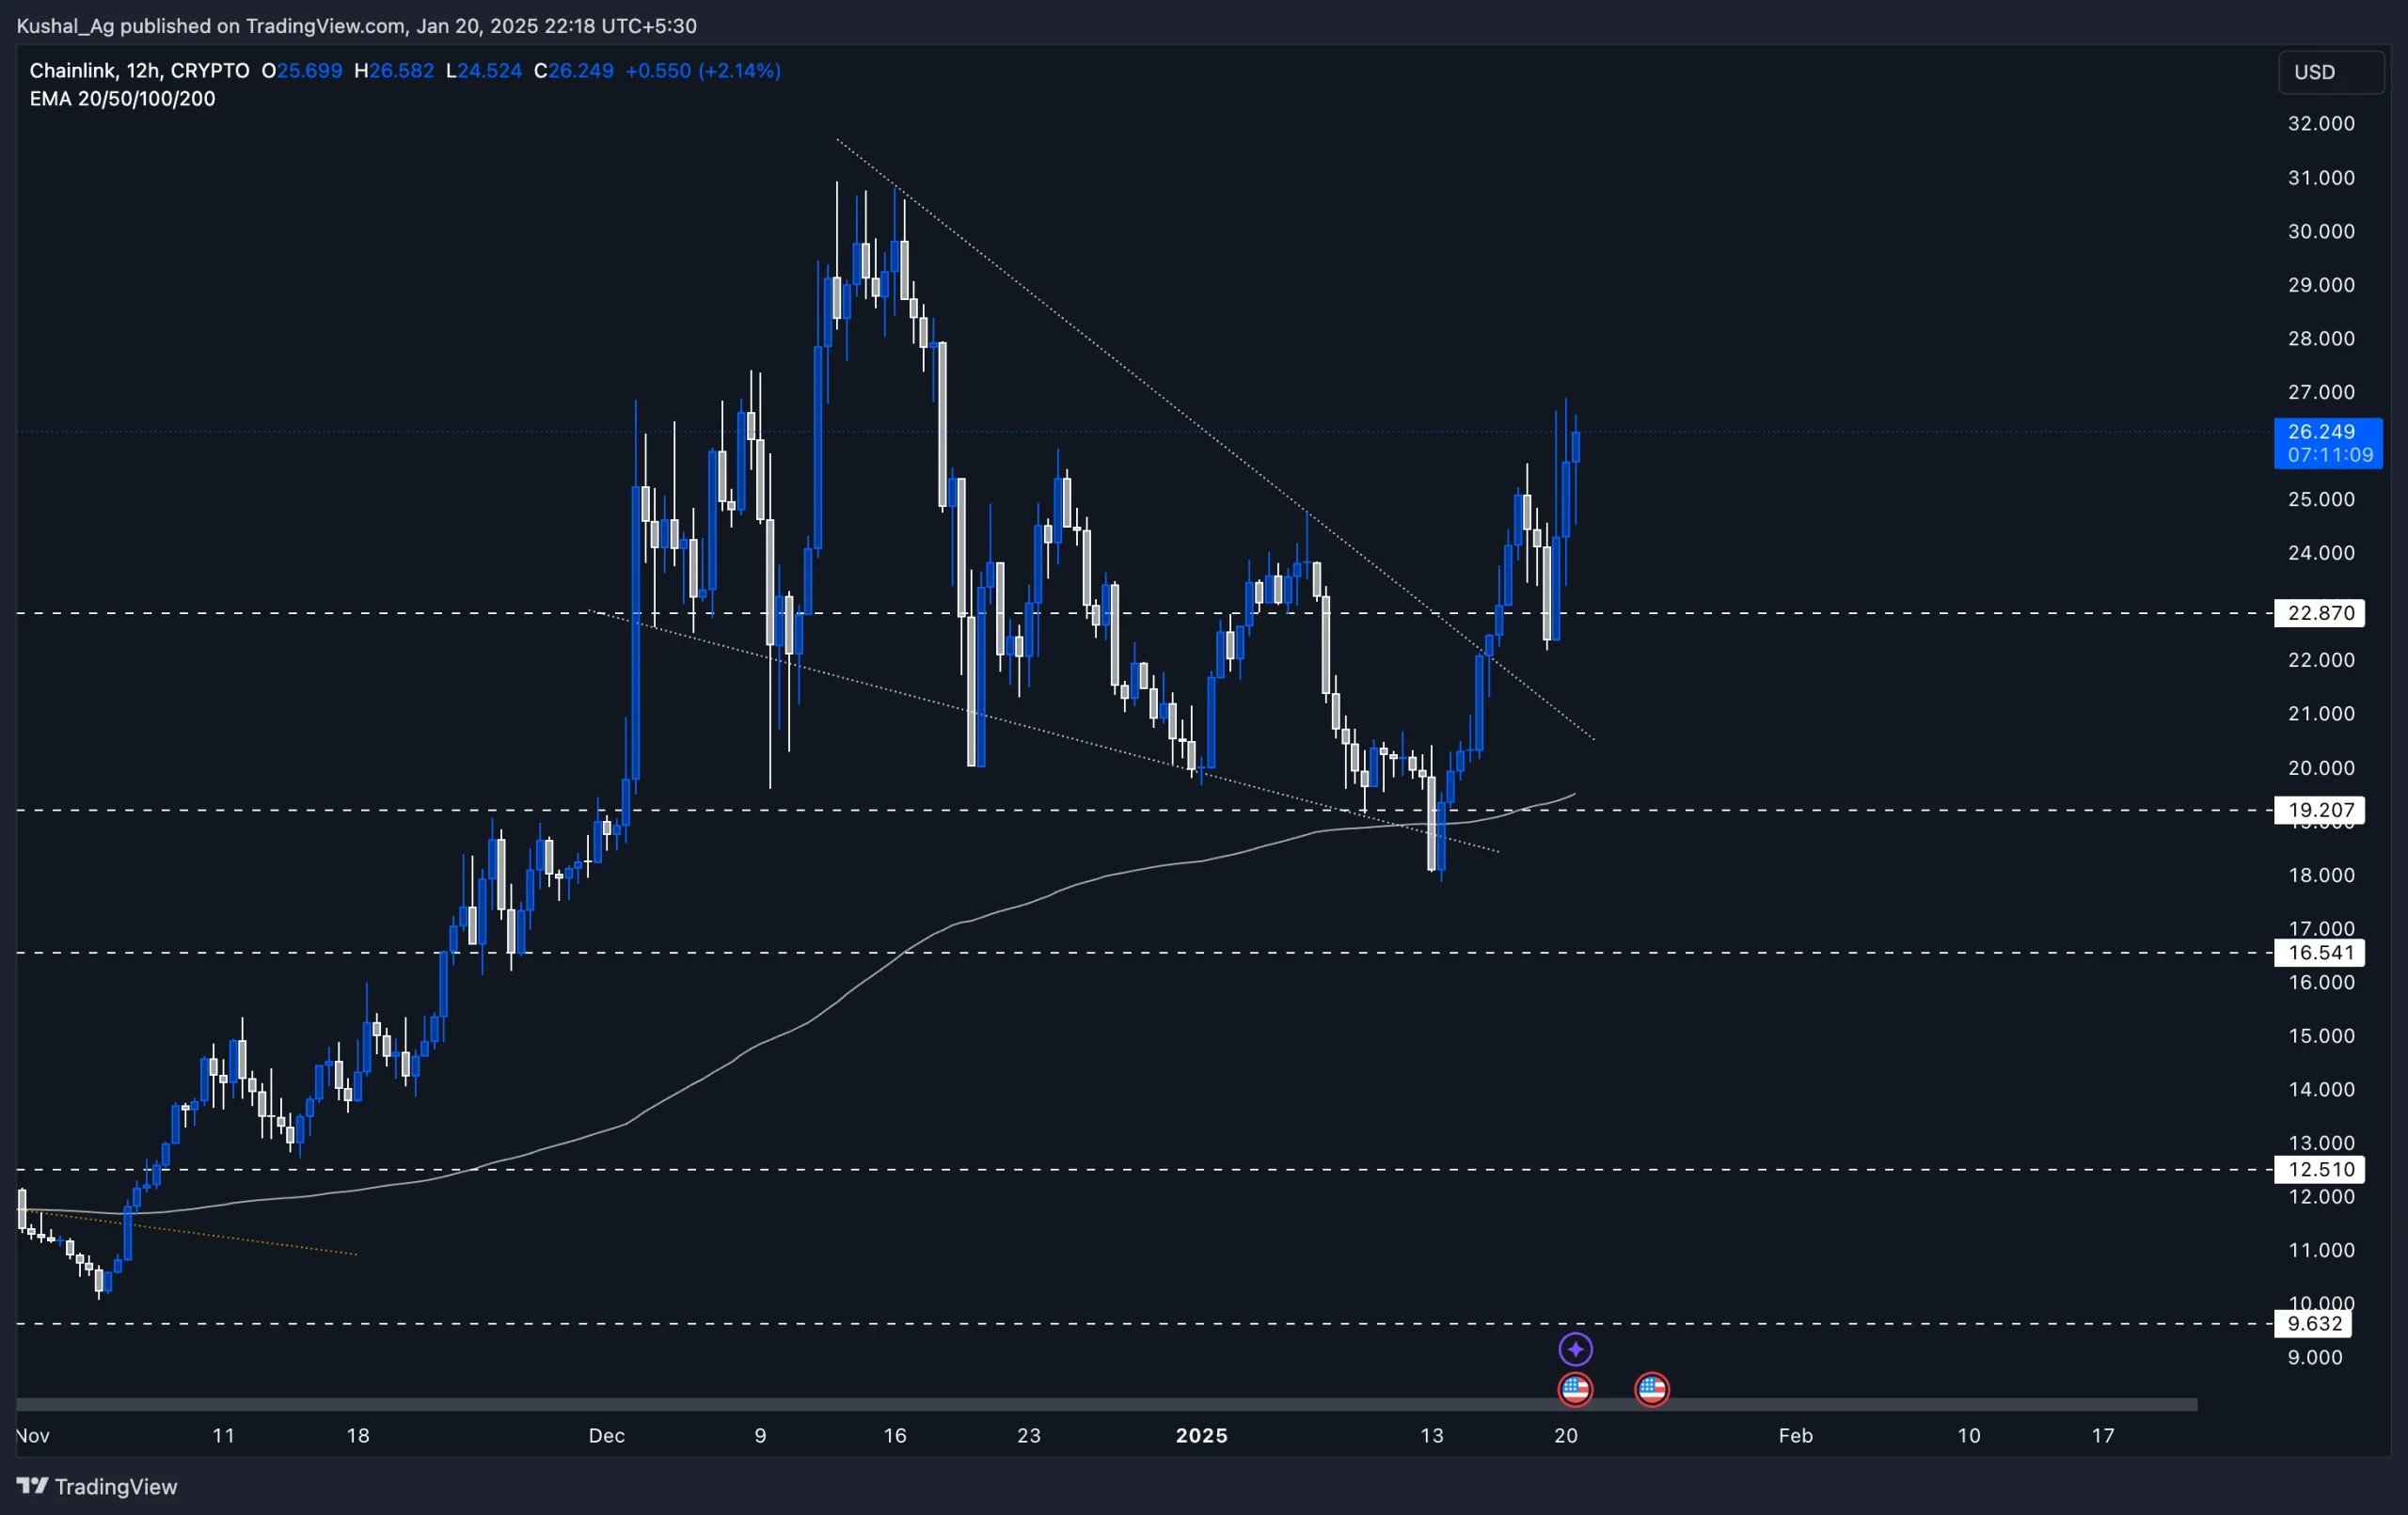
Chainlink ($LINK) has been demonstrating strong bullish momentum recently. After breaking out of a descending wedge pattern that formed following its $30.9 high on 13th December, LINK has established a bullish trajectory. The breakout occurred around the $22.87 region on 16th January, signalling renewed strength in its price action. Currently, LINK is trading at $25.86, poised for another potential upward leg as the broader market remains in a recovery phase.Analysis
Breakout and retracement
- Formation and breakout: LINK was consolidating in a wedge pattern for approximately a month before breaking out decisively above the $22.87 level.
- Higher highs: After the breakout, LINK made a higher high at $25.67 and retraced briefly to retest the $22.87 region, confirming it as a support.
Current market position
- LINK has reclaimed bullish momentum and is trading near its recent high at $25.86, indicating the potential for another leg up.
- The asset’s structure remains solid, with higher highs and higher lows forming consistently, aligning with the bullish sentiment in the wider market.
Confluence with the wider market
- The broader crypto market’s positive momentum due to Trump's inauguration today (20th Jan) adds additional tailwinds for LINK, making it a strong altcoin play for the near term.
Key levels
Support
- $22.87: A strong support level was established post-breakout, confirmed by a successful retest.
- $19.2: A significant secondary support level if further retracements occur.
Resistance
- $30.9: Previous high from mid-December, a long-term resistance level that LINK needs to clear for continued upside momentum.
Cryptonary's take
Chainlink ($LINK) is showing good price action following its wedge breakout and subsequent retest of the $22.87 level. The sustained momentum, coupled with supportive broader market conditions, suggests that LINK could soon sustain above its recent high of $25.67 and potentially target the $30.9 resistance in the medium term.However, maintaining support at $22.87 is critical to preserve the current bullish structure. Traders and investors should watch for potential consolidation in this zone, which could provide an opportunity for accumulation before the next leg up. With its current technical setup, LINK remains a solid asset to monitor as the market trends upward.
Nosana (NOS):
Market context
Nosana (NOS) showed some promising price action during the week of January 1st, printing a relatively bullish candlestick before selling off back into $2.5. This level has proven itself time and time again as a key area of demand. The market seems to magnetize toward $2.5, reinforcing its importance.We expected $3.19 to hold, but it didn’t, so now we’re looking at further downside levels. The focus is on $2.5 and $2, which are shaping up as key attraction points. These levels are where buyers have historically stepped in, making them the areas to watch for accumulation opportunities.

Price action
Recent price movement has created an interesting technical setup:- Demand Levels: $2.5 continues to hold as a solid area for demand, with $2 acting as a secondary level if the market dips further.
- Inverted Head and Shoulders Pattern: A large inverted head and shoulders pattern is forming, with the right shoulder sitting around $3.5. This could be a signal that we’re nearing a bottom, especially if the market starts to move back up from here.
- Double Bottom Potential: Depending on how the market plays out, there’s also the possibility of a double bottom forming if we see a wick lower into the $2.0–$2.5 range.
Playbook
- Spot Accumulation Zone: The $2.5–$2 range is where we’re looking to accumulate. This is where the market has consistently shown demand, and we’ll be keeping an eye on reactions within this range.
- Reversal Patterns: Watch the $3.5 level as part of the inverted head and shoulders structure. A move back up to this level and a breakout could confirm a shift in momentum.
- Double Bottom Scenario: If the market wicks into $2.0 and bounces, this could signal the bottom is in. Keep an eye on price reactions at these lower levels.
Key levels
Support:
- $2.5: Primary demand zone, where the market has consistently shown buying interest.
- $2: A secondary area to watch if $2.5 doesn’t hold.
Resistance:
- $3.19: The previous support level we expected to hold is now a resistance to reclaim.
- $3.5: The right shoulder of the inverted head and shoulders pattern, which could confirm the market turning around.
Cryptonary’s take
NOS is still following the same logical price structure we’ve seen before, with the market dipping back into $2.5 as expected. While the break below $3.19 suggests sellers remain in control for now, the strong demand at $2.5, the potential for an inverted head and shoulders, and the possibility of a double bottom are all signals that we could be nearing the end of the downtrend.For now, the plan is simple: focus on accumulating between $2.5 and $2. If we start to see moves back up toward $3.19 and $3.5, that would confirm we’re on the right track for higher prices. It’s all about being patient and letting the market do its thing.
Recommended from Cryptonary


