Save 23% ($351) & Get a Free 1-1 Call with our Team ⏰ : 0d 2h 59m 43s

This narrative is expected to gain traction as the market turns bullish, likely attracting significant capital towards Lockin.
As the saying goes, money flows where the attention goes, and Lockin appears well-positioned to benefit from this dynamic.
Disclaimer: This is not financial or investment advice. You are responsible for any capital-related decisions you make, and only you are accountable for the results.
Token distribution analysis
The level of decentralisation among the top holders in any memecoin is advantageous for market stability, as it mitigates the potential impact of any single wallet deciding to sell off a significant portion of its holdings.Top 10 holders breakdown
The top 10 wallets hold between 1.4% and 2.1% of the total supply, with the largest wallet holding 2.11%. This level of decentralisation among the top holders is advantageous for market stability, as it mitigates the potential impact of any single wallet deciding to sell off a significant portion of its holdings.
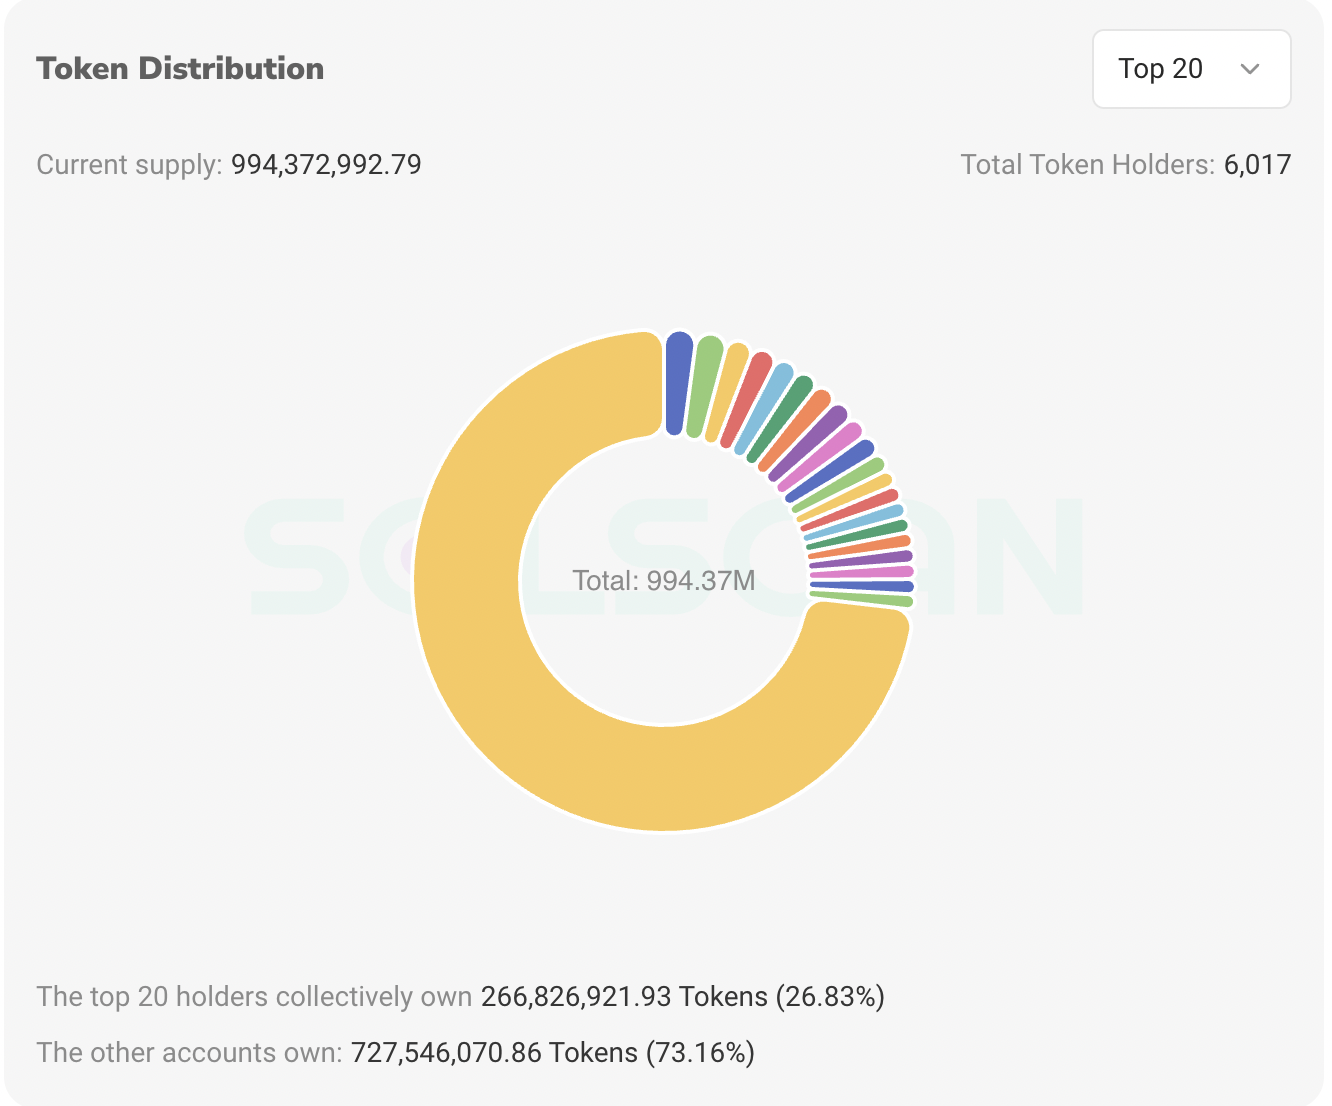
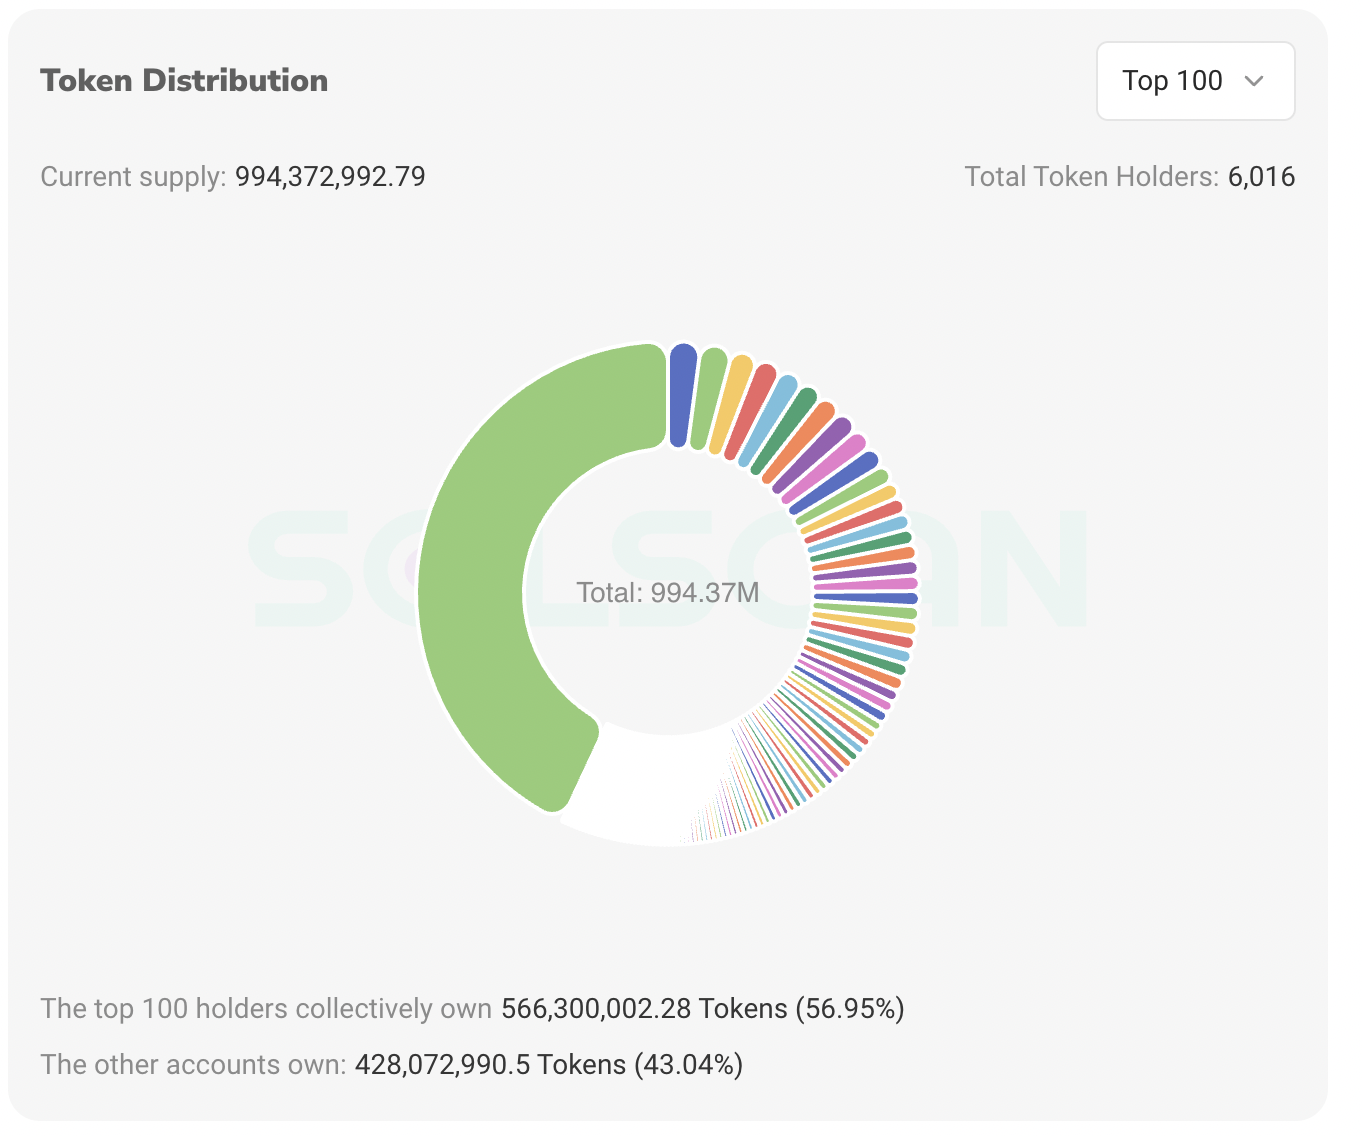
Top 20 and top 100 holders
The top 20 holders collectively own 266,826,921.93 tokens, accounting for 26.83% of the total supply of 994,372,992.79 tokens. The average holding per wallet among these top 20 is approximately 1.34% of the total supply. This relatively low concentration indicates that no single wallet has an outsized influence on the token, reducing the risk of large-scale sell-offs that could impact price stability.When expanding the view to the top 100 holders, they collectively control 566,300,002.28 tokens, representing 56.95% of the total supply. This concentration might seem substantial, but this group's average holding per wallet is about 0.57% of the total supply. This distribution is fairly spread out, indicating that even the largest holders do not have an excessively dominant position, which is beneficial for maintaining a balanced and resilient market.
Bubble map analysis
The bubble map further illustrates the spread of token holdings, with some clustering of larger holders but a significant dispersion among smaller holders. This visual representation confirms that while there are interconnected larger wallets, the majority of tokens are widely distributed, supporting a stable and decentralised ownership base.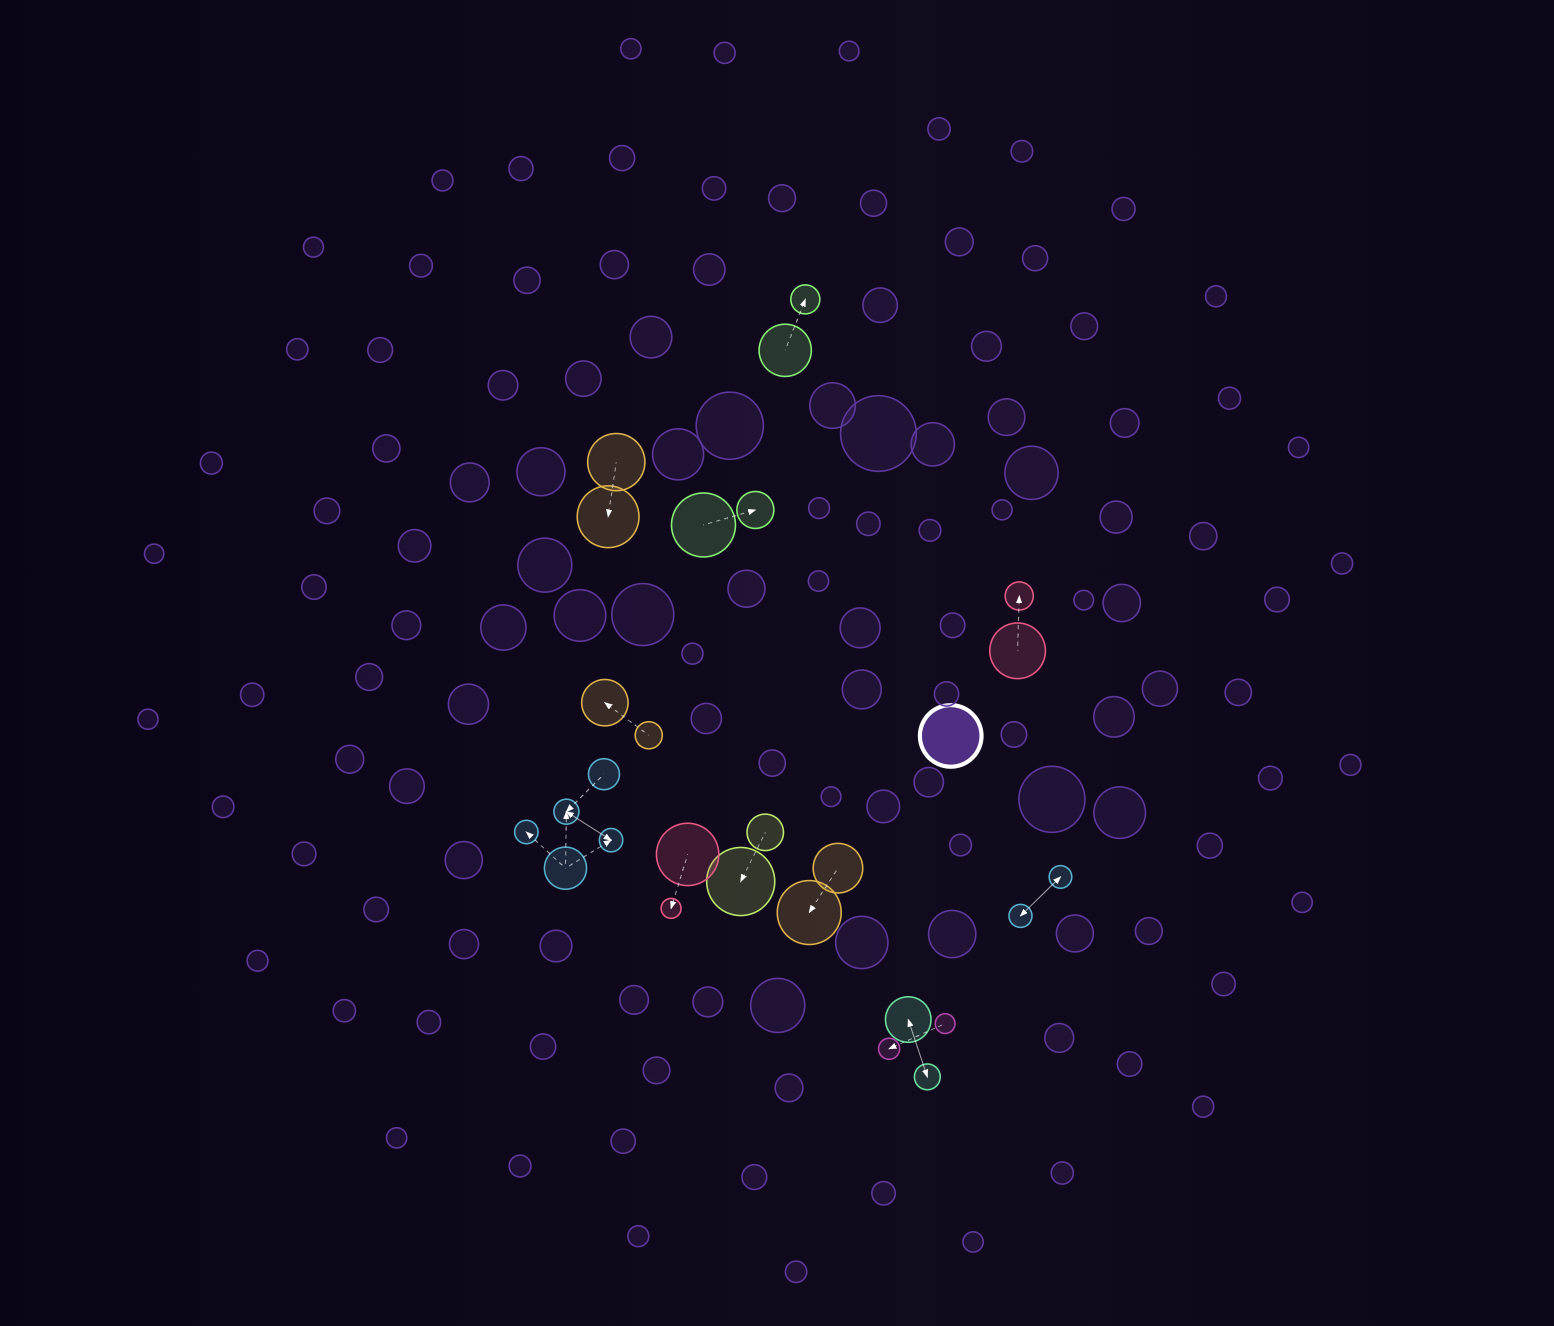
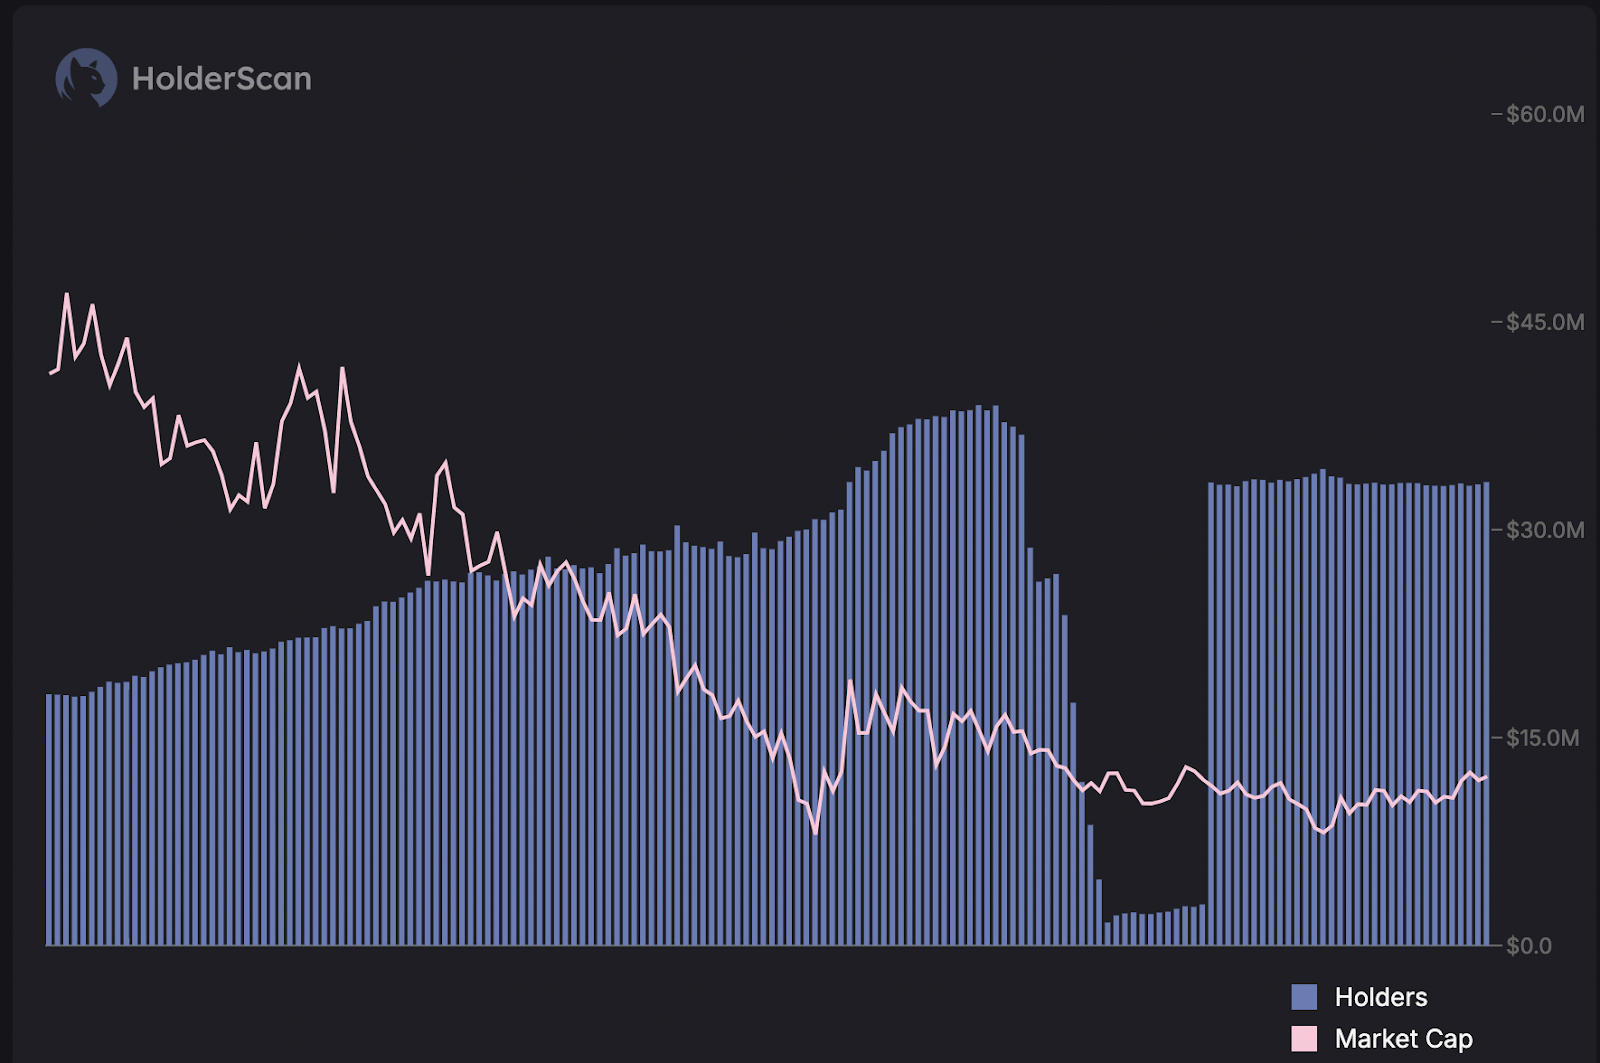
Holder count vs. market cap analysis
The relationship between Lockin's holder count and market cap over the past 30 days offers additional insights into the asset's dynamics. The pink line represents Lockin's market cap, which has dropped from $40 million to under $10 million during this period. Meanwhile, the bar graph representing the holder count shows a steady increase from 5,000 to nearly 6,000 holders.This trend is notably bullish despite the decline in the market cap. The increase in the number of holders while the price is decreasing suggests growing interest and accumulation at lower prices. This divergence indicates strong community conviction and support for Lockin, even during periods of price retracement. The recent dip in the graph is a known technical glitch and should be disregarded.
Historical rally data
Lockin was launched on March 16th with a modest market cap of just $1,750. On the day of its launch, it surged to a market cap of $32,000, representing an impressive 1800% increase that immediately captured the attention of buyers. However, following this initial spike, Lockin traded sideways and even dipped below its launch market cap for the next 50 days. Then, in a remarkable turn, the token experienced a massive rally, delivering gains of over 20,000%-an astonishing performance in such a short period.In the 5 months since its launch, Lockin has demonstrated its capacity for explosive growth by delivering five significant pumps. Each of these rallies has effectively established new local bottoms, allowing the token to maintain a bullish structure. The blue boxes on the chart represent these pumps from low to top, with the percentage gains clearly marked above each box. This historical performance underlines Lockin's potential for making substantial gains in relatively short timeframes, reinforcing the bullish outlook for the asset.

Historical pullback analysis
Following the initial launch pump, Lockin experienced a drastic pullback, dropping by about 95% to a level even lower than its launch price. This significant downturn lasted for more than a month and a half, testing the resolve of early investors. However, the subsequent rally set a solid base for Lockin, indicating a resilient community despite the severe pullback.The second pullback was even more intense, with a 97% drop during the third wave. Despite this, the community held strong, and Lockin managed to make a new higher high in less than 30 days. In total, Lockin has gone through six drastic pullbacks since its launch, with the most recent one being an 88% decline from a $50 million market cap to just above $5 million. These pullbacks are visually marked by red boxes on the chart, with the percentage value of each pullback noted above the box.
These historical pullbacks highlight a recurring pattern in Lockin's price action, where strong recoveries follow significant declines. This resilience suggests that these pullbacks are part of a larger cycle, potentially setting the stage for the next move higher. The ability of Lockin to recover from these major pullbacks is a crucial aspect of its market behaviour and is something that investors should closely monitor.

Technical analysis
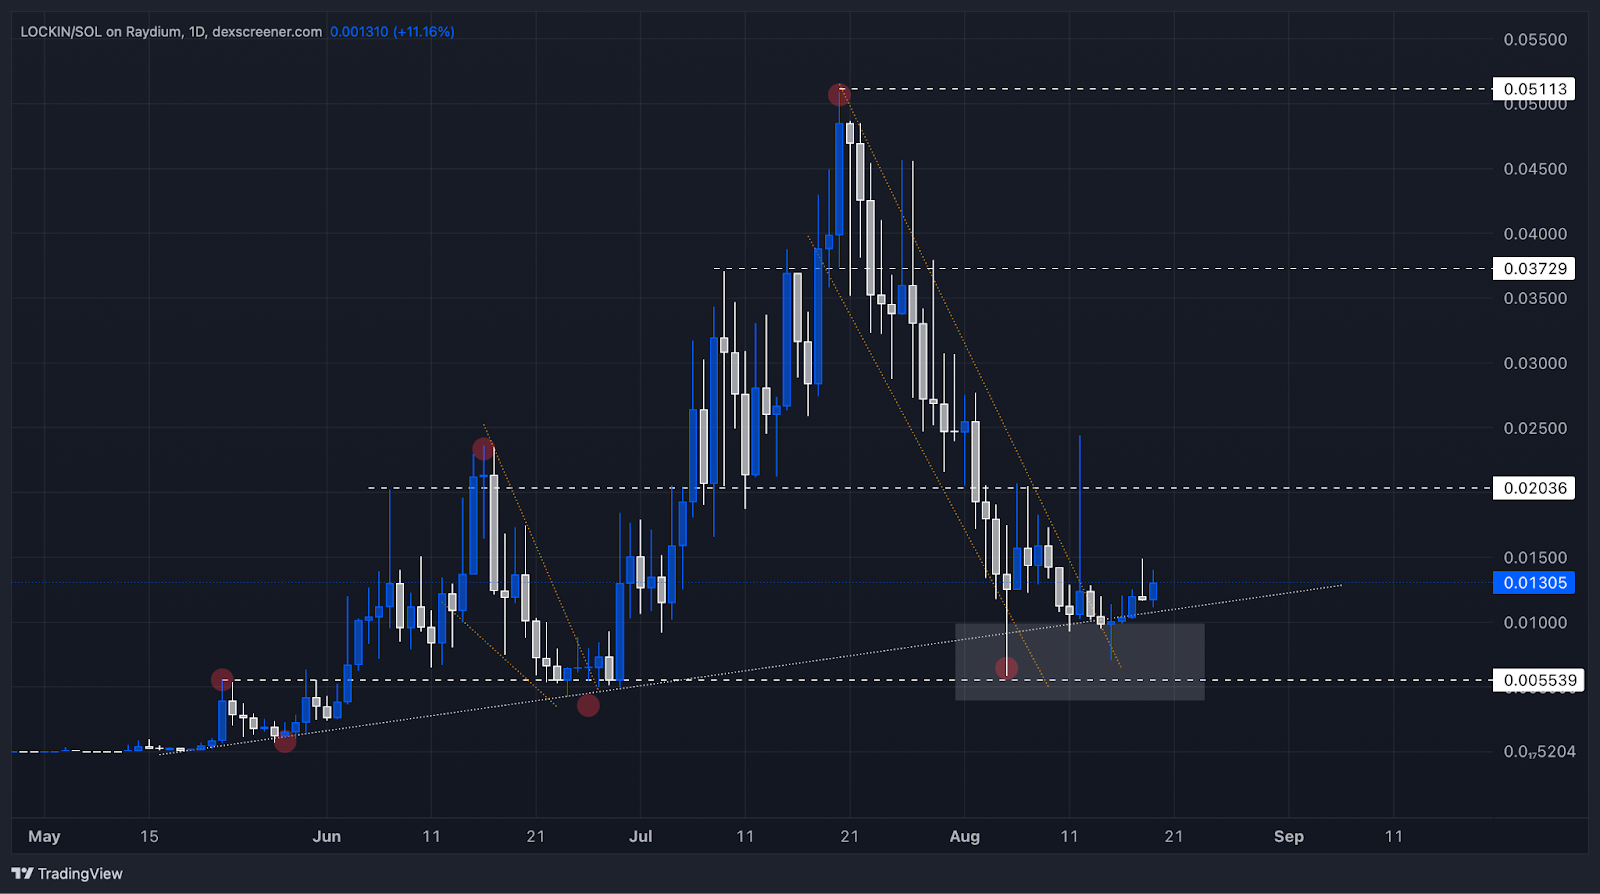
Lockin has been demonstrating a strong bullish structure on the daily timeframe. The chart shows a series of prominent higher highs and higher lows, highlighted by red dots. The ongoing uptrend is further reinforced by a white trendline, which has been consistently holding the price above key levels.- Massive rally: In its most recent major move, Lockin surged by 1000% in less than a month, starting in late June at $0.0045 and reaching a peak of $0.05 by July. This rapid rally marked a new higher high for Lockin, showcasing the asset's potential for explosive growth.
- Accumulation zone: Currently, Lockin is trading around $0.013. The grey box, spanning from $0.004 to $0.01, represents an ideal accumulation zone. This area is crucial for traders looking to enter or add to their positions. The $0.0055 level within this zone acts as a strong support, where buying interest has historically emerged.
- Resistance levels: On the upside, the $0.02 and $0.037 levels are significant resistance points. Breaking through these could pave the way for Lockin to retest its previous all-time high (ATH) of $0.05.
- Potential for price discovery: The ATH is only 300% away from the current price, and with a market cap of just $50 million, Lockin presents a compelling swing trade opportunity. Should the price break above these resistance levels, we could see Lockin enter price discovery mode, potentially making new highs.
Cryptonary's take
Lockin's token distribution demonstrates a healthy and decentralised ownership structure. With the average holding per wallet in the top 20 and 100 groups being relatively small, the risk of market manipulation is reduced. This even spread of tokens across a broad base of holders contributes to market resilience and stability, making Lockin an attractive asset for long-term investors.Moreover, the increasing holder count against a backdrop of declining market cap signals strong community support and interest in Lockin, even during price corrections. This resilience, combined with the positive distribution metrics, points to a solid foundation for future growth. Investors should keep an eye on these trends as they indicate the potential for a bullish reversal as market conditions improve.
As the market narrative around Lockin continues to strengthen, backed by a strong technical structure and growing community support, Lockin is positioned as a promising candidate for significant upward movement in the upcoming market cycle. A resilient holder base, solid market structure, and compelling growth potential make Lockin an asset to watch closely.
Recommended from Cryptonary


