Save 23% ($351) & Get a Free 1-1 Call with our Team ⏰ : 0d 2h 59m 43s
There's also a video from our Head of Analysis explaining macro data correlations, providing examples of data prints, and explaining how that translates into crypto market price movements.
Alongside this, we delve into the setup for macro and, therefore, crypto going forward. Again, guys, the macro environment is super key in that it is the biggest driver of the crypto markets.
Ready to make sense of where the market is heading?
Let's dive in.
TLDR
- Macroeconomic remains data is the biggest driver of crypto markets currently.
- The 2021 government stimulus fueled the crypto rally until the Fed started hiking rates in 2022.
- After weathering 5% rate hikes in 2022-2023, markets show signs of recovery.
- Improving liquidity conditions in Q3 could kickstart a euphoric uptrend for crypto.
- Solana (SOL) will likely lead the next bullish crypto breakout, with large caps to follow.
Disclaimer: This is not financial or investment advice. You are responsible for any capital-related decisions you make, and only you are accountable for the results.
How the economic data affects crypto
In assessing the economic data and its impacts on markets, we'll first take a zoomed-out view and then a zoomed-in view.On a zoomed-out view, it has essentially dictated everything.
In 2021, there was a huge government stimulus to help prop markets and consumers up after the economic data fell off a cliff as the world moved into a new Covid world.
This excessive stimulus fuelled the economy and markets through 2020 and 2021 until the Fed and other Central Banks had to begin raising interest rates in an attempt to squash the excessive demand in the economy (which they essentially created) and bring down what looked to be runningaway inflation.
When Fed Chair Powell forward-guided markets in late 2021 that a rate hiking cycle would be coming, markets entered a year-long bear market from late 2021 to late 2022. A rate hiking cycle means the dollar is up, bond yields are up, and risk assets (crypto and the S&P) are down.
Since then, markets have watched with a keen eye on whether inflation was coming down and if something in the markets or the economy would break in the meantime.
For the most part, markets and the economy have held up despite interest rates increasing by 5.00% in 2022 and 2023. Markets are now at the point where recovery is well underway, and risk assets are at all-time highs.
In the screen recording below, we'll examine a more zoomed-in view, assessing recent data, what that meant, and how crypto has moved since then.
The data and the moves in the dollar index, bond yields, S&P, and crypto are all correlated. Hence, if you can figure out the macro data, you can predict crypto correctly.
Examples using recent data in the screen recording are below.
Large Cap Index with SOL
If we look at the Large Caps Index (including SOL) in the 3D timeframe, we can see that we bounced nicely from the support at $65, and now we're retesting the underside of the pennant area breakdown at $87.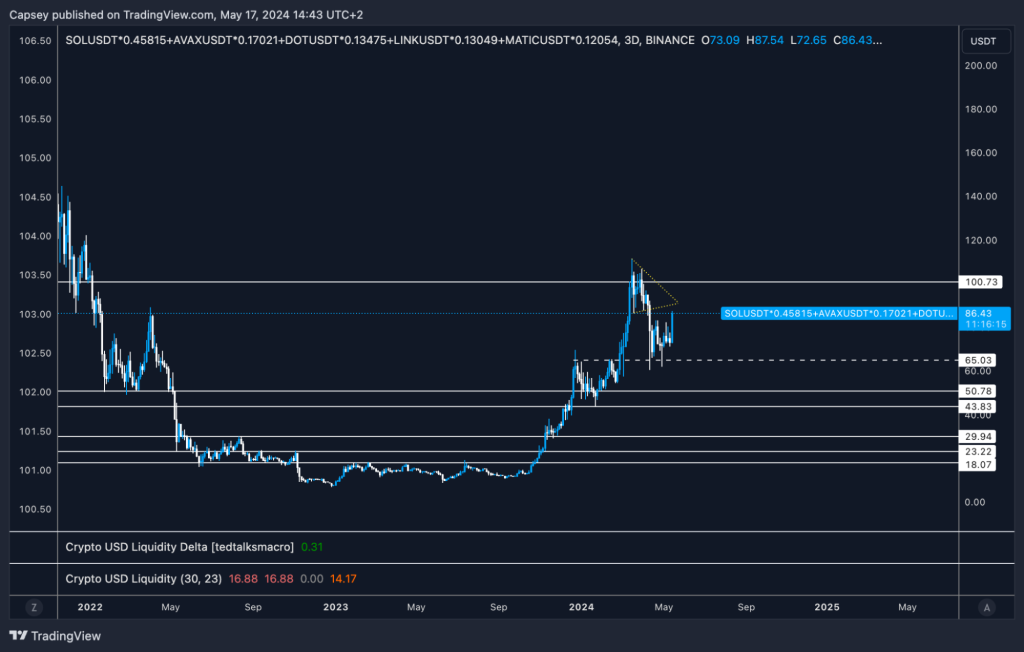
We probably don't expect this Index to break up majorly higher in the short term, but it will likely retest $87 and remain range-bound for more weeks. A reclaim of $87 and then a break above $101 would signal the full bullish reversal, and we'll likely see SOL well north of $200 again and on its way to $250.
Large Cap Index without SOL
The Large Caps Index without SOL obviously looks far less bullish from a technical analysis point of view, just ranging between $15 and $18.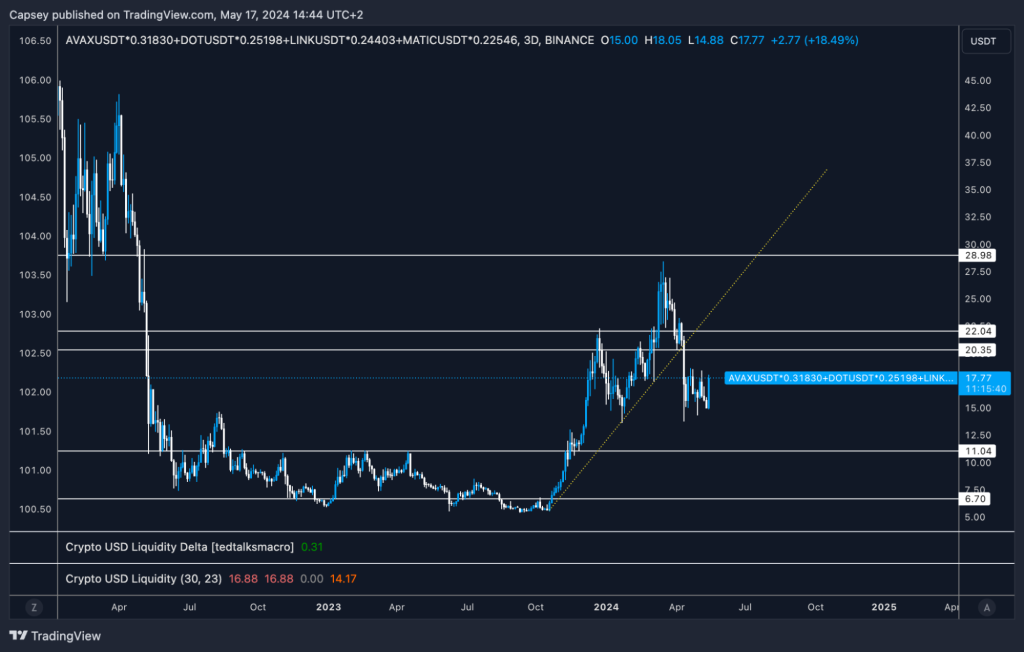
The bullish reversal will come when this Index can get back above $20 and then $22, although that currently seems a long way off, and this Index likely points towards more range-bound price action for more weeks at least.
Both indices above give us some clues. SOL likely leads, while the other large-cap coins will follow SOL. However, they're probably still 1-2 months away from really breaking out again and retesting this cycle's price highs.
BTC
So far, I (Tom) think this is a really solid move, with BTC seeming to get above (break above) the bull flag pattern it has been in for several months.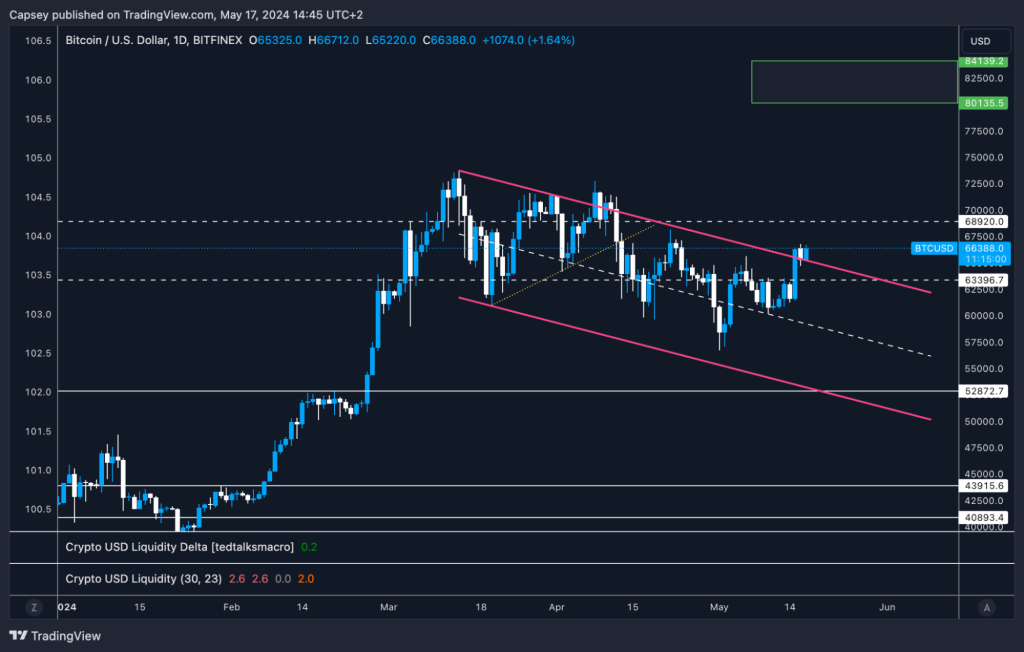
Price is now pulling back a tad (expected, considering price moved up $5k in 1 daily candle on Wednesday), and price is now retesting the top border of the bull flag, hopefully flipping this border into support for price to move higher from there.
So far, all of this looks very bullish, and I (Tom) wouldn't be surprised if BTC breaks out and touches $70k in the next week or two. An invalidation would be if price falls back into the bull flag and loses the horizontal support at $63,300. That, for me, is a key level.
Cryptonary's take
While this may seem somewhat boring, for now, and until liquidity conditions improve (potentially in Q3, we still prefer the barbell portfolio of BTC, ETH, SOL, WIF, and POPCAT.As we move into Q3, and if liquidity conditions improve, we'll look to divest from some of our BTC and ETH and invest in more altcoins and other meme plays.
But for now, we keep it simple, and we still believe we have a lot more time before the bull market kicks on and moves into the euphoria phase.
Recommended from Cryptonary


