Save 23% ($351) & Get a Free 1-1 Call with our Team ⏰ : 0d 2h 59m 45s
Disclaimer: This is not financial or investment advice. You are responsible for any capital-related decisions you make, and only you are accountable for the results.
BTC:
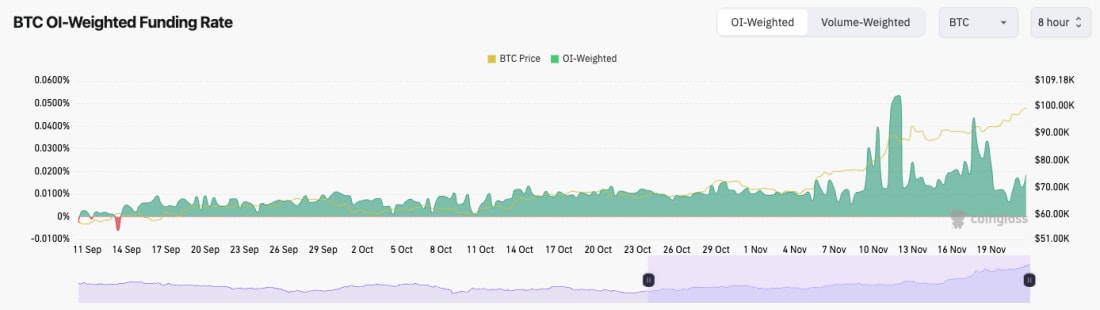
- Open Interest (the amount of leverage in the system) remains really high.
- The Funding Rate is higher than normal, but it's not currently majorly overheated. We have also seen that it has got too high over the last week (twice), and it's pulled off again without the market pulling back and flushing the leverage out.
- With Open Interest as high as it is, it's likely we will see a flush out at some point, but that may take time.
Technical analysis
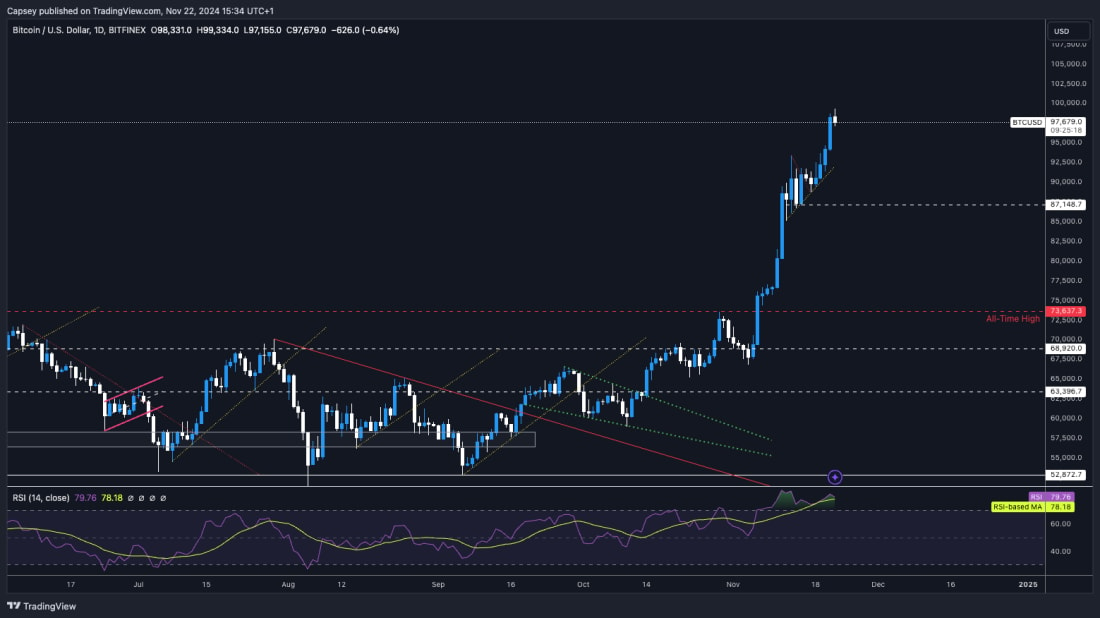
- Bitcoin broke out from its bullish pennant and broke to the upside, just stopping shy of the psychological $100k mark.
- The small consolidation of price action in the low $90k's can likely help as support if BTC were to see a pullback.
- Below $91k, the next horizontal support would be at $87,000.
- On the upside, the resistance is now at the psychological level of $100k.
- The RSI has printed a bearish divergence (higher high in price, lower high on the oscillator). A breakdown target for this might be between $91,000.
Get the latest Bitcoin price prediction—dive into our detailed analysis to stay one step ahead!
- Next Support: $91,000
- Next Resistance: $100,000
- Direction: Neutral
- Upside Target: $110,000
- Downside Target: $91,000
Cryptonary's take
Similarly to our last update, BTC is grinding on higher as we're in this euphoria part of the cycle. However, it is very overbought here, and it has printed bearish divergences. This usually results in a bearish outcome. But because we're in the euphoria period, it's possible that the price will also continue grinding higher.We're of the opinion that a pullback might be on the cards quite soon, but we'd be buyers of any meaningful pullback (7-15%). We expect prices to keep grinding higher, but we'll see a number of pullbacks along the way. We believe the odds of a pullback have increased here, and we wouldn't be surprised if we got one in the next few days to a week.
ETH:
- ETH's Open Interest is still at all-time highs, having really kicked up higher over the last week. It's likely we'll see a shakeout at some point. However, this may last for more days/weeks.
- The Funding Rate has also increased back to its recent highs. This indicates that positioning is net Longs here, meaning Longs are potentially vulnerable to a flush-out.

Technical analysis
- ETH looks really interesting here.
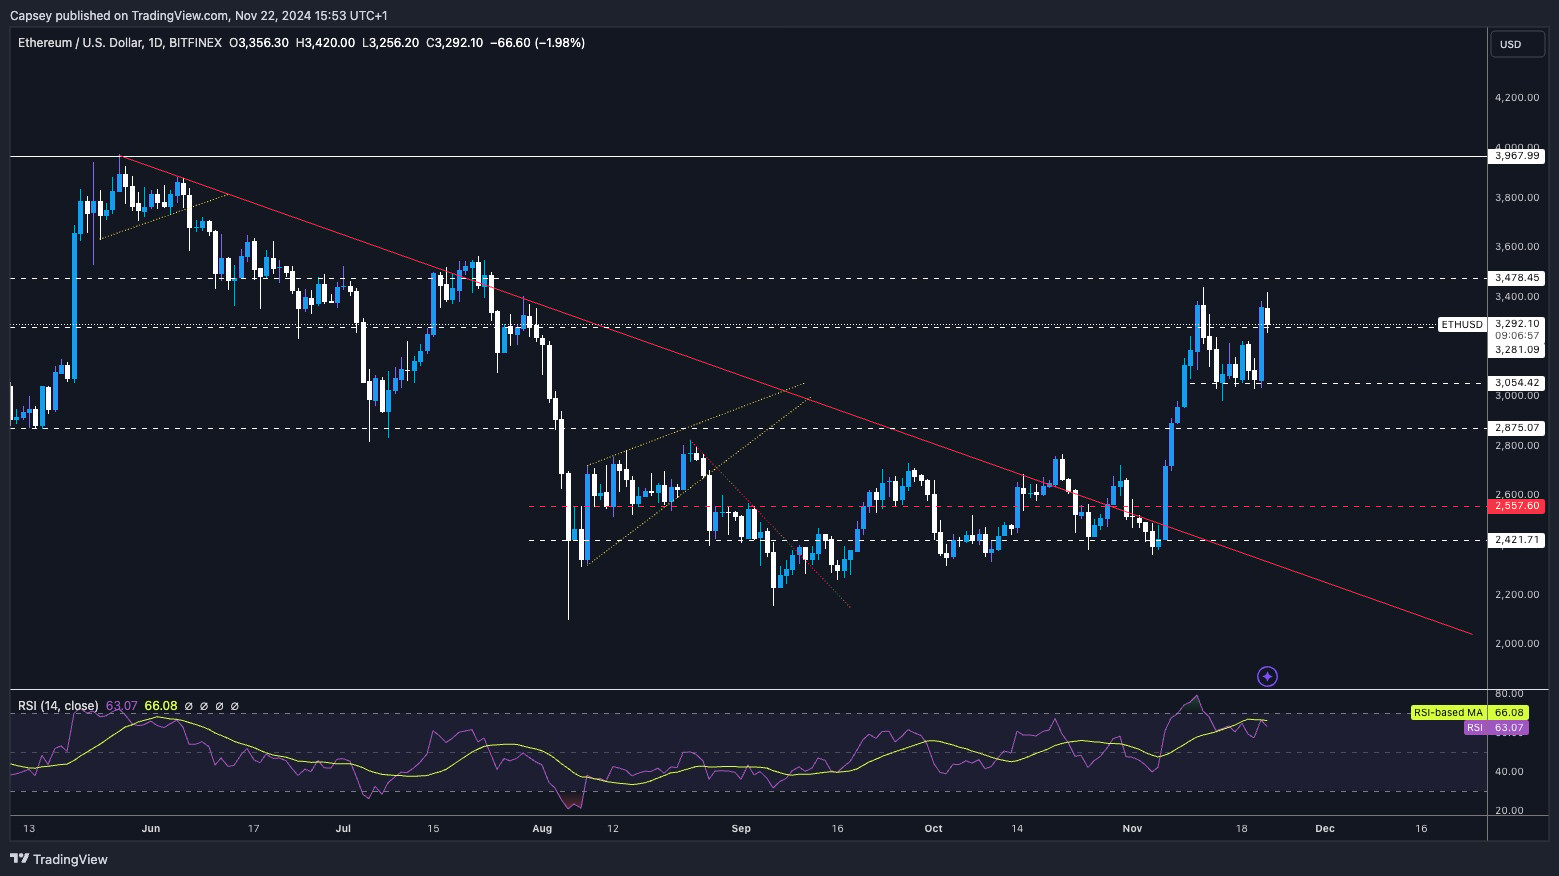
- ETH looks to be potentially forming a double top into the $3,400 area just shy of our $3,480 horizontal resistance.
- ETH did manage to find support locally at $3,050 and into $3,000, as we thought might be the case, with $3,00 being a psychological level.
- ETH is currently sitting on top of local support at $3,280. If ETH can hold support at $3,280, this improves the setup and enables ETH to possibly run to $4,000 upon a breakout of $3,480.
- If ETH were to lose the $3,000 level, then we'd expect the major support of $2,875 to hold.
- ETH's RSI has pulled back from overbought territory, and it also has printed any bearish divergences (unlike BTC).
- Next Support: $3,000
- Next Resistance: $3,480
- Direction: Neutral
- Upside Target: $4,000
- Downside Target: $2,875
Cryptonary's take
ETH is currently in an interesting spot between a key range of $3,000 to $3,480. We'd expect, with the bullish market we have, that ETH can reach $4,000 again in the coming weeks/months. We'd be buyers on dips, although we would remain underweight ETH against SOL, and we still favour being significantly overweight SOL. We expect ETH to move up with the rest of the market, but we still don't feel that it'll outperform other assets (SOL especially).SOL:
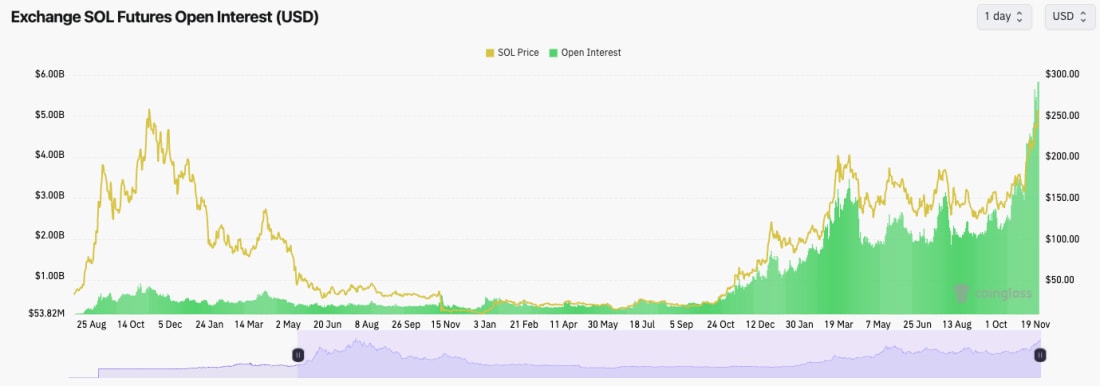
- SOL's Open Interest is at all-time highs on both USD value and the number of coins. There is a lot of leverage built up here.
- SOL's Funding Rate has also kicked up again over the last 24 hours. This indicates that there is a bias to be Long, with Longs being over-levered here.
Technical analysis
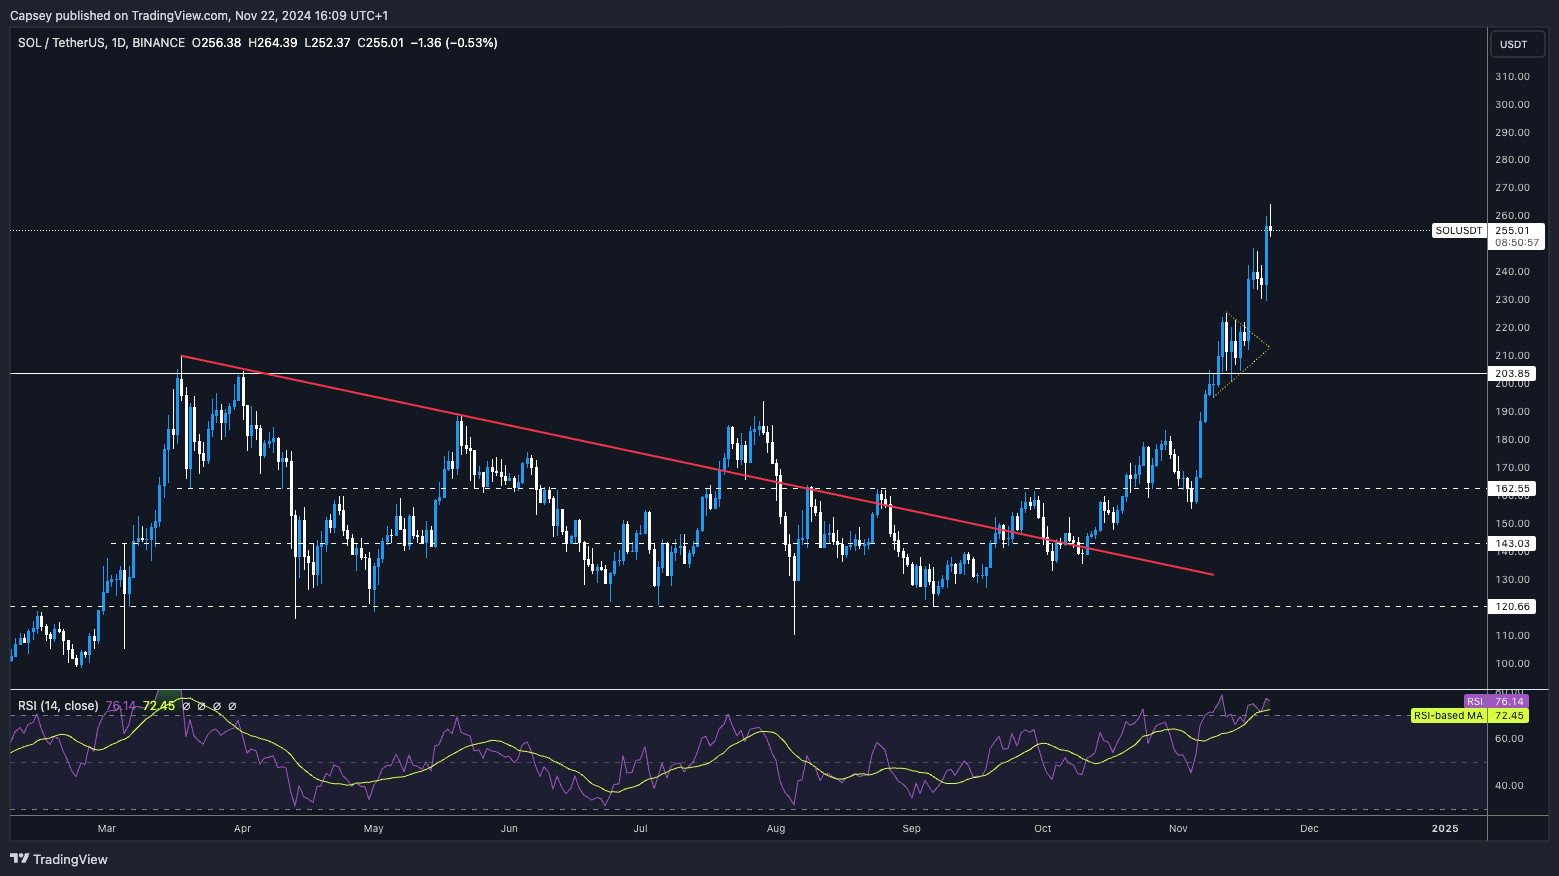
- SOL broke out perfectly from the bull pennant, having used the $203 horizontal support as a floor to go higher.
- SOL initially printed a bearish divergence; however, that has now been invalidated. But, the RSI remains in very overbought territory.
- We would expect the area between $220 and $230 to act as a new support zone for the price, assuming there is a pullback.
- Resistance is likely to remain at an all-time high between $255 and $260.
Stay updated on Solana price prediction—explore our full analysis for the latest market insights.
- Next Support: $220 - $230
- Next Resistance: $260
- Direction: Neutral
- Upside Target: $300
- Downside Target: $220 - $230
Cryptonary's take
Overall, the move-up is really nice, and we do expect it to continue over the coming weeks/months. However, in the short term, the market is overbought, and therefore, we are potentially expecting a pullback. And for SOL, that might look something like the $220 - $230 area. But, even if we're right in calling for a short-term pullback, we wouldn't be looking to sell here. Our SOL sell targets are much higher. Let's get SOL to $400, and then we'll reassess the sell targets. For now, we're expecting the zoomed-out uptrend to continue.WIF:
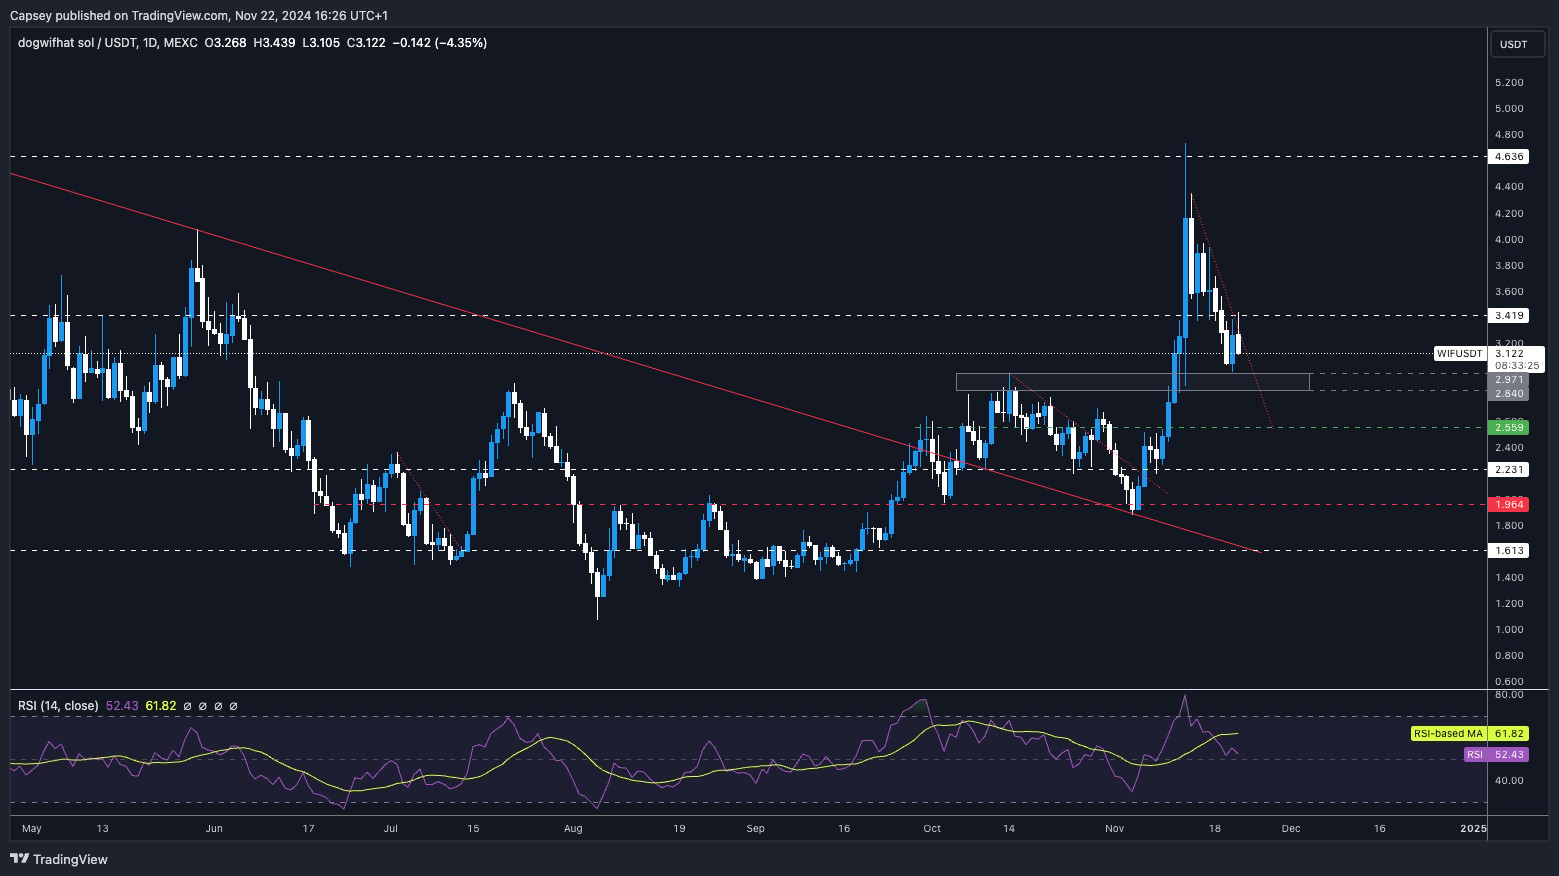
- WIF has pulled back substantially from the major horizontal resistance at $4.60, and it has nearly eroded all of its Coinbase listing gains.
- We initially thought that the $3.40 horizontal level would act as support, but unfortunately, the price broke below.
- We have now identified a support area between $2.84 and $2.97. We expect that this area will be a major support, and we'd be very surprised if the price broke beneath it.
- To the upside, the horizontal level of $3.40 will likely now act as short-term resistance.
- The RSI has reset substantially, and it is now back in the middle territory.
Don’t miss the latest dogwifhat (WIF) price prediction—explore our insights to stay ahead in the crypto market.
- Next Support: $2.84 - $2.97
- Next Resistance: $3.40
- Direction: Neutral
- Upside Target: $3.40 (then $4.00)
- Downside Target: $2.84 - $2.97
Cryptonary's take
We were surprised to see WIF break below $3.40, but now, the closer it gets to $3.00, the more undervalued it looks, particularly as SOL has broken out of its range and reached new highs. If WIF were to visit the Grey box between $2.84 and $2.97, we'd be buyers of this range. Other than that, we continue to hold WIF Spot positions, and really, we're expecting WIF to range here for now. This is until retail comes back and begins dipping into new cycle meme coins. That's when we'd expect the breakout to the upside.POPCAT:
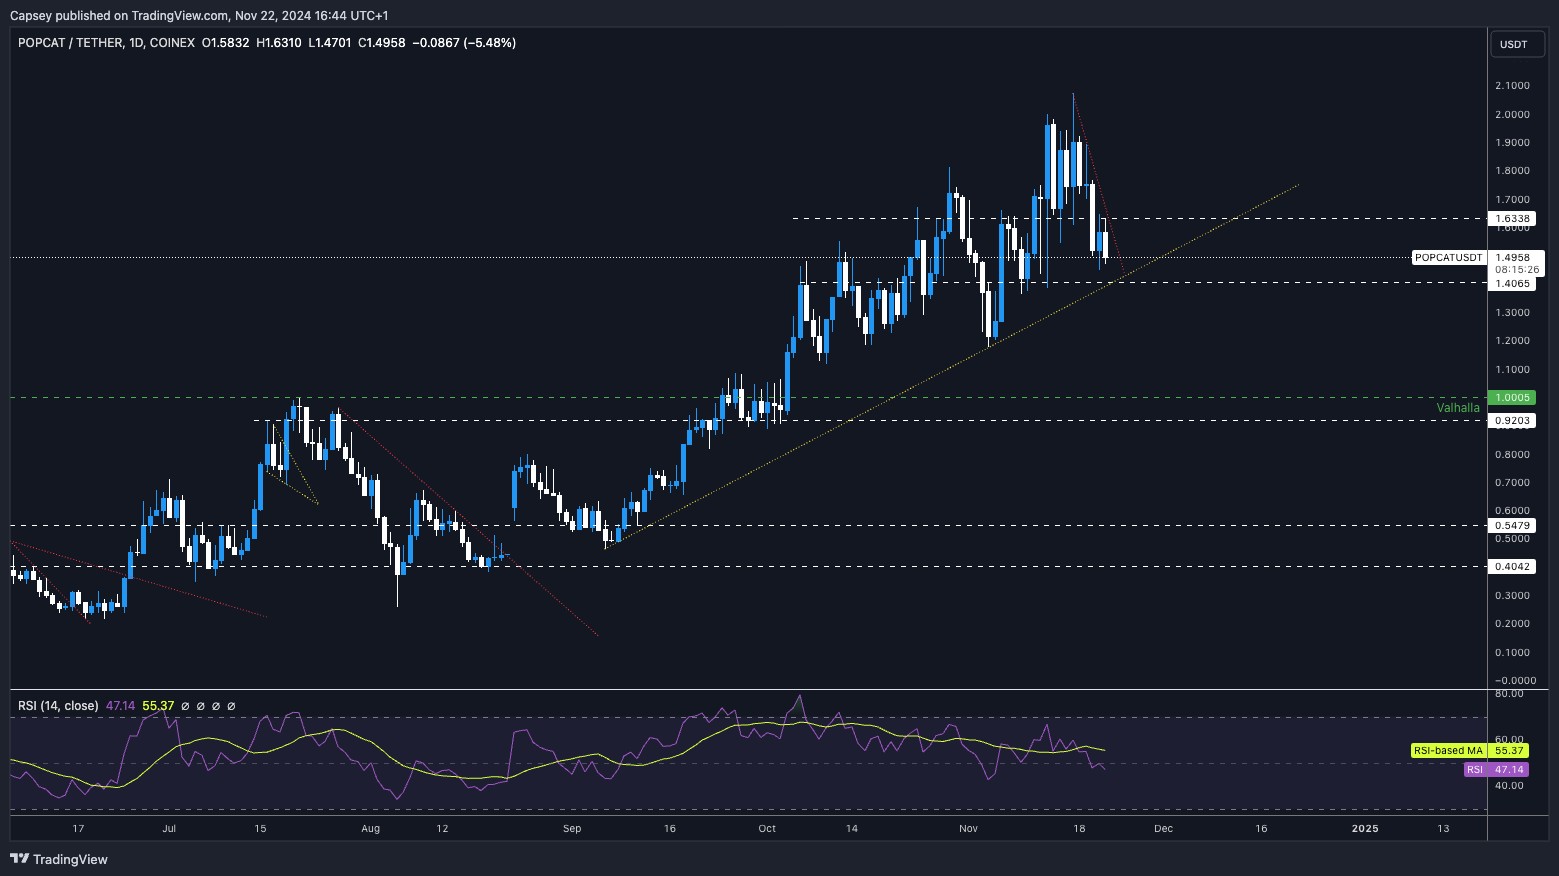
- POPCAT rejected at the $2.00 and has since pulled back and broken below its horizontal support of $1.60.
- POPCAT is now approaching its next major horizontal support at $1.40. Beneath that, the prior low of $1.20 is possible. But we expect $1.40 to hold.
- If POPCAT were to pull back to the $1.30/$1.40 area, it would likely form a hidden bullish divergence (higher low in price and lower low in the oscillator). If we got this, it would be a buy signal.
- POPCAT is squeezing into its pinpoint, where the uptrend line meets the downtrend line. It's possible that this causes a breakdown that sees prices go slightly below $1.40.
- The positive is that the RSI is at 46, which is very low considering the bullish market environment we're in.
Looking for an accurate POPCAT price prediction? Read our analysis to know what’s next for POPCAT!
- Next Support: $1.40
- Next Resistance: $1.60
- Direction: Bearish
- Upside Target: $1.60 (and then $2.00)
- Downside Target: $1.30 - $1.40
Cryptonary's take
So far, major memes have lagged as the attention has swung to the majors which are currently outperforming. We expect the rotation back to major memes will come; it might just take more time. For now, we're holding Spot POPCAT bags, and we'll even look to add if the price reaches close to $1.30.SPX:
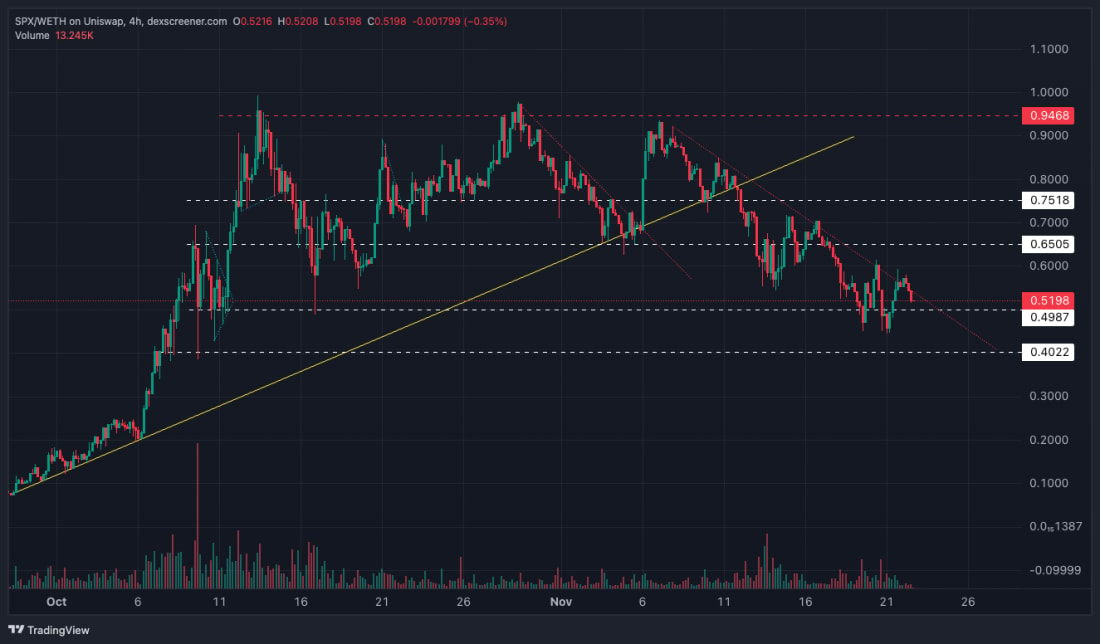
- SPX has continued in its downtrend, respecting its main downtrend line.
- SPX did manage to find support around the $0.45 level, as we expected it might. Price has bounced and struggled to reclaim above its prior high.
- We expect $0.40 to $0.49 will continue to act as a support zone for price. If this zone is lost, we'd expect a more substantial downside as traders capitulate on their positions. However, we're expecting it to hold.
- To the upside, $0.65 is the key level to reclaim, although it is currently a long way off.
- We also note that volumes are generally downtrending, which isn't usually a positive sign.
- Next Support: $0.40
- Next Resistance: $0.65
- Direction: Neutral
- Upside Target: $0.65
- Downside Target: $0.40
Cryptonary's take
It's important that SPX begins to hammer out a base at this lower level and make a more meaningful breakout. For those holding Spot positions, this isn't an attractive area to consider sales. SPX needs to show some strength and begin a major breakout of the downtrend line.A crossing above $0.65 would be that. In the short term, we're expecting more chop, where we're looking for SPX to hammer out that base and, therefore, provide it with a floor to break out from and push on to $0.65.
Recommended from Cryptonary


